Lupine Publishers Group
Lupine Publishers
Menu
ISSN: 2643-6736
Research Article(ISSN: 2643-6736) 
Logical Failure Analysis Diagram by Persian Curve Volume 3 - Issue 1
Abdolrasoul Ranjbaran1*, Mohammad Ranjbaran2 and Fatema Ranjbaran3
- 1Department of Civil and Environmental Engineering, Shiraz University, Iran
- 2Department of Chemical Engineering, Yasuj University, Iran
- 3Department of Mechanical Engineering, Shiraz University, Iran
Received: February 08, 2020 Published: February 15, 2020
Corresponding author: Abdolrasoul Ranjbaran,Department of Civil and Environmental Engineering, Shiraz University, Shiraz, Iran
DOI: 10.32474/ARME.2021.03.000153
Abstract
Failure analysis diagram (FAD) is an important tool in safety assessment of cracked structural systems. Conventional methods for determination of (FAD) is expensive and contain epistemic uncertainty. Toward the remedy, failure is considered as change of state of the system. Based on logical reasoning and concise mathematics a method, called the change of state philosophy is developed and used for analysis of change, and is shown to be a unified tool for development of (FAD). The work is verified via concise logical reasoning and comparison of the results with those of the others.
Keywords: Failure Analysis Diagram;Logical Failure Analysis;Persian Curve;State Functions;Phenomenon Functions
Introduction
A conventional tool for assessing the integrity of structures containing cracks is, fracture mechanics and the failure assessment diagram (FAD) [1-18]. The (FAD) is a combination of the limiting conditions for load, the crack size and fracture toughness or yielding stress. The abscissa is the load ratio and the ordinate is the toughness ratio. The toughness ratio is defined as a function of the load ratio. Classical fracture mechanics contains epistemic uncertainty and is unreliable. As a result, the conventional (FAD) is also unreliable. Change of state philosophy (CSP), which is digested in the Persian curve (PC) is developed as a remedy for removal of uncertainty as follows.
Mathematical Basis
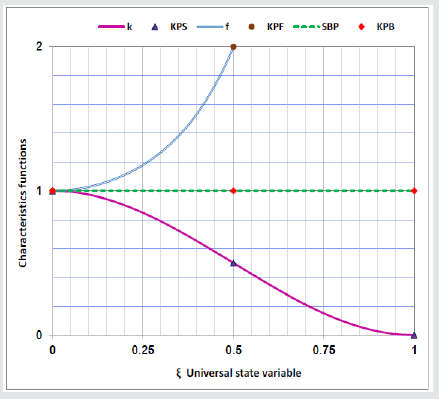
The failure phenomenon is conceived as a change in the state of the system [19-39]. A decreasing parameter (capacity, toughness and etc.) of the system is called stiffness. The inverse of stiffness is called flexibility. The (CSP) formulation is commenced by the obvious Eq. (1) as shown in Figure1, in which (kSS=kS-kC) is the system stiffness at changed state, (kS) is the system stiffness at intact state, (kC) is the change stiffness, (fSS=fS+fC) is the system flexibility at the change state, (fS) is the system flexibility at change state and (fC) is the change flexibility.

Equation (1) is rearranged to obtain the (kSS) and (kC), in Eq. (2):

In which the phenomenon functions (collection of the failure function (FR) and the survive function (SR)) are defined in Eq. (3):

Since obvious concepts are used, then the proposed method is free of epistemic uncertainty. The unknown parameters (kC&fC) should be explicitly determined. The investigation for explicit definition of the aforementioned functions, is continued in the next paragraph via definition and construction of the so called, state functions.Consider (ks = fs= 1) and insert into Eq. (3) to define the destination function (D) and the origin function (O), which are collectively called the state functions and the state ratio (R) in Eq. (4).

The state functions may be considered as solution of the boundary value problems in Eq. (5), in which (min) and (max) denote minimum and maximum respectively:

The (R) with one end in the infinity, is not a good working parameter. Therefore, the state variable (ξ ∈[0,1]) with a zero value (ξ = 0) at the origin and a unit value (ξ =1) at the destination is defined. The state variable is the phenomenon’s abstract lifetime. In terms of the state variable, the boundary value problems in Eq. (5) are rewritten in Eq. (6):

The authors used their experience in structural mechanics, finite element method, mathematics and extensive research [37] to solve Eq. (6). The results is the state functions defined in Eq. (7):

Via definition of the (kSS) and the (fSS) and the concept of crack compliance (fC) in fracture mechanics [4], the authors detected a fact that, the (fC) is directly proportional to the (kS)! This detection is called “the Persian Principle of Change (PPC)”. In view of this principle the (fC) is defined in Eq. (8):

Insertion of Eq. (8) into Eq. (3) concluded in the general definition for the phenomenon functions in Eq. (9):

Toward better definition and preparation for using reliable data, Eq. (9) is rewritten in Eq. (10) in terms of the positive control parameters (aM) and (b) [37].

To this end the proposed formulation is mathematically in abstract form. Consequently, it is a certain universal formulation, in a sense that it is independent of geometry, coordinates, material properties, size and changing agent. Therefore, it equally applies to all natural-phenomena.
Persian Curve
The proposed formulation is derived based on logical reasoning and concise mathematics, consequently, it is reliable and free of epistemic uncertainty. To prepare for determination of control parameters for a phenomenon, the (FR) is renamed as Persian-Fasacurve (PF), the (SR) is renamed as Persian-Shiraz-curve (PS) and the two collectively called the Persian curve (PC), defined in Eq. (11), in which (PO) is the ordinate of the origin point (O) and (PT) is the ordinate of the truncated (end) point (T).

In comply with the vocabulary of human knowledge, the (PS) is the unified equation for capacity and reliability representing a decreasing data and the (PF) is the unified equation for the probability and fragility representing an increasing data. Moreover, in comply with the common practice in stochastic analysis the (probability) density distribution, here called the Persian-Zahedancurve (PZ), and defined as the derivative of phenomenon functions with respect to the ( ξ ) and is casted in Eq. (12), in which (D(1)) is derivatives of (D) with respect to ( ξ ).

In order to determine the control parameters, Eq. (11) is rearranged as in Eq. (13):

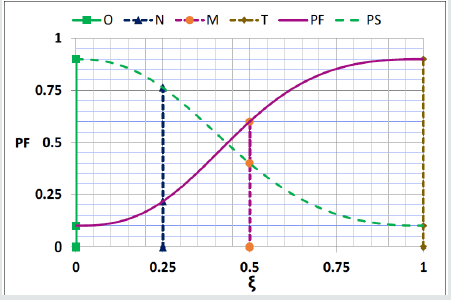
Eq. (13), in terms of control parameters (aM& b) is nonlinear. An artifice is used, to determine the control parameters (aM& b) from Eq. (14) in terms of the (KPS) ordinates, equally applies, to both of increasing and decreasing data as shown in Figure 2.

The Key Points (KPS) are defined as the Origin point (O), the Middle point (M), the end point (T) and the Next point (N) (a point between the other three), in Eq. (15) and shown in Figure 2 for both of decreasing and increasing data:

Unified Persian Curve
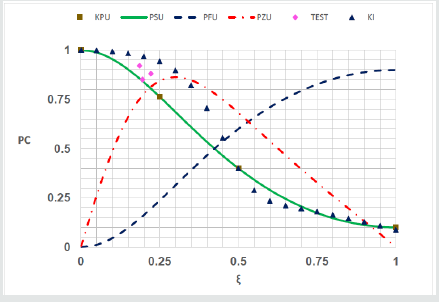
Intensive investigation of the reliable capacity data in the literature [37], concluded into the key points, on the lower bound of capacity, in Eq. (16).
O(0.0,1.0) N (0.25, 0.86) M (0.5, 0.4) T (1.0, 0.1) (16)
Insertion of Eq. (16) into Eq. (14) concluded into the control parameters, in Eq. (17).

Substitution of control parameters in Eq. (17) into Eq. (11) and Eq. (12) concluded in the unified capacity function (PSU), unified fragility function (PFU) and unified density function (PZU), in Eq. (18).

Failure Assessment Diagram
Persian curve is defined in terms of an abstract life time called state variable in a unit interval (ξ ∈[0,1]) . In real phenomena, the lifetime (λ ) is selected in a truncated interval ( [ , ]) o T λ ∈ λ λ , where ( O λ ) is the lifetime origin and ( T λ ) is the lifetime destination. Lifetime is a characteristic of the system. In common practice the ratio (to make it user friendly) of a predefined parameter (FY) and an intentionally defined one (FE) is expressed as lifetime (λ ), as in Eq. (19).

For the case of structural systems (FY) is the yield stress, (FE) is the Euler’s stress and lifetime (λ ) is the relative slenderness ratio, as in Eq. (20). The other parameters are (Le) effective length, (r) is radius of gyration, (E) is initial modulus.

For systems containing flaw the lifetime (λ ) is denoted by (Lr). In order to use the Persian Curve, the lifetime (λ ) should be mapped on the state variable (ξ ), as in Eq. (21).

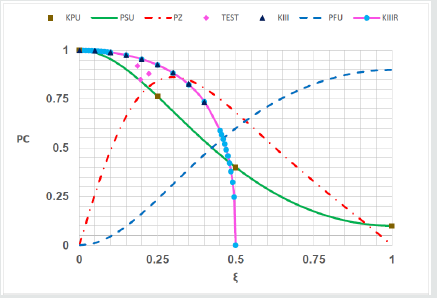
Example 2: Compare the Unified Persian curve with the FAD defined in Eq. (23).

Solution: The FAD from Eq. (23) (KIII) [6, 9, 12, 18] is compared with the unified Persian curve (PSU) in Figure 4. The lifetime is mapped onto the state variable as ( 2.25 ) r L = ξ . A set of test data (TEST) [40] is also shown. The (KIII) goes through the unified key points, but the test results located under it, that is contain uncertainty and is not reliable. In order to show the power of the work in fitting curve on data, the function in Eq. (24) (KIIIR) is also shown in Figure 4.

These figures shown that although all of the conventional (FAD)s go through some of the key points, but overestimate the test results, then contain epistemic uncertainty. The validity of the (PC) as logical (FAD) is verified.
Discussion
The conventional (FAD) is based on conventional fracture mechanics, which is based on singularity of stress at crack tip. Stress singularity at crack tip is a wrong concept, then the conventional fracture mechanics and the (FAD) contain epistemic uncertainty and are not logical. On the other hand, the proposed formulation is logical and reliable. The parameter (Lr) is defined as the ratio of the applied stress over the yield stress. Experience in determination of ultimate strength of structures shown that the combination of the material and geometric properties, in the form of the relative slenderness ratio (λ ), as in Eq. (20), is the necessary and sufficient condition. Note that, Eq. (20) is the inverse of the current definition of (Lr) when applied stress is selected as the Euler’s stress. Consequently, replacement of the (Lr) with the (λ ) is recommended. The (PC) used as (FAD) is necessary and sufficient for failure analysis of structures with cracks.
Conclusion
The following conclusion obtained from this study. The failure phenomenon is conceived as the change of state of the system. Based on logical reasoning and concise mathematics, the change of state is expressed in terms of the Persian curve. The Persian curve is completely calibrated from four key points on real world data. Making use of reliable data in the literature, the unified control parameters and the unified Persian curves are explicitly expressed in term of the state variable. The unified Persian-Shiraz curve (PSU) is proposed as a reliable (FAD). Validity of the (FAD) is verified via concise mathematical logics, and comparison of the results with those of the others. It is shown that the (PC) is sufficient for failure analysis of structures containing cracks.
References
- Ainsworth RA (1993) The use of a failure assessment diagram for initiation and propagation of defects at high temperature. Fatigue & Fracture of Engineering Materials & Structures 16(10): 1091-1108.
- Alabi AA (2019) Mechanical behavior of high strength structural steel under high loading rates. PhD dissertation, Department of Mechanical and Aerospace Engineering, Brunel University, UK.
- Anderson TL (2005) Fracture mechanics: fundamentals and applications. Taylor and Francis Group LLC, USA.
- Arafah DZR (2014) Fracture assessment of cracked components under biaxial loading. PhD Dissertation, Department of Mechanical Engineering, Polytechnic of Milano, Italy.
- Bach M (2008) Constraint-based fracture mechanics analysis of cylinders with circumferential cracks. Structural Engineering and Mechanics 47(1): 131-147.
- Bloom JM (1995) Deformation plasticity failure assessment diagram (DPFAD) for materials with non-Romberg-Osgood stress strain curves. Journal of Pressure Vessels Technology, Transactions of the ASME 17: 346-356.
- Coelho GC, Silva AA, Santos MA, Lima AGB, Santos NC(2019) Stress intensity factor of semielliptical surface crack in internally pressurized hollow cylinder- a comparison between BS 7910 and API 579/ASME FSS-1 solutions. materials 12(7): 1042.
- Dai Y, Liu Y, Qin F, Chao yJ, Chen H (2020)Constraint modified time dependent failure assessment diagram (TDFAD) based of C(t)-A2(t) theory for creep crack. International Journal of Mechanical Sciences 165: 105193.
- Dias O (2014) Failure assessment on effects of pressure cycle induced fatigue on natural gas pipelines. MSC thesis, Department of Materials Engineering, University of Lisbon, Portugal.
- Irfaee MM (2019) Effect of mixed mode loading on fatigue and fracture assessment of a steel twin box- girder bridge. MSc Thesis, Department of Civil and Environmental Engineering, Colorado State University, USA.
- Kofiani KN (2013) Ductile fracture and structural integrity of pipelines & risers. PhD Dissertation, Department of Mechanical Engineering, Massachusetts Institute of Technology, MIT, USA.
- Lie ST, Pillai VS (2019) Safety assessment of damaged multi-planar square hollow section welded joints using the new BS 910: 2013 + A1: 2015. Advances in Applied Sciences 4(1): 11-22.
- Lie ST, Yang ZM (2009) BS7910:2005 failure assessment diagram (FAD) on cracked circular hollow section (CHS) welded joints. Advanced Steel Construction 5(4): 406-420.
- May PS (2001) The effect of welding residual stresses on the fracture resistance of ductile steels. PhD Dissertation, Department of Mechanical Engineering, Imperial College of Science, Technology and Medicine, UK.
- Meek C (2017) The influence of biaxial loading on the assessment of structures with defect. PhD dissertation, School of Mechanical, Aerospace and Civil Engineering, University of Manchester, UK.
- Montassir S, Yakoubi K, Mostabchir H, Elkhalfi A, Rajak DK, et al. (2020) Analysis of crack behavior in pipeline system using FAD diagram based on numerical simulation under XFEM. Applied Sciences 10(17): 6129.
- Pillai VS, Kolios A, Lie ST(2019) Failure assessment of cracked uni-planar square hollow section T-, Y- and K-joints using the new BS 7910:2013+A1:2015. Archives of Applied Mechanics 89(2): 835-845.
- Schaser MS (2013) Material specified load combination factors for option 2 FAD curves. MSc Thesis, Department of Civil Engineering, Cleveland State University, USA.
- Amirian P, Ranjbaran A (2020) Studying the effect of fundamental structural period on the seismic fragility curves of two-span integral concrete box girder bridges. IranJSci Technol, Trans B: Eng 44(1): S11-S26.
- Baharvand A, Ranjbaran A (2020) Seismic fragility functions grounded on state-based philosophy: Application to low to midrise steel frame buildings. KSCE Journal of Civil Engineering 24: 1787-1798(2020).
- Ranjbaran A (2010) Analysis of cracked members: The governing equations and exact solutions. IranJSci Technol, Trans B: Eng 34(4):407-417.
- Ranjbaran A, Shokrzadeh AR, Khosravi S (2011) A new finite element analysis of free axial vibration of cracked bars. Int J Numer Methods Biomed Eng 27(10):1611-1621.
- Ranjbaran A (2012) Analysis of cracked members: Free vibration, buckling, dynamic stability. Lap Lambert Academic Publishing Saarbrucken Germany.
- Ranjbaran A (2012) The dynamic stability analysis application to beam like structures. Lap Lambert Academic Publishing Saarbrucken Germany.
- Ranjbaran A (2013) The finite element method for research: Interesting and innovative ideas. Lap Lambert Academic Publishing Saarbrucken Germany.
- Ranjbaran A, Rousta H (2013) Interaction diagram for dynamic stability by Laplace transform. NED University Journal of Research 10(1):31-38.
- Ranjbaran A, Rousta H (2013) Finite element analysis of cracked beams innovative weak form equations. NED University Journal of Research 10(1): 39-46.
- Ranjbaran A, Rousta H, Ranjbaran M, Ranjbaran M (2013) Dynamic stability of cracked columns; the stiffness reduction method. Scientia Iranica 20(1):57-64.
- Ranjbaran A, Rousta H, Ranjbaran Mo, Ranjbaran Ma, Hashemi M, et al. (2013) A necessary modification for the finite element analysis of cracked members: detection, construction, and justification. Arch Appl Mech 83(7):1087-1096.
- Ranjbaran A, Ranjbaran M (2014) New finite-element formulation for buckling analysis of cracked structures.J Eng Mech 140(5): 04014014(1-10).
- Ranjbaran A (2014) Free-vibration analysis of stiffened frames.J Eng Mech 140(9): 04014071.
- Ranjbaran A (2016) New generalized weight function for stress intensity factor. NED University Journal of Research 13(1): 33-42.
- Ranjbaran A, Ranjbaran M (2016) State functions the milestone of fracture. Archive of Applied Mechanics 86(7): 1311-1324.
- Ranjbaran A, Ranjbaran M (2017) State based buckling analysis of beam-like structures. Archive of Applied Mechanics 87(9): 1555-1565.
- Ranjbaran A, Ranjbaran M (2017) State based damage mechanics. NED University Journal of Research 14(1): 13-26.
- Ranjbaran A, Ranjbaran M (2017) Innovative theory for the compliance computation in rotors. Scientia Iranica A 24(4): 1779-1788.
- Ranjbaran A, Ranjbaran M, Ranjbaran F (2020) Change of state philosophy & Persian curves. LAP LAMBERT Academic Publishing, Germany pp. 225.
- Ranjbaran A, Ranjbaran M, Ranjbaran F (2020) Building probability functions by Persian curves. International Journal of Structural Glass and Advanced Materials Research 4(1): 225-232.
- Ranjbaran A, Ranjbaran M, Ranjbaran F (2020) A reliable fracture mechanics. International Journal of Reliability, Risk & Safety Theory and Application 3(1): 1-15.
- Gibstein M, Moe ET (1986) Brittle fracture risks in tubular joints. Offshore Mechanics and Arctic Engineering Conference, USA.

Top Editors
-

Mark E Smith
Bio chemistry
University of Texas Medical Branch, USA -

Lawrence A Presley
Department of Criminal Justice
Liberty University, USA -

Thomas W Miller
Department of Psychiatry
University of Kentucky, USA -

Gjumrakch Aliev
Department of Medicine
Gally International Biomedical Research & Consulting LLC, USA -

Christopher Bryant
Department of Urbanisation and Agricultural
Montreal university, USA -

Robert William Frare
Oral & Maxillofacial Pathology
New York University, USA -

Rudolph Modesto Navari
Gastroenterology and Hepatology
University of Alabama, UK -

Andrew Hague
Department of Medicine
Universities of Bradford, UK -

George Gregory Buttigieg
Maltese College of Obstetrics and Gynaecology, Europe -

Chen-Hsiung Yeh
Oncology
Circulogene Theranostics, England -
.png)
Emilio Bucio-Carrillo
Radiation Chemistry
National University of Mexico, USA -
.jpg)
Casey J Grenier
Analytical Chemistry
Wentworth Institute of Technology, USA -
Hany Atalah
Minimally Invasive Surgery
Mercer University school of Medicine, USA -

Abu-Hussein Muhamad
Pediatric Dentistry
University of Athens , Greece

The annual scholar awards from Lupine Publishers honor a selected number Read More...


