Lupine Publishers Group
Lupine Publishers
Menu
ISSN: 2641-1709
Opinion(ISSN: 2641-1709) 
An Actual Statistical Problem with Model Selection Volume 2 - Issue 5
Kurt Neumann*
- Independent researcher in Szolgagygörpuszta, Kerékteleki, Hungary
Received:July 08, 2019; Published: July 17, 2019
Corresponding author: Kurt Neumann, Independent researcher in Szolgagygörpuszta, Kerékteleki, Hungary and Principal of EIS Kft, Budapest, Hungary
DOI: 10.32474/SJO.2019.02.000146
Introduction
This article is a follow up of my meanwhile published opinion about the risks of usage of statistical standard software in SJO in medicine by statistically insufficiently trained users because my experience strongly indicates, the scientific burden of providing evidence about the results of the published data is frequently transferred to actual laymen in statistical and mathematical science while the trained physicians usually do excellent work for their patients. The original problem was brought to my attention by a client whose intelligence was judged by me as very high. You know that such and other clients have serious concerns about confidentiality with respect to their data. This is the reason for my decision to protect the identity of this very client and I have transformed his data that is shown in this manuscript such that my intended purpose can be communicated but there is no clue to the original data of my actual client. The problem(s) with the transformed data used set here are semantically identical to the original, however. My experience as long term statistical trainer and as university lecturer and private consultant showed that almost everybody has today Microsoft Excel available on his personal computer. This is the reason that I show the problem data and interim and my final solutions based on Excel for your convenience. My previous article in SJO attempted to provide the reader with some information of rating the human factor. This article will provide the interested reader with the data and the preliminary result as I received it from my client, and I plan to publish a subsequent manuscript to SJO with my expert solutions and a discussion about possible practical consequences.
Opinion
Background Information about Client’s Objectives
My client sent me an email with the data and some preliminary results of his personal objectives and analyses and wrote to me: “There are two factors X1 and X2 influencing a target value Y. I have already evaluated the simple linear regressions of X1 with Y and of X2 with Y in enclosed Excel file. From my view as amateur statistician I do not see any strong functional relationship between X1 and X2 on the Y’s data. Kurt what do you think?”
The Client’s Data and Analyses
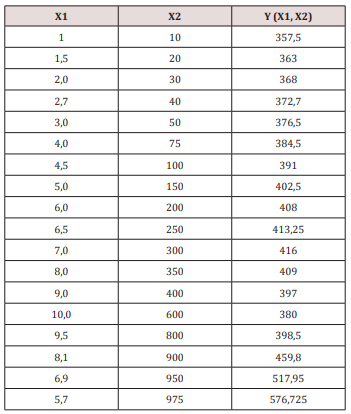
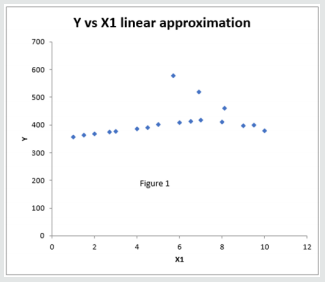
The following table contains the observed data from my client, transformed as mentioned before (Table 1). The Figure 1 below displays the raw data and Excel states the linear approximation has a correlation coefficient r=0.343 and p=0.163 which is statistically not significant at the standard 5% level for the first type error and the estimated coefficients of the equation are:
Y=372.256 + 6.8856. X1+residuals
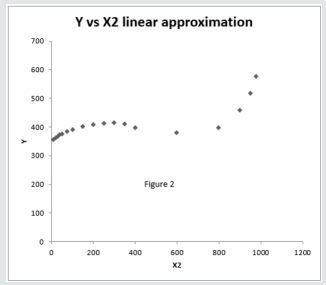
The Figure 2 below displays the raw data and Excel states the linear approximation has a correlation coefficient r=0.7994 and p=0.00006876 which is statistically highly significant at the standard 5% level for the first type error and the estimated coefficients of the equation are:
Y=366.146 + 0.129242. X2 + residuals
My first analysis step was to use the Excel function group “data analysis” (which must be activated prior to its first usage) and I did choose the statistical function Regression with variable X1 and X2 vs Y in a linear statistical model. In case you could not find “data analysis” in the Excel version of your PC your IT colleagues or dealer can help you.
Excel showed me the following results in the approximation of the simultaneous model fitting with X1 and X2: Y= 397.644 – 8.69016. X1 + 0.178521. X2 + residual
The correlation coefficient was reported from Excel as r=0.85668 and had a significance level p<0.05 with p=0.000048736 and this was somewhat smaller than for the X2 evaluation alone.
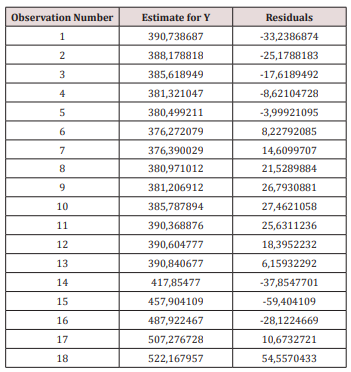
In addition, the residual variances were for X1 alone V(X1) =2948.78 and for X2 alone V(X2) =1206.68 while for X1 and X2 V (X1, X2) =948.839 was the best result in goodness of fit assessment. The symbol V(something) refers to the residual variance in the statistical results (see there under the Analysis of variance tables). Another numerical section of Excel data analysis software (see regression plot options residuals plot) is shown below (Table 2). The observation number in the table above is the running line number (not displayed) in the data table of X1, X2 and Y. The number of decimals shown in the prior text and result were chosen according to the best of Microsoft Excel standards or my taste. I hate discussions about numbers of decimals unless required by law or scientific standards. The fact section of my example is now ending here. You or your consulting statistician can now try to decide which of the model’s results are sufficient for going back to me with your decision. My alternative offer is that you think and work thru two or more optional work steps to find a better statistical model with a sound statistical justification for this data set.
Limitation of Liability
As neither Microsoft or other standard software providers or publishers provide any warranties or liabilities for their products, I join their community and declare that under no conditions I will definitely not accept any liability or similar legal consequences for the use of this manuscript.
Discussion/Conclusion
It is widely accepted that humans are quite complex structures (mechanically, chemically, biologically and psychologically, …) and medical science has made huge progress over at least two centuries. Nevertheless, medical science (as well as other sciences) has today not yet reached a status of complete scientific understanding and maybe this situation will persist for very long time in the future. I think that a major reason for this fact is the high degree of complexity of humans combined with financial constraints in research budgets. Another factor is the problem of an extremely high number of variables in the scientific evaluation of humans and combinatorial science tells us that current methods of research will need many thousands of the full human world population have to participate in medical research for many thousands of human generations. This problem is meanwhile accepted, and you could yourself look for more details under the term of “curse of dimensionality”. I was deeply impressed that Albert Einstein’s forecast of gravitational waves required about a century for being empirically verified. I was deeply impressed by Fred Schneiweis’ publication on the visualization of the simultaneous assessment of efficacy and tolerability of medical interventions in an early 1990’s paper in the drug information journal. As a current, scientific reviewer for another peer reviewed publisher (see frontiersin.org), I am depressed to see that almost every actual scientific publication that appears at my desk treats the complex high dimensional medical data strictly as a list of univariate evaluations for every or the most important variables in medicine. In my personal scientific perspective, I think, it would be a great progress to evaluate at least two variables simultaneously and the consequences of assessing up to about a handful of variables could be the right way to overcome this limiting situation in medical science as a complimentary medical methodological approach. My experience with students and clients indicates, that it is wise to demonstrate the benefits of providing an example in two dimensions as our brain is capable of understanding three dimensions as well geometrically as in this manuscript, but I do know that an overwhelming majority of scientists (including myself) has mentally similar constraints in understanding more than three dimensions as I have myself. In the planned next manuscript, I will briefly show and discuss the possible huge economic benefits of this methodological approach.

Top Editors
-

Mark E Smith
Bio chemistry
University of Texas Medical Branch, USA -

Lawrence A Presley
Department of Criminal Justice
Liberty University, USA -

Thomas W Miller
Department of Psychiatry
University of Kentucky, USA -

Gjumrakch Aliev
Department of Medicine
Gally International Biomedical Research & Consulting LLC, USA -

Christopher Bryant
Department of Urbanisation and Agricultural
Montreal university, USA -

Robert William Frare
Oral & Maxillofacial Pathology
New York University, USA -

Rudolph Modesto Navari
Gastroenterology and Hepatology
University of Alabama, UK -

Andrew Hague
Department of Medicine
Universities of Bradford, UK -

George Gregory Buttigieg
Maltese College of Obstetrics and Gynaecology, Europe -

Chen-Hsiung Yeh
Oncology
Circulogene Theranostics, England -
.png)
Emilio Bucio-Carrillo
Radiation Chemistry
National University of Mexico, USA -
.jpg)
Casey J Grenier
Analytical Chemistry
Wentworth Institute of Technology, USA -
Hany Atalah
Minimally Invasive Surgery
Mercer University school of Medicine, USA -

Abu-Hussein Muhamad
Pediatric Dentistry
University of Athens , Greece

The annual scholar awards from Lupine Publishers honor a selected number Read More...


