Lupine Publishers Group
Lupine Publishers
Research ArticleOpen Access
Functional and Morphological Changes in Diabetic Macular Oedema: Baseline Correlations, and Changes with Pharmacological Treatments Volume 3 - Issue 2
Saker Saker1*, Marco U Morales1, Furat Raslan2, Mazen M Sinjab3, Craig Wilde1 and Winfried M Amoaku1
- 1Academic Ophthalmology, Division of Clinical Neurosciences, University of Nottingham, Nottingham NG7 2UH, United Kingdom
- 2Neurosurgery Department, Dar Al Shifa Hospital, Kuwait
- 3Eye Clinic, Medcare Hospitals and Centres, Dubai, United Arab Emirates
Received:February 11, 2021; Published:March 8, 2021
Corresponding author: Saker Saker, Academic Ophthalmology, Division of Clinical Neuroscience, University of Nottingham, Queen’s Medical Centre, Nottingham, NG7 2UH, United Kingdom.
DOI: 10.32474/TOOAJ.2021.03.000159
Abstract
This study aims to evaluate the ability of MAIA MP in detecting early changes in retinal function not only with the analysis of retinal sensitivity, but also with the analysis of fixation behaviour in eyes with diabetic macular oedema, and investigate their correlation with central macular thickness measured with OCT and visual acuity (LogMAR) at baseline and in 3 months from commencing treatment intravitreal anti-VEGF therapies. 23 consecutive patients with clinically significant diabetic macular oedema presenting to the practice of the University Hospital, Queen’s Medical Centre, Nottingham, were recruited into this study. The morphological changes and VA data in our cohort confirm the clinical efficacy of treatments of DMO with intravitreal injections of ranibizumab. The morphological changes of macular thickness, intraretinal cysts or subretinal fluid (SRF) on OCT decreased in all internal subfields at 3 months with treatment compared to baseline values. The measurement of visual function with MP may be considered as an important tool to better diagnose retinal pathologies as part of multimodality imaging, responding to the need to combine morpho-functional information, and combining different images from different measurement technologies.
Introduction
Several pharmacologic agents are now available for the treatment of DMO including anti-VEGF agents [1-6] and corticosteroids [1-11]. The introduction and frequency of these treatments has coincided with the introduction of less invasive investigating and monitoring systems including OCT [12-17] and fundus related perimetry, also known as microperimetry (MP) [18, 23]. OCT is now well established in the evaluation of DMO, especially with the recent advances with spectral domain models [1-27]. It has contributed significantly to our understanding of the anatomical changes of DMO and the intra-retinal damage and provides a valuable tool for the follow-up of macular oedema [14]. Carpineto, et al. [22] studied the role of MP in evaluating fixation patterns and retinal sensitivity in patients who had clinically significant macular oedema with a diffuse pattern and type 2 diabetes mellitus. Furthermore, Okada, et al. [21] demonstrated a significant correlation between retinal sensitivity as measured by MP, visual acuity and foveal thickness as measured by OCT in eyes with DMO. Previous studies have also investigated the role of MP and fundus autofluorescence (FAF) in evaluating outcomes in DMO treated with laser photocoagulation and micro pulse laser photocoagulation [18]. More recently, Comyn, et al. [28] reported functional and morphologic changes in eyes treated with ranibizumab or laser photocoagulation in the LUCIDATE Study. Similarly, Reznicek, et al. [29] and Kim, et al. [30] have reported functional outcomes of DMO eyes treated with anti-VEGF therapies. These available MP studies on DMO, however, used the first generation of MP technology (MP-1, Nidek Co; Japan) [18,22] where the analysis of fixation stability was not studied as a main outcome of visual function affected by DMO. A more recent study by Kim, et al. [30] used the spectral OCT/SLO system (Optos OCT SLO, Optos, Scotland).
MP allows for the exact topographic correlation between fundus abnormalities and corresponding functional alterations by integration, with different methods, of differential light
threshold (more commonly known as retinal sensitivity) and fundus imaging. The Nidek MP-1 is a mesopic test that requires pupil dilation or a 5–10 min dark light adaptation before starting the examination. The Optos system relied on pupil dilatation and 15-minute dark adaptation used a fixation target in the shape of a cross of 1° size and the MP was performed with Goldmann III size dot stimuli utilising 13 stimulus points and a four to two staircase strategy [31]. More recently, Centervue (Padova, Italy) developed a 3rd generation of MP systems, the Macular Integrity Assessment (MAIA). The greatest advantage of the MAIA is the ease of the operation since it does not require mydriasis; the much lower cost compared to other instruments is an added advantage. It utilizes the Scanning Laser Ophthalmoscope (SLO) technology to image the retina with higher resolution (of 1024 x 1024 pixels) and a more effective eye tracker to monitor the eye movement at 25 times per second improving reliability and usability for operators and patients [18-31]. In addition, the MAIA is the only instrument that offers automatic estimates on PRL characteristics during early and late fixation [31]. This study aims to evaluate the ability of MAIA MP in detecting early changes in retinal function not only with the analysis of retinal sensitivity, but also with the analysis of fixation behaviour in eyes with DMO and investigate their correlation with central macular thickness measured with OCT and visual acuity (LogMAR) at baseline and in 3 months from commencing treatment intravitreal anti-VEGF therapies.
Methods
In a prospective, observational case series study, 23 consecutive patients with clinically significant DMO (Table 1A, 1B) presenting to the practice of WMA in the University Hospital, Queen’s Medical Centre, Nottingham, were recruited into this study from August 2013 to July 2014. This study was approved by the institutional review body (National Research Ethics Service Committee ref: 12/EM/0116; R&D ref 12OY004). Full ophthalmological assessment was done. Informed consent was obtained from all the participants. Subjects received intravitreal injections of ranibizumab (Novartis UK, Frimley Park) 0.5mg in 0.5ml at 4 weekly intervals times 3, and then pro re nata as per NICE TA 237. By implication, all eyes had DMO with foveal thickness of 400 microns or more. Logarithm of the minimum angle of resolution (LogMAR) best-corrected visual acuity (BCVA) was evaluated by means of an Early Treatment of Diabetic Retinopathy Study chart (ETDRS). Foveal thickness was measured with the Topcon 2000 OCT (Topcon, Tokyo, Japan). Age, duration of diabetes, haemoglobin A1c (HbA1c) levels, duration of symptoms, history of previous laser photocoagulation, or vitrectomy were recorded. OCT examinations were analysed for vitreomacular adhesion/traction, and cystoid macular changes were quantified. All the participants were assessed for visual function with the Macular Integrity Assessment MP (MAIA MP) instrument (CentreVue, Padua, Italy). Retina sensitivity (RS) and Fixation stability were assessed with MAIA MP over the central retina (10 degrees) projecting 37 light stimuli points with a, “4-2” projection strategy. The examinations were performed at baseline and months 3 after treatment. Main outcome measures were fixation characteristics and mean retinal sensitivities. The MAIA MP images were exported into the Topcon OCT system through the Topcon import-reference-image software for the manual morphological-functional correlation analysis. As the selected MP grid map measures light sensitivity in the central 3mm of the retina, only the standard internal retinal subfields (central, inner superior, inner nasal, inner inferior, inner temporal) as defined in the Age-Related Eye Disease Study (AREDS) [31] were investigated. The outer OCT subfields were ignored in the current analysis. The statistical analysis was performed with linear regression, Pearson’s product-moment correlation coefficient and two-tailed paired t test, without correcting for multiple comparisons, using GraphPad Prism 6. A p value less than 0.05 was considered statistically significant.
Results
Figure 7.3: Linear regression analysis showing the relationship between LogMAR visual acuity (VA) and threshold sensitivity (TS) measured with microperimetry.
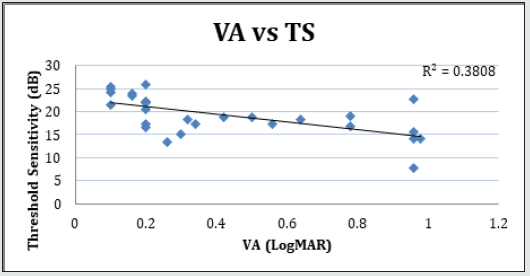
Figure 7.4: Linear regression analysis showing the relationship between LogMAR visual acuity (VA) and fixation stability (P1) measured with microperimetry.
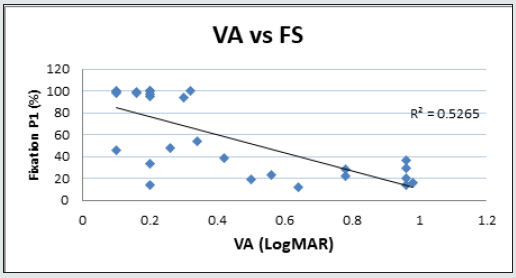
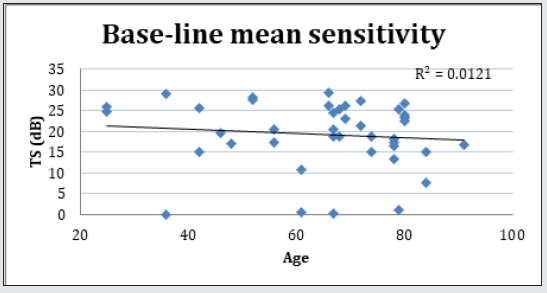
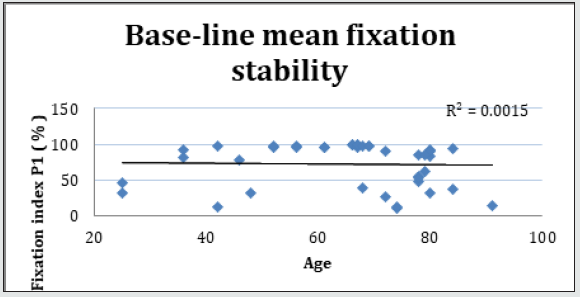
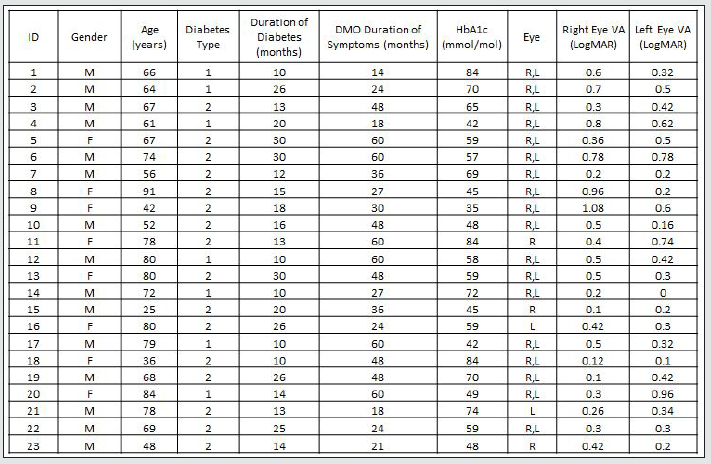
Forty-two (42) eyes of 23 patients with mean age of 65 yearsold (min = 25, max = 91) were recruited into this study. Patient characteristics including age, type and duration of diabetes, haemoglobin A1c (HbA1c) levels, duration of DMO symptoms, and history of previous laser photocoagulation, or vitrectomy are summarised in Table 3 and Table 4. The duration of DMO symptoms/ presence varied from 14 to 60 (average of 30.09 months). LogMAR VAs and OCTs were performed at similar visits. At baseline, MP parameters of mean retinal threshold sensitivity (TS) (Figure 7.1) and fixation stability (FS) (Figure 7.2) demonstrated a wide range of values (TS: mean = 19.27dB, min = 0dB, max = 29.4dB) (FS: mean = 72.4%, min = 11%, max = 100%) at baseline. At baseline, the LogMAR VAs ranged from 0.0 to 0.98. The central macular thickness measured with OCT (central subfield) ranged from 244 to 841 microns at baseline. VA measurements showed higher correlation with functional MP values of TS (r = 0.617) and FS (r = 0.725), than those found with central macular thickness measured with OCT (r = 0.221). These correlations between VA and the MP parameters are presented in Figure 7.3, Figure 7.4, Figure 7.5. The correlation between TS and FS was moderate (r = 0.442), whilst correlation with DMO duration was low as shown in Table 5.
Figure 7.5: Linear regression analysis showing the relationship between visual acuity and central macular thickness measured with OCT.
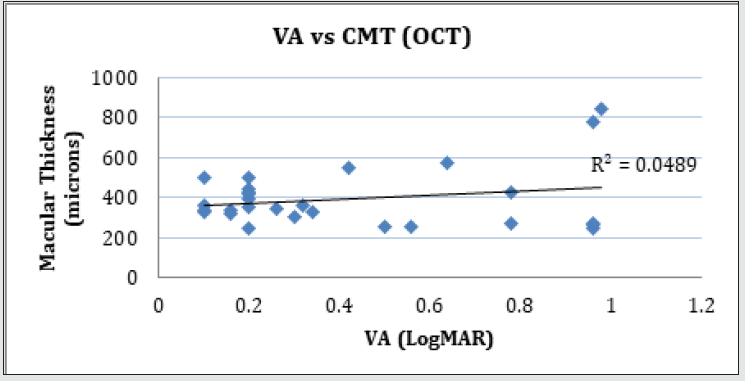
Table 4: Baseline characteristics of participants with clinically significant DMO.
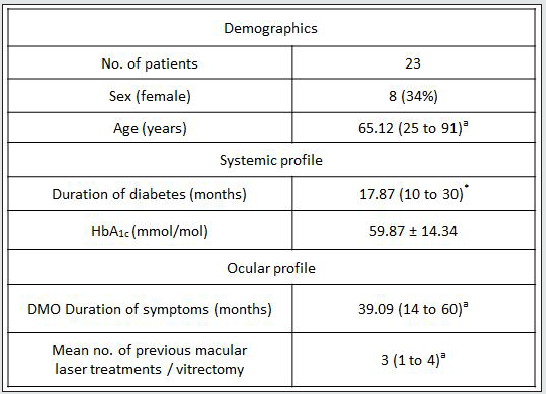
DMO = diabetic macular oedema; HbA1C = glycosylated haemoglobin; HbA1c Levels 20.0 - 59.0 mmol/mol. Data are mean ± SD for normally distributed data or median (Interquartile range) for non-normally distributed continuous data (*); number (%) for categorical data. aNon - normally distributed continuous data.
Figure 7.6: Macular thickness changes in the different internal subfields (Central, Superior, Nasal, Inferior and Temporal) in baseline and 3 months after treatment.
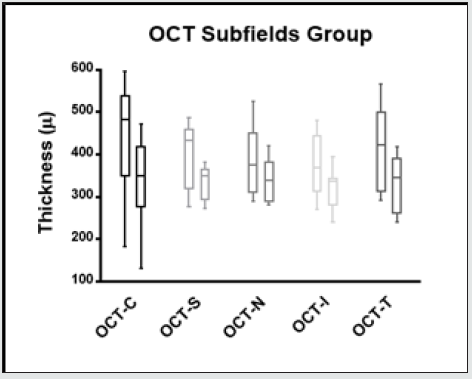
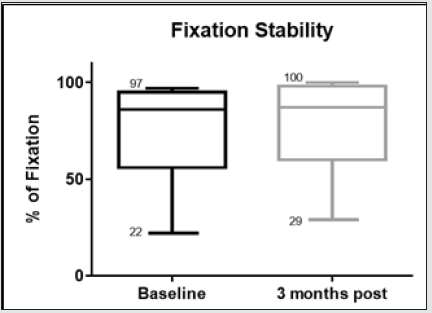
The morphological changes of macular thickness, intraretinal cysts or subretinal fluid (SRF) on OCT decreased in all internal subfields at 3 months with treatment compared to baseline values. In particular the central subfield showed a statistically significant thickness reduction from 445.3 ± 129.9 μ at baseline to 337.4 ± 107.4 μ (p = 0.01). The other OCT internal subfields changes represented in Figure 7.6, also showed statistically significant reductions in thickness (p < 0.05). Changes in intraretinal cysts and SRF also showed significant reduction at 3 months compared to baseline (p<0.05). The LogMAR VA measurements demonstrated an overall improvement over the time (Figure 7.7); however, the changes were not statistically significant (p = 0.12). The TS and FS demonstrated only slight improvements in the minimum and maximum limits as shown in Figure 7.8 and Figure 7.9 respectively the with time, which were not statistically significant (p values of 0.71 and 0.82 respectively). Table summarized the morphological and functional changes 3 months after treatment initiation. The Pearson’s product-moment correlation coefficient at 3 months after treatment commencement showed a higher, although moderate correlation between logMAR VA with both parametric parameters of TS (r = 0.42) and FS (r = 0.58), than the correlation shown with OCT values (r < 0.25), as demonstrated in Table 6.
Figure 7.7: Whiskers box plot indicating variability of LogMAR visual acuity in baseline examinations and 3 months after treatment.

Table 6: Correlation table between CMT and OCT.

Pearson correlation coefficient table in baseline examinations between CMT-OCT LogMAR VA, and microperimetry parameters of TS and FS. CMT-OCT= Central Macular Thickness; FS=Fixation stability TS=Threshold sensitivity; VA=Visual acuity.
Table 7: Changes in OCT, FS, TS, and VA.
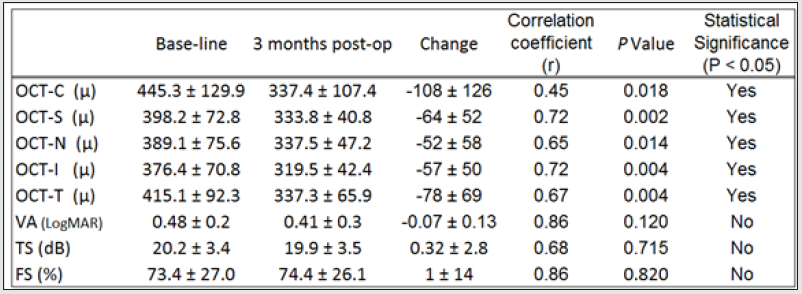
Changes in optical coherence tomography (OCT) macular subfield thickness, FS, TS, and VA at 3 months.A two-tailed paired t test was used to determine statistically significant changes (P values less than 0.05). VA= visual acuity; FS=fixation stability; TS= threshold sensitivity; OCT-C= central OCT subfield; OCT-S= inner superior OCT subfield; OCT-N= inner nasal OCT subfield; OCT-I= inner inferior OCT subfield; OCT-T= inner temporal OCT subfield.
Table 8: Cross correlation between VA, OCT and MP.
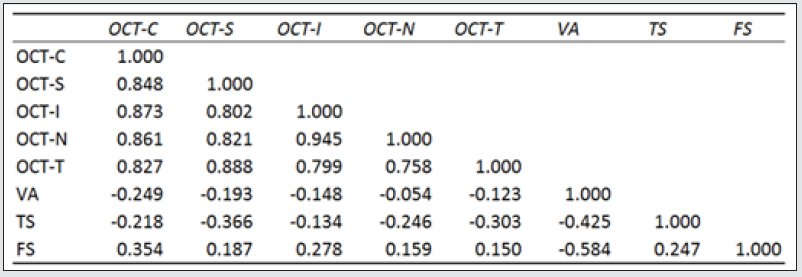
Pearson coefficient correlation at 3 months correlating morphological values (OCT) with LogMAR Visual Acuity, and functional parameters measured with microperimetry (TS=threshold sensitivity and FS= fixation stability).
Figure 7.8: Whiskers box plot indicating variability of threshold sensitivity measured with microperimetry in baseline examinations and 3 months after treatment.
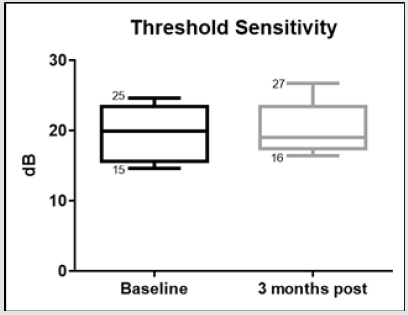
Figure 7.9: Whiskers box plot indicating variability of fixation stability in baseline examinations and 3 months after treatment.
Discussion
The morphological changes and VA data in our cohort confirm
the clinical efficacy of treatments of DMO with intravitreal injections
of ranibizumab. Okada, et al (2006) reported that eyes with DMO
had reduced sensitivity as measured with the Nidek MP1 compared
to eyes with normal macula. Vujosevic, [19] showed a correlation
between VA and MP sensitivity in eyes with DMO. [32] reported
significant correlations between CRT; the functional parameters
of BCVA (in letters) and MP, at baseline and after 3 injections of
ranibizumab. In the study by [30], there was no correlation between
the retinal sensitivity measurements (MP and contrast sensitivity)
with macular thickness measurements on OCT in eyes with DMO,
although the equipment and examination strategies used were
different. The integrity of the IS/OS junction (ellipsoid zone), and
the outer retinal appearance on the OCT may provide adequate
information. This may allow us to distinguish between thin macula,
which is scarred, and which is due to resolution of oedema.
Retinal sensitivity on the Nidek MP1 improved at 12 weeks
in eyes with DMO treated with ranibizumab or laser, and the
improvement continued till week 48. No correlations with OCT
measurements were, however, reported in that study. Our analysis
at baseline demonstrates that LogMAR VA may be more correlated
to functional macular parameters of threshold sensitivity and
fixation stability as measured with MP than morphological changes
measured with OCT. Similarly, there was better correlation between
VA and macular sensitivity (TS and FS) at 3 months after treatment
commencement. Macular oedema associated with retinal
vascular conditions may affect central vision such that significant
reduction leads to the development of eccentric fixation. Generally,
ophthalmologic examinations including OCT and MP are based on
patient’s ability to observe a fixation target, and adequately maintain
that fixation during the examination process. If foveal function is
affected, such examinations may not be accurate as fixation may not
be optimally located over the foveal area, and therefore the central
values reported by OCT, may represent eccentric values. The absence
of significant change in functional measures of VA, and TS and FS
at 3 months compared to baseline may imply that the functional
loss in DMO especially of long duration may not be reversible in
the short-term, as the neural disorganisation may not be reversible.
This suggestion supports that of Vujosevic, et al. [19], that MP may
be useful in predicting functional outcomes in eyes DMO. The DMO
in our patients had been present for long duration and will support
the suggested neural disruption. A larger cohort with recent onset
of DMO would demonstrate better restoration of retinal sensitivity
with treatment. Although the present analysis suggests a stronger
correlation between the MP functional parameters with LogMAR
VA, a longer follow-up with a larger sample test is needed to
confirm these findings. The findings from this study demonstrate
that patients with good visual acuity show highly stable fixation
(P1 > 90%) due to the intact integrity of cone photoreceptors
which describes good foveal vision. Okada [21] have postulated
that mean retinal sensitivities measured with MP are significantly
correlated to visual acuity and foveal thickness. However, the
results from this analysis suggest that fixation stability may be a
new important parameter to describe functional macular function.
The lack of strong correlation between all the measured values,
however, indicates that measurement of visual function with MP
may be considered as an important tool to better diagnose retinal
pathologies as part of multimodality imaging, responding to the
need to combine morpho-functional information, and combining
different images from different measurement technologies. Further
studies are, however, needed to better understand the relationship
between macular morphology and the different parameters of
macular function. The main limitations of this study are the small
number of patients, chronicity of DMO, and short follow-up. A
larger number of patients with recent onset of DMO, followed up
for a longer period will provide further valuable information on
the role of MP in evaluating outcomes in the treatment of diabetic
macular oedema.
References
- Diabetic Retinopathy Clinical Research Network Writing, C, Bressler SB, Edwards, AR, Chalam KV, Bressler NM, Glassman AR, Jaffe GJ, et al. (2014) Reproducibility of spectral-domain optical coherence tomography retinal thickness measurements and conversion to equivalent time-domain. JAMA Ophthalmol 132(9): 1113-1122.
- Elman MJ, Bressler NM, Qin H, Beck RW, Ferris FL 3RD, et al. (2011) Expanded 2-year follow-up of ranibizumab plus prompt or deferred laser or triamcinolone plus prompt laser for diabetic macular edema. Ophthalmology 118(4): 609-614.
- Nguyen QD, Brown DM, Marcus DM, Boyer DS, Patel S, et al. (2012) Ranibizumab for diabetic macular edema: results from 2 phase III randomized trials: RISE and RIDE. Ophthalmology 119(4): 789-801.
- Korobelnik JF, Do DV, Schmidt Erfurth U, Boyer DS, Holz FG, et al. (2014) Intravitreal aflibercept for diabetic macular edema. Ophthalmology 121(11): 2247-2254.
- Mitchell P, Bandello F, Schmidt Erfurth U, Lang GE, Massin P, et al. (2011) The RESTORE study: ranibizumab monotherapy or combined with laser versus laser monotherapy monotherapy for diabetic macular edema. Ophthalmology 118(4): 615-625.
- Massin P, Bandello F, Garweg JG, Hansen LL, Harding SP, et al. (2010) Safety and efficacy of ranibizumab in diabetic macular edema (RESOLVE Study): a 12-month, randomized, controlled, double-masked, multicenter phase II study. Diabetes Care 33(11): 2399-2405.
- Kuppermann BD, Blumenkranz MS, Haller JA, Williams GA, Weinberg DV, et al. (2007) Randomized controlled study of an intravitreous dexamethasone drug delivery system in patients with persistent macular edema. Arch Ophthalmol 125(3): 309- 317.
- Gillies MC, Islam FM, Zhu M, Larsson J, Wong TY (2007) Efficacy and safety of multiple intravitreal triamcinolone injections for refractory diabetic macular oedema. Br J Ophthalmol 91(10): 1323-1326.
- Pearson PA, Comstock TL, Ip M, Callanan D, Morse LS, et al. (2011) Fluocinolone acetonide intravitreal implant for diabetic macular edema: a 3-year multicenter, randomized, controlled clinical trial. Ophthalmology 118(8): 1580-1587.
- Campochiaro PA, Brown DM, Pearson A, Ciulla T, Boyer D, et al. (2011) Long-term benefit of sustained-delivery fluocinolone acetonide vitreous inserts for diabetic macular edema. Ophthalmology 118(4): 626-635.
- Boyer DS, Faber D, Gupta S, Patel SS, Tabandeh H, et al. (2011) Dexamethasone intravitreal implant for treatment of diabetic macular edema in vitrectomized patients. Retina 31(5): 915-923.
- Yang CS, Cheng CY, Lee FL, Hsu WM, Liu JH (2001) Quantitative assessment of retinal thickness in diabetic patients with and without clinically significant macular edema using optical coherence tomography. Acta Ophthalmol Scand, 79(3): 266-270.
- Sanchez Tocino H, Alvarez Vidal A, Maldonado MJ, Morenomontanes J, Garcia Layana A (2002) Retinal thickness study with optical coherence tomography in patients with diabetes. Invest Ophthalmol Vis Sci 43(5): 1588-1594.
- Panozzo G, Gusson E, Parolini B, Mercanti A (2003) Role of OCT in the diagnosis and follow up of diabetic macular edema. Semin Ophthalmol 18(2): 74-81.
- Browning AC, Amoaku WM, Dua HS (2004a) Treatment of agerelated macular degeneration. J R Soc Med 97(4): 166-169.
- Browning DJ, Mcowen MD, Bowen RM JR, O'Marah TL (2004b) Comparison of the clinical diagnosis of diabetic macular edema with diagnosis by optical coherence tomography. Ophthalmology 111(4): 712-715.
- Vujosevic S, Casciano M, Pilotto E, Boccassini B, Varano M, et al. (2011) Diabetic macular edema: fundus autofluorescence and functional correlations. Invest Ophthalmol Vis Sci 52(1): 442-448.
- Vujosevic S, Bottega E, Casciano M, Pilotto E, Convento E, et al. (2010) Microperimetry and fundus autofluorescence in diabetic macular edema: subthreshold micropulse diode laser versus modified early treatment diabetic retinopathy study laser photocoagulation. Retina 30(6): 908-916.
- Vujosevic S, Midena E, Pilotto E, Radin PP, Chiesa L, et al. (2006) Diabetic macular edema: correlation between microperimetry and optical coherence tomography findings. Invest Ophthalmol Vis Sci 47(7): 3044-3051.
- Vujosevic S, Pilotto E, Bottega E, Benetti E, Cavarzeran F, et al. (2008) Retinal fixation impairment in diabetic macular edema. Retina 28(10): 1443-1450.
- Okada K, Yamamoto S, Mizunoya S, Hoshino A, Arai M et al. (2006) Correlation of retinal sensitivity measured with fundus-related microperimetry to visual acuity and retinal thickness in eyes with diabetic macular edema. Eye (Lond) 20(7): 805-809.
- Carpineto P, Ciancaglini M, Di Antonio L, Gavalas C, Mastropasqua L (2007) Fundus microperimetry patterns of fixation in type 2 diabetic patients with diffuse macular edema. Retina 27(1): 21-29.
- Alexander P, Mushtaq F, Osmond C, Amoaku W (2012) Microperimetric changes in neovascular age-related macular degeneration treated with ranibizumab. Eye (Lond) 26(5): 678-683.
- Hee MR, Puliafito CA, Duker JS, Reichel E, Coker JG, et al. (1998) Topography of diabetic macular edema with optical coherence tomography. Ophthalmology 105(2): 360-370.
- Yang CS, Cheng CY, Lee FL, Hsu WM, Liu JH (2001) Quantitative assessment of retinal thickness in diabetic patients with and without clinically significant macular edema using optical coherence tomography. Acta Ophthalmol Scand, 79(3): 266-270.
- Soiberman U, Goldstein M, Pianka P, Loewenstein A, Goldenberg D (2014) Preservation of the photoreceptor layer following subthreshold laser treatment for diabetic macular edema as demonstrated by SD-OCT. Invest Ophthalmol Vis Sci 55(5): 3054-3059.
- Sun JK, Lin MM, Lammer J, Prager S, Sarangi R, et al. (2014) Disorganization of the retinal inner layers as a predictor of visual acuity in eyes with center-involved diabetic macular edema. JAMA Ophthalmol 132
(11): 1309-1316. - Comyn O, Sivaprasad S, Peto T, Neveu MM, Holder GE, et al. (2014) A randomized trial to assess functional and structural effects of ranibizumab versus laser in diabetic macular edema (the LUCIDATE study). Am J Ophthalmol 157(5): 960-970.
- Reznicek L, Cserhati S, Seidensticker F, Liegl R, Kampik A, et al. (2013) Functional and morphological changes in diabetic macular edema over the course of antivascular endothelial growth factor treatment. Acta Ophthalmol 91(7): e529-536.
- Kim YH, Yun C, Kim JT, Kim SW, Oh J, et al. The correlation between retinal sensitivity assessed by microperimetry and contrast sensitivity in diabetic macular oedema. Br J Ophthalmol 98(12): 1618-1624.
- Morales MU, Saker S, Mehta RL, Rubinstein M, Amoaku WM (2013) Preferred retinal locus profile during prolonged fixation attempts. Can J Ophthalmol 48(5): 368-374.
- Davis MD, Gangnon RE, Lee LY, Hubbard LD, Klein BE, et al. (2005) The Age-Related Eye Disease Study severity scale for age-related macular degeneration: AREDS Report No. 17. Arch Ophthalmol 123(11): 1484-1498.


