Lupine Publishers Group
Lupine Publishers
Menu
ISSN: 2637-6695
Research Article(ISSN: 2637-6695) 
Implementation of A Screening Checklist to Improve the Diagnosis of Chronic Kidney Disease in A Safety Net Clinic Volume 3 - Issue 1
Mary Zapczynski*, Cheryl Adair
- Assistant Professor Northwestern State University of Louisiana, College of Nursing and School of Allied Health, USA
Received: April 22, 2021; Published: April 29, 2021
Corresponding author: Mary Zapczynski, DNP, APRN, FNP-BC Assistant Professor Northwestern State University of Louisiana, College of Nursing and School of Allied Health, 1800 Line Avenue, Shreveport, Louisiana 71101
DOI: 10.32474/LOJNHC.2021.03.000154
Abstract
Background: Chronic kidney disease (CKD) is a significant public health problem affecting one in seven American adults. Risk factors for developing CKD are hypertension, diabetes, hyperlipidemia, obesity, heredity, acute kidney injury, age and gender. Hypertension and diabetes are the major causes. Chronic kidney disease is asymptomatic in the early stages. Most affected individuals are unaware of the condition until the disease has progressed. Vulnerable populations are disproportionately affected by CKD. Members of cultural/ethnic minorities, the poor and elderly, migrants are at higher risk for developing CKD and experiencing faster progression. The uninsured/underinsured individuals often seek medical care at safety-net clinics. They are less likely to receive evidence-based care for their CKD or receive a timely referral to nephrology. Early identification of CKD indicators in highrisk individuals and aggressive treatment of underlying causes can stop or slow CKD progression. Late diagnosis is associated with poor outcomes including end stage kidney disease requiring lifelong dialysis or transplant. Most individuals with CKD receive medical care in the primary care setting. Primary care providers are in the optimum position to identify early indicators of CKD and to provide aggressive management of underlying causes. Guidelines for identifying and treating CKD have been available since 2002. Less than 40% of primary care providers adhere to the guidelines. Lack of guideline awareness, time constraints, confusion about the guidelines and fear of incorrectly labeling an individual with CKD are reasons. As a result, chronic kidney disease is under diagnosed and under treated.
Purpose: The purpose of this project was to implement a screening checklist to improve the recognition of chronic kidney disease by providers in a safety net clinic.
Procedure: A screening checklist adapted from the Kidney Disease: Global Outcomes Quality Initiative clinical practice guidelines was implemented in the safety net clinic over three months. Frequency of provider documentation of CKD indicators and diagnoses were measured.
Results: The checklist improved provider recognition of CKD indicators, but did not increase the frequency of CKD diagnoses. Conclusion: The results of the project indicated that a checklist improved provider utilization of CKD guidelines to screen for CKD indicators.
Background
Chronic kidney disease (CKD) is the gradual decline of the kidneys ability to filter waste and excess fluid from the body. It is defined as evidence of kidney damage or a glomerular filtration rate (GFR) less than 60 mL/min/1.73 m2 of body surface persisting for more than 90 days (Kidney Disease Improving Global Outcomes (KDIGO), 2017; Inker et.al,[5] 2014; National Kidney Foundation (NKF), 2017). There are no symptoms in the early stages of CKD. Most affected individuals are unaware of the condition until the disease is in advanced stages (Centers for Disease Control (CDC), 2017; United States Renal Data System (USRDS), 2017; Hoerger et al. [4]. Prevalence of chronic kidney disease stages 1 to 3 rose from 12% in 2000 to 15% in 2014. This increase is directly related to the rise in diabetes (USRDS, 2017; NKF, 2017). Approximately one in three with diabetes and one in five with hypertension will develop CKD. Future predictions are that individuals currently between the ages of 30 and 60 years have a 50% chance of developing some level kidney disease at some point in their lives Hoerger et al. [4]. Medicare spending for individuals with CKD who are not on dialysis reached 100 billion dollars in 2015. Fifty billion of those dollars was spent for those 65 years of age and older. Seventy percent of the amount was spent on care for patients with comorbidities of diabetes, congestive heart failure or both. These dollar amounts do not include the cost to Medicaid or private insurers (USRDS, 2017; National Institute of Diabetes and Digestive and Kidney Disorders (NIDDK), 2016). The impact of CKD on society is related to early morbidity and mortality. Most individuals with progressive kidney disease will die from cardiovascular related events before they require dialysis or transplantation Hoerger, 2015; Inker et.al. [5].
Clinical Practice Guidelines for CKD
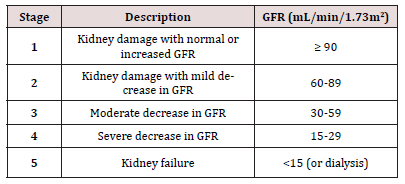
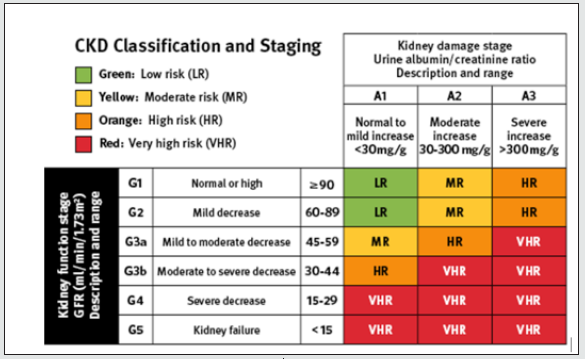
In 2002, the NKF - Kidney Disease Outcomes Quality Initiative (KDOQI) Work Group published the first Clinical Practice Guidelines for Chronic Kidney Disease Evaluation, Classification, and Stratification. The guidelines provided a mechanism for determining the stage or severity of CKD related to a decline in the GFR. The established normal GFR is 100-125 ml/min/1.73 m2. Stage 1 indicates a mild decline in kidney function; Stage 5 indicates kidney failure requiring dialysis or transplant Inker et.al.[5]. (Figure 1) illustrates the KDOQI staging for CKD. In response to the worldwide increase in CKD, the Kidney Disease Improving Global Outcomes (KDIGO) Work Group conducted a systematic review of the literature and recommended revisions to the KDOQI guidelines. Enhancements to CKD classification and staging included the cause of CKD, splitting of Stage 3 into 3a and 3b, urine albumin/creatinine ratio, and risk stratification for disease progression (KDIGO, 2013) [7]. Glomerular filtration rate is the basis for staging kidney disease. The GFR cannot be directly measured; rather, it can be estimated by inserting the serum creatinine value into equations that account for age, gender, race and body size. The method for measuring serum creatinine was standardized across the globe in response to the KDIGO recommendations. The eGFR is considered a reliable indicator of kidney function and is currently calculated and reported each time a serum creatinine is drawn (KDIGO, 2013; Inker et.al, 2014). (Figure 2) illustrates the enhanced CKD classification and staging framework.
Indicators of CKD
The primary marker of kidney damage in kidney disease is an increased excretion rate of albumin in the urine. The gold standard for quantifying the rate of urine albumin and creatinine excretion has been the 24-hour urine collection. However, studies demonstrate that a measure of the albumin to creatinine ratio (UAC) in a random urine sample provides a close estimate of a 24-hour rate. A measurement of albumin excretion exceeding 30 mg per gram of creatinine per day indicates kidney damage. Urine albumin to creatinine ratio is currently the preferred method of estimating albumin excretion. Other markers of kidney damage are urine sediment, electrolyte imbalances, and structural abnormalities detected by imaging studies (Inker & Levey, 2014).
The Safety Net
The Affordable Care Act significantly reduced the number of uninsured Americans by expanding the Medicaid program (Centers for Medicare and Medicaid Services (CMS), 2018) [2]. Those not eligible for Medicaid and unable to pay for health insurance seek healthcare in safety-net facilities. The safety-net comprises federally and community funded health centers, county health departments, access-to-care programs in homeless shelters, faith-based health clinics and public hospitals.Safety-net facilities operate as nonprofit organizations and rely extensively on public and private funding. Primary care services and chronic disease management are provided to individuals regardless of the ability to pay or of immigrant status. Fees for service range from income based sliding scales to no cost Tuot & Grubbs.[12]. Most individuals who rely on care from the safety-net are from racial and ethnic minority groups, with low socioeconomic status and poor health literacy Tuot & Grubbs [12]. They experience a disproportionate share of the burden of CKD and associated co-morbidities. African Americans in the safety-net are three times more likely than Caucasians to progress to ESRD. Hispanics and Asians are two times more likely to progress (Hall, 2012; NKF, 2017). Poor health outcomes for patient in the safety-net are driven by patient-level, providerlevel and system-level factors. Patient-level factors that predict the progression of chronic disease are homelessness, substance abuse, depression, periodontal disease, health behaviors, knowledge, health literacy, English proficiency and trust. These factors are difficult to overcome Tuot & Grubbs, [12].
Provider-level factors include limited knowledge of CKD and awareness of available clinical practice guidelines (Tuot & Grubbs, 2015; Peeters et al., 2014). Awareness of CKD among PCPs is low throughout the U.S. healthcare system, ranging from 10-60%. The result is that patients are more likely to have progressive disease by the time it is detected Tuot & Grubbs,[12]. System-level factors affecting CKD patients in the safety-net are availability of providers, fragmented care, overworked PCPs, a shortage of nephrology providers and changes in health insurance. Intervention or involvement of nephrology providers in the care of CKD patients is associated with slower disease progression. However, uninsured patients have difficulty obtaining a referral to specialty care because of the cost Tuot & Grubbs,[12].
Approaches to Improve CKD Detection in Primary Care
The problem of guideline adherence in the primary care setting is well documented (Peeters et al,[10]. Methods of improving guideline adherence for CKD include computerized checklists, development of online clinical pathways to answer provider questions, clinical decision support systems (CDSS) with links to guidelines, and continuing education for providers (Gulla et al., 2017; Peeters, et al., 2014). In some safety-net clinics, patient records are handwritten. Computer implementation of a checklist or CDSS is not possible.
Purpose and Significance of Research
The purpose of this quality improvement project was to evaluate whether a screening checklist will increase provider awareness of CKD risks and indicators in high-risk patients in a safety-net clinic. Objectives included: 1) development of an evidence-based checklist from published CKD guidelines 2) increased provider awareness of CKD risk in patients with diabetes and/or hypertension 3) and improved healthcare outcomes for patients at risk for developing CKD. A needs assessment was conducted among a group of nurse practitioners and student nurse practitioners attending a pharmacological continuing education conference in September 2017. A five-question survey was administered via Kahoot. IT to ascertain whether the respondents treated patients with hypertension, diabetes and chronic kidney disease in their practice setting. Twenty-four of 27 answered “yes.” A question assessing barriers to treating patients with CKD netted twenty-two responses: 2 indicated time constrains; 13 indicated knowledge/comfort level in diagnosing CKD; and 7 indicated knowledge/comfort level in treating CKD. The final question examined respondents’ attitudes towards CKD. Twenty-eight answered: 15 indicated that CKD was more than they wanted to handle and would prefer to refer the patient; 13 indicated that CKD was a challenge they were willing to undertake. The results of the needs assessment validate findings in the literature regarding knowledge and comfort level in diagnosing and treating CKD.
Procedure
Project Design
The project design was an intervention post-test only with a comparison group. A retrospective chart review was utilized to determine the rate of documentation of CKD indicators and diagnoses between the intervention and comparison groups.
Ethical Consideration
Expedited approval for this quality improvement project was obtained from the Institutional Review Board at Northwestern State University of Louisiana prior to initiation. Approval was based on the probability of no greater than minimal risk to the participants. Although informed consent was not necessary, a statement of explanation to the providers involved in utilizing the checklist was placed at the top of the checklist.
Data Collection and Treatment
Screening for CKD consisted of providers reviewing patients’ medical records and completing the checklist. The investigator reviewed medical records of all patients who attended the Tuesday and Thursday specialty clinics between April 1 and June 30, 2018. A confidentiality agreement with the safety-net clinic was signed by the investigator. Permission was obtained from the facility’s executive director to access the facility schedules to select the applicable records.
Data collected from the records was recorded on a computerized excel spreadsheet. Age, race/ethnicity, gender, body mass index, risk factors for developing CKD, lab indicators of CKD, and evidence of provider documentation of CKD indicators and/ or diagnoses was recorded. The same data was collected from the comparison group. No identifying information for either provider or patient was collected.
Setting
The project was conducted in a community safety net clinic in the southern United States. The clinic provided management of chronic diseases at no charge to uninsured and underinsured adults. Facility staff assigned patients to clinics according to their healthcare needs. The Tuesday clinic served as the intervention group and the Thursday clinic as the comparison group.
Participants
Provider participation in the project was voluntary. A total of eight providers were included: two NPs and one physician in the Tuesday clinic and four NPs and one physician in the Thursday clinic. No randomization of providers to clinic groups occurred. Each provider was assigned to a specific clinic by facility staff and administration prior to the project. There was no crossover between providers and clinic groups; the providers in the Tuesday clinic were different from those in the Thursday clinic.
Intervention
The intervention was a five-item chronic kidney disease screening checklist developed by the investigator using the current KDIGO Clinical Practice Guideline for the Evaluation and Management of Chronic Kidney Disease (KDIGO, 2013). Each question required the provider to circle a “yes” or “no” response. The first two questions determined risk for developing CKD by diagnosis of hypertension and/or diabetes. The remaining questions were aimed at identifying indicators of CKD within the patient record i.e., eGFR ≤ 60ml/min/1.73m2, urine albumin ≥20mg/L by dipstick, and urine albumin to creatinine ratio ≥ 30 mg/g. The final items on the checklist asked the participant to select whether or the patient had risk factors for CKD or a diagnosis of CKD. The checklist was affixed to the medical record for each patient scheduled in the Tuesday clinic for three months. Each checklist remained in the record until the end of the project.
Data Analysis
Analysis of data was conducted using SAS software Version 9.4. The information of interest was documentation of CKD indicators and/or diagnoses by providers in the patient record. A χ2 test of independence was computed to compare the frequency of CKD indicators identified in the lab and documentation of those indicators and/or diagnoses of CKD by providers.
Demographics
A total of 52 patient records were entered in this project: 27 in the intervention group and 25 in the comparison group. Demographics included age, gender, and race/ethnicity. Variables were summarized using descriptive statistics to generate frequency and percentages.
The demographics were similar between groups. The mean age was 50.0 years and ranged from 23 years to 73 years. Of 52 patients, 19 (36.5%) were male and 33 (63.46%) were female. Twenty-one (40.4%) were African Americans, 19 (36.0%) were Hispanics, 7 (13.5%) were Caucasians and 5 (9.6%) were another ethnicity.
Risk Factors
Data collected as risk factors for developing CKD were a diagnosis of hypertension and/or diabetes, hyperlipidemia, and the calculated body mass index (BMI). Inferential statistics were performed when possible, using the chi square test of independence. Of the 52 patients, 38 (73.1%) had a diagnosis of hypertension, 28 (53.9%) had a diagnosis of type 2 diabetes, and 22 (42%) had dual diagnoses. Forty-six (92%) had a diagnosis of hyperlipidemia; the mean body mass index (BMI) was 33.8 ranging from 22.1 to 61.1. The chi square test of independence was performed to determine the frequency of a dual diagnoses for hypertension and diabetes between the intervention and comparison groups. There was no significant statistical difference between the groups (χ2(1) =.0057, p >0.05).
Indicators
The chi square test of independence was performed comparing the frequency of all CKD indicators identified in the lab records between the intervention and the comparison group (eGFR < 60 mL/min, microalbuminuria >20 by dipstick, and a urine albumin to creatinine ratio > 30mg/gm) before and after the intervention. Although the intervention group had a larger percentage of records with CKD indicators than the comparison group, no statistically significant difference was noted (χ2 (1) = 2.2264, p > 0.05. The frequency of specific CKD indicators found in the medical record was determined. Of 52 patient records, 100% had a reported eGFR. Two records (7.4%) had eGFR values <60 mL/min/1.73. Of 52 patient records, 47 (90.4%) had urine tested for albumin by dip stick. To determine the scope of abnormal findings, the chi square test of independence was performed to determine the frequency of results for albumin ≥ 20mcg between the intervention and control groups. The results were equivocal (χ2 (1) = 6.0517, p = 0.05). An elevated urine albumin on dipstick requires an albumin-creatinine ratio (ACR) to quantify the results. Of the 21 records with elevated albumin by dipstick, 12 (85.7%) in the intervention group and none (0%) in the comparison had an ACR. The chi square test of independence was performed to determine the frequency of ACR obtained when albumin ≥ 20mcg between the intervention and control groups. The results were statistically significant (χ2 (1) = 14.0, p, 0.05). Of the 12 patient records with ACR obtained to quantify albumin ≥ 20mcg in the intervention group, 8 (66.7%) had a result >30mg/gm.
Documentation
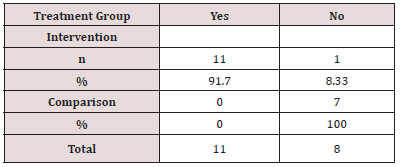
Documentation of CKD indicators and diagnoses in the patient record demonstrates improvement in provider awareness. Of 19 patient records with CKD indicators identified in the lab, 11(91.7%) in the intervention group were documented. The chi square test of independence was performed comparing the frequency of provider documentation of identified CKD indicators in the medical record between the intervention and comparison group. The results were statistically significant (χ2(1) =9.794, p < 0.05). (Table 1) illustrates this analysis.
Table 1: Frequency of Documentation of CKD Indicators in the Medical Record Note: Statistics for documentation of indicators χ2 DF =1, Value = 9.7942, Probability =0.0018.
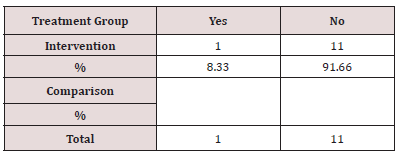
Of 12 patient records with indicators of CKD found in the lab, 1(8.33%) had a documented diagnosis of CKD. (Table 2) illustrates the frequency of CKD diagnosis documented in the patient record.
Documentation of either CKD indicator or diagnoses was 68% intervention group vs. 28% comparison group. The chi square test of independence was performed comparing the frequency of documentation of CKD diagnoses and/or indicators in the medical record between the intervention and the comparison group. The results were statistically significant (χ2 (1) = 8.396, p < 0.05). (Table 3) illustrates this analysis.
Table 3: Frequency of Documentation of CKD Diagnosis and/ or Indicators in the Medical Record.
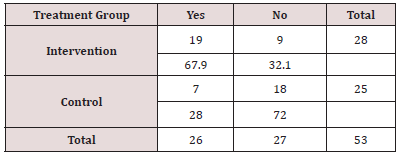
Note: Statistics for documentation of CKD diagnosis and/or indicators
χ2 DF =1, Value = 8.3955, Probability = 0.0038
Discussion
The overarching objective of this quality improvement project was to improve healthcare outcomes for patients at risk for developing CKD. Twelve medical records in the intervention group had lab indicators of CKD. Provider utilizing the checklist documented CKD indicators in 11(97%) of 12 medical records. In the comparison group, seven medical records had lab indicators of CKD, but no provider documentation was noted. Only one medical record in the intervention group had a documented diagnosis of CKD. These results demonstrated that a screening checklist improved provider recognition of CKD indicators, but did not increase CKD diagnosis. While no significant difference was identified in the number of medical records with lab indicators of CKD, a statistically significant difference was identified in the documentation of those indicators by providers in the intervention group. Additionally, providers in the intervention group asked if they should order lab indicated by the checklist when a specific result was not found in the medical record. Action in the form of referral to urology or nephrology and suspension of non-steroidal anti-inflammatory (NSAIDs) medications was noted in the plan of care in five records within the intervention group. This indicated an improved utilization of the KDIGO CKD guidelines.
Indicators of kidney damage include a urine albumin to creatinine ration >30mg/gm and an eGFR < 60 mil/min. In patients with diabetes, glycemic control is monitored by a glycated hemoglobin (HbA1c). The goal for HbA1c is tailored to the patient’s needs with 7% representing a common target (KDIGO, 2012). During data collection and analysis, it was noted that patients with a diagnosis of diabetes (risk factor for CKD) who had a glycated hemoglobin (Hb A1c) higher than 8% often had urine albumin to creatinine ratios exceeding 30mg/gm and an inflated eGFR (>150 mL/min/m2). Glomerular hyperfiltration in diabetes is thought to predispose an individual to irreversible nephron damage (Tonnejick, Muskiet, Smits et al, 2017). Aggressive treatment of serum glucose to target levels is necessary to prevent CKD development and progression.
Recommendations
There are several actions that will improve the recognition of CKD among primary care providers in the safety-net clinic. The NKF has launched a nationwide campaign to raise awareness of CKD guidelines among primary care providers. Educational programs developed by the NKF are available for providers. The checklist should be altered to include an algorithm of next steps for to take once CKD indicators are identified. A CKD registry may be helpful to keep track of patients when indicators are present. In the absence of a comprehensive CKD registry, centralizing the patients’ diagnoses on a single form in the medical record may help providers utilizing the screening checklist.
Competing Interest
The authors declare that there are no commercial or financial relationships that could constitute as potential conflicts of interest in the conduct of the research.
Funding statement
The authors declare that this study received no form of financial support or funding from any institution.
Authors’ Contributions
Mary Zapczynski conceptualized and carried out the research as part of the Doctor of Nursing practice. Cheryl Adair supported the researcher and prepared the manuscript.
References
- Centers for Disease Control and Prevention (CDC) (2017) Deaths: Final data for 2015 [PDF]. National Vital Statistics Reports 66(6).
- Centers for Medicare and Medicaid Services (2018) Medicaid expansion and what it means to you.
- Gulla J, Neri P, Bates D & Samal L. (2017) User requirements for a chronic kidney disease clinical decision support tool to promote timely referral. International Journal of Medical Informatics 101: 50-57.
- Hoerger TJ, Simpson SA, Yarnoff BO, Pavkov ME, Burrows NR, et.al. (2015) The future burden of CKD in the United States: A simulation model for the CDC CKD initiative. American Journal of Kidney Disease 65(3): 403-411.
- Inker LA, Levey AS (2014) Staging and management of chronic kidney disease. In SJ Gilbert, DE, DS Gipson, MA Perazella & M Tonelli (Eds.), National Kidney Foundation’s primer on kidney diseases (pp. 458-466). Philadelphia, PA: Elsevier Saunders. USA
- Kidney Disease Improving Global Outcomes (2017) Controversies conference on definition,
classification, and prognosis in CKD. - Kidney Disease Improving Global Outcomes (2013). KDIGO 2012 clinical practice guideline
for the evaluation and management of chronic kidney disease 3(1). - National Institute of Diabetes and Digestive and Kidney Diseases (NIDDK) (2016). Kidney disease statistics for the United States.
- National Kidney Foundation (2017) What is kidney failure?
- Peeters MJ, van Zuilen AD, van den Brand, Bots ML, et.al. (2014) Nurse practitioner care improves renal outcome in patients with CKD. American Society of Nephrology, Journal, 25(2): 390-398.
- Tonneijck L, Muskiet MH, Smits MM, van Brommel EJ, Heerspink HJ, (2017) Glomerular hyperfiltration in diabetes: Mechanisms clinical significance and treatment. Journal of the American Society of Nephrology 28(4): 1023-1039.
- Tuot, D, Grubbs V (2015) Chronic kidney disease care in the US safety net. Advances in
Chronic Kidney Disease 22(1): 66-73. - United States Renal Data System (USRDS)(2017) Annual data report highlights.
Editorial Manager:
Email:

Top Editors
-

Mark E Smith
Bio chemistry
University of Texas Medical Branch, USA -

Lawrence A Presley
Department of Criminal Justice
Liberty University, USA -

Thomas W Miller
Department of Psychiatry
University of Kentucky, USA -

Gjumrakch Aliev
Department of Medicine
Gally International Biomedical Research & Consulting LLC, USA -

Christopher Bryant
Department of Urbanisation and Agricultural
Montreal university, USA -

Robert William Frare
Oral & Maxillofacial Pathology
New York University, USA -

Rudolph Modesto Navari
Gastroenterology and Hepatology
University of Alabama, UK -

Andrew Hague
Department of Medicine
Universities of Bradford, UK -

George Gregory Buttigieg
Maltese College of Obstetrics and Gynaecology, Europe -

Chen-Hsiung Yeh
Oncology
Circulogene Theranostics, England -
.png)
Emilio Bucio-Carrillo
Radiation Chemistry
National University of Mexico, USA -
.jpg)
Casey J Grenier
Analytical Chemistry
Wentworth Institute of Technology, USA -
Hany Atalah
Minimally Invasive Surgery
Mercer University school of Medicine, USA -

Abu-Hussein Muhamad
Pediatric Dentistry
University of Athens , Greece

The annual scholar awards from Lupine Publishers honor a selected number Read More...


