Lupine Publishers Group
Lupine Publishers
Menu
ISSN: 2690-5779
Research Article(ISSN: 2690-5779) 
Bioleaching of Basic Metals from Electronic Waste PCBs Volume 1 - Issue 2
Mahdokht Arshadi and Soheila Yaghmaei*
- Chemical and Petroleum Engineering Department, Sharif University of Technology, Iran
Received: January 13, 2020 Published: January 24, 2020
Corresponding author: Soheila Yaghmaei, Chemical and Petroleum Engineering Department, Sharif University of Technology, Iran
DOI: 10.32474/JOMME.2020.01.000108
Abstract
E-waste is an emerging problem that has to be attending worldwide. The best way for E-waste management is recycling. Bioleaching is a novel method to extract metals from E-waste. In this research, bioleaching of Cu and Ni from an E-waste sample was examined using acidophil microorganisms. Different kinds of E-waste were purchased; the sample size reduced to lower than 100 microns. Acidithiobacillus ferrooxidans was adapted to the 15 g/l of the E-waste sample. Eh, pH, bacterial count, and metal recovery were followed in a period of 25 days. By using inductively coupled plasma optical emission spectroscopy (ICP-OES) identified Cu and Ni were recovered respectively 99% on 11th day and 98% on 14th day. The results of field emission scanning electron microscope (FE-SEM), Fourier transform infrared spectrometer (FTIR), and X-ray diffraction before and after bioleaching emphasize the great efficiencyofbioleaching.
Keywords: Bioleaching; E-waste; basic metals; FE-SEM; XRD; FTIR
Introduction
Over the last decade, the electronic industry has succeeded in developing a global selling market [1]. The electronic and electrical instrument at the end of their useful life becomes waste which is called electronic waste (E-waste). E-waste is growing three times faster than other solid waste streams [2]. It is estimated that about 20 -50 million tons of E-waste are manufactured in the world [3]. E-waste’s per capita was estimated to be 6.8 kg for every living person by the United Nations Environmental Program [4]. E-waste contains hazardous materials which are toxic to human health and non-hazardous materials which can be highly valuable [5]. They contain a wide range of metals including precious metals (such as gold and silver), hazardous metals (such as arsenic and mercury), and base metals (such as copper and nickel) [6]. One ton of mobile phone without batteries contains 340 g Au, 140 g Pd, 130 kg Cu, and 3.5 kg Ag [7].
Developed and developing countries are challenged with a serious problem in the disposal and the recycling of E-waste [6]. Until now different processes such as mechanical, pyrometallurgical, and hydrometallurgical were tried to recover precious metals from E- waste [3]. The mechanical process has a low recovery and used as a pretreatment. Other traditional methods produce atmospheric pollution and are not economically. In recent years the researchers had been attended to the biohydrometallurgy. Bioleaching an essential field in the biohydrometallurgy is low cost, environmentally friendly, and efficient processes [8]. Microorganisms (bacteria or fungi) and metals interact in the bioleaching process. By oxidation and reduction reactions, insoluble metals are converted to soluble forms and transferred to the solution [9]. There are many parameters influencing bioleaching such as pH, temperature, pulp density, bacterial growth, particle size, etc. A. ferrooxidans is a wellknown bacterium in the bioleaching process; extensively used to recover basic metals from different solid wastes and ores [10]. The ability of A. ferrooxidans for recovery of basic metals such as Cu, Zn, Pb, Ni, and Sn from E-waste is proven [8]. This bacterium oxidizes the elemental metals existed in the E-waste to the form of their ions within an indirect cyclic mechanism identifying bellow. In the produced cycle, ferric ions as the oxidizing agents mobilize metals having a lower potential-oxidation number than ferric ions (such as Cu, Ni, etc.) [11].

Arshadi et al. [8] studied bioleaching from a combination of E-waste. They introduced the best combination of different types of E-waste (including mobile phone, computers, central processing units, fax machine, copy machine, and television) to recover the maximum amount of Cu, Ni, and Fe as the most important metals inhibiting gold recovery. Under optimal combination Cu, Ni, and Fe were recovered respectively 100%, 54%, and 100% [9]. Hong and Valix (2014) studied the bioleaching of copper from E-waste using A. thiooxidans. Almost complete mobilization of Cu achieved after 14 days at 30℃ [12]. Zhu, et al. studied bioleaching of metals from E-waste by using a mixed culture of acidophilic bacteria. They showed Fe (II) concentration had a significant effect on Cu recovery. Under the optimal condition of 12 g/l pulp density, 12 g/l initial Fe (II), and initial pH 2 96.8% of Cu was recovered [12]. Hudec et al. [13] studied biorecovery of Cu, Ni, and Zn from E-waste using Acidiphilium acidiphilium. The E-waste was crushed at the particle size of 0.8 to 1.7 mm. A. acidiphilium was able to leach Cu and Ni from shredded PCBs, but Ni recovery was not possible [13]. Wang et al. [14] examined bioleaching of Cu, Pb, and Zn from PCBs by A. ferrooxidans. Biorecovery of all the metals were increased by decreasing both sieve fraction of the sample and pulp density. After a period of 9 days copper solubilized 99% [14]. The gap of the study is that the characteristics of the bioleaching process of an E-waste sample are not considered comprehensively. In this study, a pure culture of A. ferrooxidans was used to leach metals from an E-waste sample. The main purpose of this research is evaluating the recovery of Cu and Ni by the time and examining the characteristics of the sample before and after bioleaching process. To evaluate the changes of the sample from functional group, morphology and surface powder, and the component phase aspects the chemical analysis including FTIR, FE-SEM, XRD were performed. Also, growth characteristics including pH, Eh, and bacterial count were adopted to evaluate metal recovery with time. The results proved the great potential of the bio-hydrometallurgical route to recover heavy metals from electronic wastes.
Materials and methods
Microorganisms and Enrichment Culture
Pure culture of A. ferrooxidans was prepared from the Biochemistry Research Center of Sharif University, Tehran, Iran. It was adapted to 15 g/l of the sample by serial passage [15]. The bacterium was adapted by increasing the pulp density of the samples, in steps of 1 g/l started from 1 g/l to 15 g/l. The next step starts when the number of the bacterium reaches to 5×10⁷ [13]. For each step, a 10% v/v inoculation was used which produced in the previous step. The experiments were carried out in 250 ml Erlenmeyer flasks containing 100 ml solution. The shaking rate and temperature were fixed at 130 rpm and 30℃. 9K medium including 0.01 g Ca(NO3)2, 0.1 g KCl, 0.5 g MgSO4.7H2O, 0.5 g K2HPO4, 3g (NH4)2SO4, and 44.22 g Fe2SO4.7H2O as an energy source, per 1 L distilled water was used as the culture solution.
A waste printed circuit boards of different kinds of PCBs (including PCBs of computer (52.83%), mobile phones (25.47%), fax (13.215%), CPU (5.28%), and copy machines (1.03%)) at approximately size of 20 mm was purchased from Pars Charkheshe Asia company located in Tehran, Iran. The sample waste was crushed to the size of lower than 100µm. No more pre-treatment was done. The metal content of the sample was analyzed using X-ray fluoresce analysis (XRF) which is shown in Table 1.
According to Table 1, copper is the most abundant metal in the E-waste sample. Value distribution (Vi) defines the contribution of each metal to the price of that sample presenting by Equation 3 [16]. and are the weight percentage (presented in Table 1) and price of metal i (according to Metal London Exchange at September 2019), respectively.

The total precious of existed metal in Table 1 (  ), is about 2868.35 $/ton while the value of the top ten mines of
the world’s most valuable ores is 2096.8 $/ton, in average [17]. It
has to be noted that the price of the E-waste sample was estimated
without calculating precious metals such as Au and Pd emphasize
on the importance of E-waste recovery. The calculated Vi for metals
are presented in Table 2. Ag and Cu are contributed respectively for
about 47% and 36% of E-waste price expressing all other metals
computed for only 17% (Table 2). Ag is a precious metal which A.
ferrooxidans is not efficient for silver extraction due to its higher
potential oxidation-reduction than ferric ions as oxidant reagent
produced in the cycle make using acidophil bacteria [9]. The
concentration of nickel presents in the E-waste is almost notable.
Ni is more expensive than Al, Pb, Zn, Sn, Ti, and Fe (London Metal
Exchange). Nickel complexes can threaten human society; they are
hazardous and have harmful effects such as heart and liver damage
on the human body [18]. Accordingly; Cu and Ni were selected as
the most important metals for extraction.
Bioleaching Experiments
The experiments were performed at 250 ml Erlenmeyer flasks (containing 100 ml solution) with 10% inoculum, at 130 rpm and 30℃, and Pulp density of 15 g/l. For all of the experiments, the environmental conditions were constant. The bioleaching period was 25 days. The leached metals were analyzed using ICP-OES. The leaching efficiency was calculated by Equation (4). where RM expresses the recovery of Cu and Ni; CM exhibits the concentration of the metal dissolved in solution (ICP-OES results); is the volume of the solutions fixed at 100 ml; MS is pulp density of the E-waste sample equal to 15 g/l; FS shows the amount of metal in samples (XRF results). During the bioleaching period growth characteristics (including pH, Eh, and bacterial count), chemical characteristics (including X-ray diffraction (XRD), Fourier Transform Infrared Spectrometer (FTIR), and Field Emission Scanning Electron Microscope (FE-SEM)), and leaching efficiency of Cu and Ni were studied.
Analytical Methods
The prepared sample was crushed in two stages. First, it was ground to the particles with the dimension of mm using an aviculture industrial instrument, which produces cornmeal (Gharegozlu, Iran). Then, the sample was micronized to the dimension of less than 150μm using a micronizer (HSM 50, Herzog, West Germany). The biorecovery of Cu and Ni was followed until 25 d using an inductively coupled plasma optical emission spectrometry instrument (Vista pro, Australia). All the experiments were done at shaker incubator (Labcon 5082u, South Africa) at 30℃ and 130 rpm, by using 10% inoculums. To identify the initial pH of the sample, 1 g of the sample was dissolved in 50 ml deionized water and shaken for 24 h [19]. Due to the optimal pH of the bacterium about 2-2.5 [20], the pH of the culture was adjusted on 2. It was controlled every day and readjusted on 2. All the measuring for pH was done using a pH meter (Lutron, YK-2001DO, Taiwan). Eh was followed using an Eh meter (Milwaukee, Mi151, Romania). The bacterial growth was estimated by bacterial count using a phase-contrast microscope (Olympus, CH-B145-2, Japan). FE-SEM (AIS-2100, 2005– 2006, South Korea) was used to follow the micromorphology of the initial and remained E- waste sample before and after bioleaching. To determine the chemical composition of the samples X-ray fluorescence spectrum (XRF, Spectro Xepos, Germany) was applied. To detect the component phase of the sample waste XRD (EQUINOX 3000, Inel, France) was used with the current of 30 mA and tube voltage of 40 kV. To follow the functional group variation before and after bioleaching experiments the FTIR (Perkin Elmer, Spectrum Two, USA) was used acting in the infrared region (750 nm to 1mm).
Results and Discussion
The alkaline nature of E-waste sample
The pH of the solid E-waste sample was measured using the procedure expressed in the analytical method section. The initial pH of deionized water was 6.57. After one day, the pH of the sample was 8.07 emphasizing on the alkalinity nature of E-waste [14,21]. The alkalinity nature of E-waste can be related to the presence of alkali and alkaline earth metals such as Na, Ca, Mg, K presented in the E-waste sample [10].
The growth characteristics of the E-waste sample
pH and Eh variation
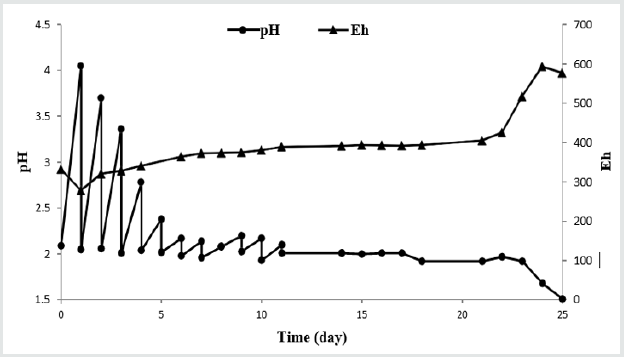
Figure 1 shows the pH and Eh of the samples bioleaching at pulp density 15 g/l in 25 days. The concentration of alkaline metals, the amount of acid production by the A. ferrooxidans, and the amount of added sulfuric acid make pH variance. The alkaline metals have a defined concentration in the E-waste sample, by the time and increasing their leaching efficiency, their concentration increases in the solution. The presence of the alkaline metals leads to pH increasing. sulfuric acid addition manually to the solution or acid production by the bacteria increase the amount of H+ in the solution and lead to pH decreasing. The final pH of the process is the resultant of these three factors. According to Figure 1 until the eleventh day, an increase in pH is observed controlling by sulfuric acid addition. Then, the pH is almost constant until the twentysecond day showing the alkalinity nature of the E-waste sample is neutralized with acid production and acid addition. Between 11th day and 25th day, no sulfuric acid was added to the solution. After 22nd day, the pH decreased to lower than 2 emphasizing on the acid production by the bacterium.
Also, the Eh diagram is drowning in Figure 1. Eh shows Oxidation-Reduction Potential or the tendency of a chemical to oxidize or reduce other chemicals. Eh presents the amount of an oxidant or reductant can be detected in the solution [22]. The amount of Eh in the first day of the process was measured about 300 mv which continuously increases to about 600 at the end day. By decreasing pH, Eh is almost increased continuously. The increasing trend of Eh emphasizes on the increasing of the oxidizer reagents and bioleaching improvement. These results are according to the other researchers finding [14,23-26].
Bacterial count
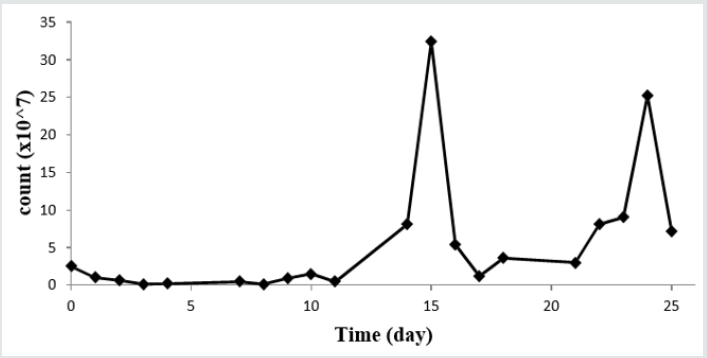
Figure 2 shows the bacterial count in the bioleaching period. By adding the sample on the first day the bacterial count decreased emphasizing on increasing environmental toxicity. The E-waste sample has a toxic effect on the bacterial growth due to the presence of too many metals and the other materials [9]. Due to the inhibitory effect of the presence of the E-waste sample, an almost long lag phase is observed in Figure 2 continued until 14th day. Then, the bacteria entered in the log phase; bacterial count increased sharply to more than 35×107. After the lag phase, A. ferrooxidans counting is always more than 3×10⁷ reported enough for efficient bioleaching [13]. After the lag phase, two similar cycles are observed. These cycles are reported by the previous researches too [27,28]. Probably this cycle is the growth cycle of the A. ferrooxidans, may repeat until the substrate is enough for bacterial growing.
Leaching efficiency of Cu and Ni
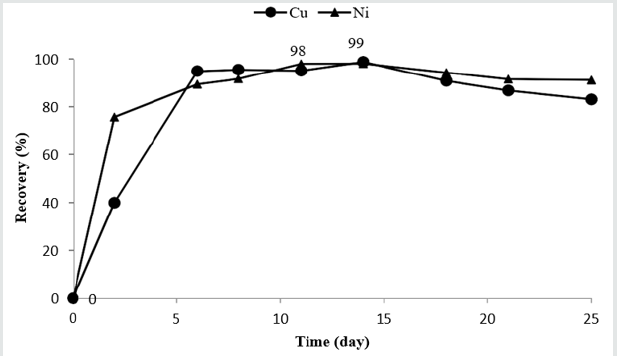
The concentration of leached metals was analyzed at days of 2, 6, 8, 11, 14, 18, 21, and 25 using ICP-OES. The Cu and Ni ions which are present in the inoculum were eliminated from the leached metals at the next days. Figure 3 shows the leaching efficiency of the Cu and Ni in the bioleaching period. By comparing Figure 2 and Figure 3 concluded in the lag phase the amount of leaching efficiency is in the lowest amount but it increases sharply and reaches to the maximum amount in the log phase of the bacterial growth. The maximum amount of Cu is about 99% on 14th day. The Ni is recovered maximally about 98% on 11th day. By the time a decrease in the leaching efficiency of bath Cu and Ni was observed attributing to the jarosite (KFe3(SO4)2(OH)6) formation. According to Figure 1 at the end of the process, the pH decrease. With pH decreasing Fe(III) hydrolyze and Fe(OH)3 is produced. As present in Equation 5 Fe(OH)3 ions tend to form jarosite which is leading to decreasing oxidizing agent and metals recovery presented in Equation 6 [29].
Chemical characteristics of the E-waste sample before and after bioleaching process
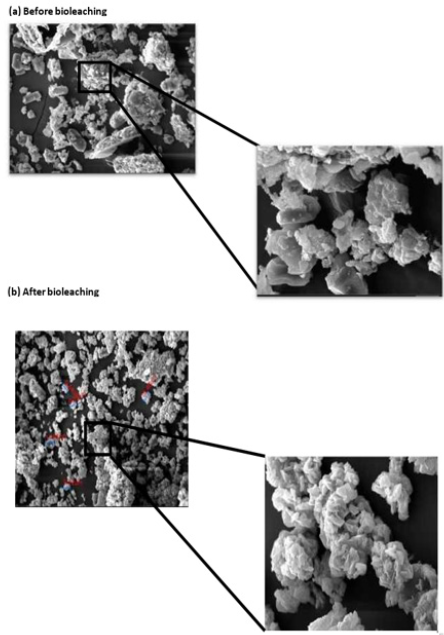
Surface morphology (FE-SEM results): Surface morphology of the sample was observed to check bioleaching progress. Figure 4 shows the FE-SEM results of the E-waste sample before (part a) and after bioleaching (part b) in two magnification of at 50 μm and 5 μm. Before bioleaching, the surface of the sample is smoother and after bioleaching, it is rougher. It validates that the bacterium effect on the surface and E-waste particles eroded with chemical corrosive [30]. Comparison of part (a) and part (b) explains average particle size is reduced reasonably after bioleaching process which emphasizes on the efficiency of bioleaching process; releasing more metals causes more surface corrosion and size reduction.
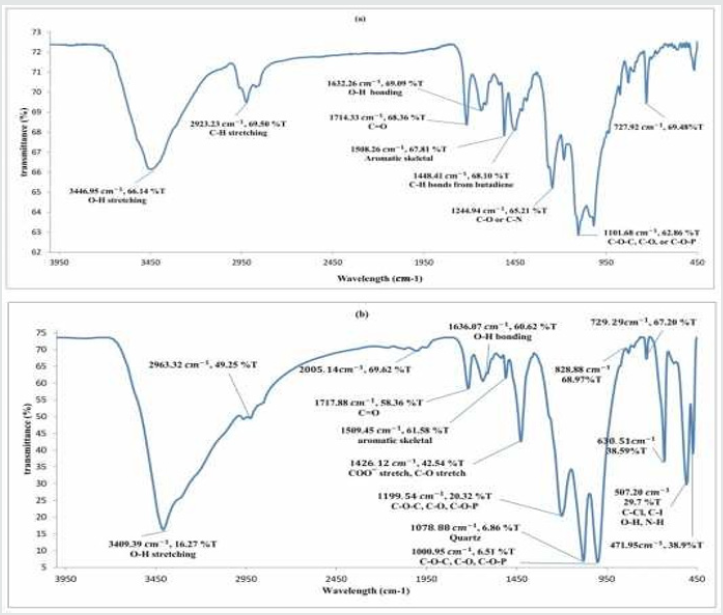
Functional group (FTIR spectrum): To complete data from bioleaching, FTIR a powerful tool for process monitoring was represented. FTIR identifies functional group, material composition, and differences between molecular phases. Every functional group has a unique spectrum peak using to identify both qualitative and quantitative molecule structure. The presence of different materials is recognized by characteristic vibrations [31]. The spectrums were drawn in Figure 5. Part (a) shows the E-waste samples spectrum before bioleaching and part (b) shows the E-waste sample spectrum after bioleaching. Attention to the wavelength of spectrum O-H, C-H aliphatic, C=O, C-O, C-N stretches, and aromatic skeletal has existed at origin samples. After the bioleaching process, twofold bonds broke and some of the functional group changed. By doing bioleaching O-H, COO, C-O, O-H, N-H and C-Cl stretches were produced [31-35]. The wavelength of the most peak of the spectrum at parts (a) and (b) are near to each other but the transmittance is far. The amount of transmittance before bioleaching is higher emphasizing on reducing materials after bioleaching in the remained sediment. At the end of the spectrum, some new peaks such as C-Cl and N-H are seen which reports sedimentation of some salts of the medium due to the presence of (NH4)2SO4 and Ca(NO3)2 in the medium and Cl in the solid waste.
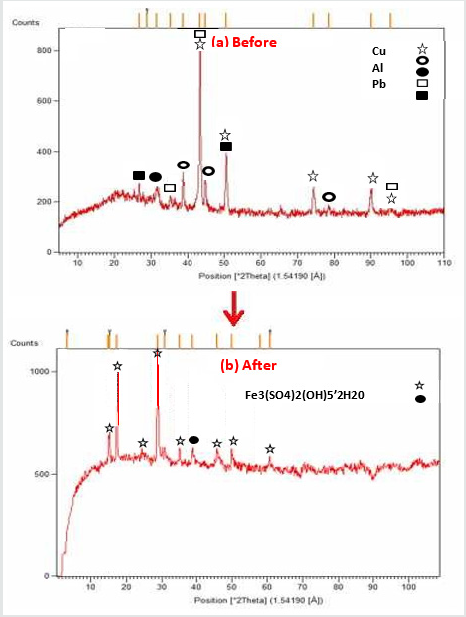
Component phase (XRD analysis): A pure substance has a specific XRD diagram as like as a fingerprint; interaction of X-ray and a crystalline substance obtains a unique diffraction pattern. Same materials produce the same pattern. Even in a mixture of substance, each substance obtains its unique pattern. XRD is used to identify and characterize a substance and just for the crystalline phase and not for amorphous phase [36]. Figure 6 is the X-ray diffraction of the sample before (a) and after (b) bioleaching. Before bioleaching, the crystalline phase of Cu, Al, Pb, Al2O3, and SiO2 is detected. After bioleaching, the previous composition is not detected, showing a sensible amount of materials recovered. The presence of Fe (III) after bioleaching is obvious explaining that a significant amount of Fe2SO4.7H2O contained in the medium is precipitated. Also, it emphasizes jarosite is the dominant phase after bioleaching.
Conclusion
This research confirmed the bioleaching process using A. ferrooxidans is an effective method for metal extraction from E-waste. By decreasing pH, Eh increases. Cu and Ni were extracted respectively 99% at 11th day and 98% at 14th day alike with the maximum bacterial count. FE-SEM showed before bioleaching the sample surface is smoother and after bioleaching is rougher. It can be evidence that by bioleaching the sample surface is eroded by chemical reaction. FTIR showed after bioleaching by material releasing to solution transmittance of peaks decrease. Also, by sediment salts of the medium, some new peaks were produced. XRD diagrams proved the significant amounts of metals are recovered. A new phase of Fe is shown which emphasize on sedimentation of salts of medium and jarosire formation in the bioleaching process.
References
- Realff MJ, Raymond M, Ammons JC (2004) E-waste. Materials Today 7(1): 40-45.
- Brandl H, Faramarzi MA (2006) Microbe-metal-interactions for the biotechnological treatment of metal-containing solid waste. China Particuology 4(2): 93-97.
- Bas AD, Deveci H, Yazici EY (2013) Bioleaching of copper from low grade scrap TV circuit boards using mesophilic bacteria. Hydrometallurgy 138: 65-70.
- UNEP (2007) E-waste: Inventory assessment manual. In: Division of Technology I, and Economics, International Environmental Technology Center ed: United Nation Environmental Problem.
- Widmer R, Oswald-Krapf H, Sinha-Khetriwa D, et al. (2005) Global perspectives on e-waste. environmental impact assessment review 25: 436-458.
- Needhidasan S, Samuel M, Chidambaram R (2014) Electronic waste-an emerging threat to the environment of urban India. Journal of Environmental Health Science and Engineering 12: 36.
- Hagelüken C, Meskers C (2008) Mining our computers-opportunities and challenges to recover scarce and valuable metals from end-of-life electronic Electronic Goes Green, Berlin, Germany.
- Arshadi M, Nili S, Yaghmaei S (2019) Ni and Cu recovery by bioleaching from the printed circuit boards of mobile phones in non-conventional medium. Journal of environmental management 250: 109502.
- Arshadi M, Yaghmaei S, Mousavi SM (2019) Optimal electronic waste combination for maximal recovery of Cu-Ni-Fe by Acidithiobacillus ferrooxidans. Journal of Cleaner Production 240: 118077.
- Arshadi M, Yaghmaei S, Mousavi SM (2019) Study of plastics elimination in bioleaching of electronic waste using Acidithiobacillus ferrooxidans. International Journal of Environmental Science and Technology 16(11): 7113-7126.
- Petter PMH, Veit HM, Bernardes AM (2018) Evaluation of gold and silver leaching from printed circuit board of cellphones. Waste Management 34: 475-482.
- Hong Y, Valix M (2014) Bioleaching of electronic waste using acidophilic sulfur oxidising bacteria. Journal of Cleaner Production 65: 465-472.
- Hudec MAR, Sodhi M, Goglia-Arora D (2009) Biorecovery of metals from electronic waste. 7th Latin american and caribben conference for engineering and thechnology; SAN Cristobal, Venezuela.
- Wang J, Bai J, Xu J, Liang B (2009) Bioleaching of metals from printed wire boards by Acidithiobacillus ferrooxidans and Acidithiobacillus thiooxidans and their mixture. Journal of Hazardous Materials 172: 1100-1105.
- Yang Y, Chen S, Li S, Chen M, Chen H, et al (2014) Bioleaching waste printed circuit boards by Acidithiobacillus ferrooxidans and its kinetics aspect. Journal of Biotechnology, 173: 24-30.
- Cui J, Zhang L (2008) Metallurgical recovery of metals from electronic waste: A review. Journal of Hazardous Materials 158: 228-256.
- Basov V (2017) These 10 mines have the world's most valuable ore. In: Mining.com.
- Meenambigai P, Vijayaraghavan R, Gowri RS, Rajarajeswari P (2016) Biodegradation of heavy metals- A review. International Journal of Current Microbiology and Applied Sciences 5: 375-383.
- Yang J, Wang Q, Wang Q, Wu T (2009) Heavy metals extraction from municipal solid waste incineration fly ash using adapted metal tolerant Aspergillus niger. Bioresource Technology 100: 254-260.
- Nemati M, Harrison STL, Hansford GS, Webb C (1998) Biological oxidation of ferrous sulphate by Thiobacillus ferrooxidans: A review on the kinetic aspects. Biochemical Engineering Journal 1: 171-190.
- Brandl H, Bosshard R, Wegmann M (2001) Computer-munching microbes: metal leaching from electronic scrap by bacteria and fungi. Hydrometallurgy 59(2-3): 319-326.
- Rosemount Analytical I (2008) Fundamentals of ORP measurement In, Emerson process managment Application Data sheet.
- Ilyas S, Ruan C, Bhatti HN, Ghauri M (2010) Column bioleaching of metals from electronic scrap. Hydrometallurgy 101(3-4): 135-140.
- Liang G, Mo Y, Zhou Q (2010) Novel strategies of bioleaching metals from printed circuit boards (PCBs) in mixed cultivation of two acidophiles. Enzyme and Microbial Technology 47(7): 322-326.
- Willner J (2012) Leaching of selected heavy metals from electronic waste in the presence of the At. ferrooxidans bacteria. Journal of Achievements in Materials and Manufacturing Engineering 55: 860-863.
- Amiri F, Mousavi SM, Yaghmaei S (2011) Enhancement of bioleaching of a spent Ni/Mo hydroprocessing catalyst by Penicillium simplicissimum. Separation and Purification Technology 80(3): 566-576.
- Arshadi M, Mousavi SM (2015) Multi-objective optimization of heavy metals bioleaching from discarded mobile phone PCBs: Simultaneous Cu and Ni recovery using Acidithiobacillus ferrooxidans. Separation and Purification Technology 147: 210- 219.
- Arshadi M, Mousavi SM (2014) Simultaneous recovery of Ni and Cu from computer-printed circuit boards using bioleaching: Statistical evaluation and optimization. Bioresource Technology 174(3): 233-242.
- Wang S, Chen L, Zhou X, Yan W, Ding R, et al. (2018) Enhanced bioleaching efficiency of copper from printed circuit boards without iron loss. Hydrometallurgy 180: 65-71.
- Qu Y, Lian B, Mo B, Liu C (2013) Bioleaching of heavy metals from red mud using Aspergillusniger. Hydrometallurgy 136: 71-77.
- Smidt E, Schwanninger M (2005) Characterization of waste materials using FTIR spectroscopy: Process monitoring and quality assessment. Spectroscopy Letters 38(3): 247-270.
- Balart R, López J, García D, Salvador MD (2005) Recycling of ABS and PC from electrical and electronic waste. Effect of miscibility and previous degradation on final performance of industrial blends. European Polymer Journal 41(9): 2150-2160.
- Reena G, Sangita, Verinder K (2011) FT IR studies of e-plastic obtained from obsolete computers. Journal of Chemical and Pharmaceutical Research 3: 660-667.
- Colbert WB (2012) The performance and modification of recycled electronic waste plastics for the improvement of asphalt pavement materials. Michigan technological University, USA.
- Zeng X, Wang F, Sun X, Li J (2015) Recycling indium from scraped glass of liquid crystal display: process optimizing and mechanism exploring. ACS sustainable chemistry engineering 3(7): 1306-1312.
- Inc S (1999) Chapter 7: Basic of X-ray Diffraction. P: 1-25.

Top Editors
-

Mark E Smith
Bio chemistry
University of Texas Medical Branch, USA -

Lawrence A Presley
Department of Criminal Justice
Liberty University, USA -

Thomas W Miller
Department of Psychiatry
University of Kentucky, USA -

Gjumrakch Aliev
Department of Medicine
Gally International Biomedical Research & Consulting LLC, USA -

Christopher Bryant
Department of Urbanisation and Agricultural
Montreal university, USA -

Robert William Frare
Oral & Maxillofacial Pathology
New York University, USA -

Rudolph Modesto Navari
Gastroenterology and Hepatology
University of Alabama, UK -

Andrew Hague
Department of Medicine
Universities of Bradford, UK -

George Gregory Buttigieg
Maltese College of Obstetrics and Gynaecology, Europe -

Chen-Hsiung Yeh
Oncology
Circulogene Theranostics, England -
.png)
Emilio Bucio-Carrillo
Radiation Chemistry
National University of Mexico, USA -
.jpg)
Casey J Grenier
Analytical Chemistry
Wentworth Institute of Technology, USA -
Hany Atalah
Minimally Invasive Surgery
Mercer University school of Medicine, USA -

Abu-Hussein Muhamad
Pediatric Dentistry
University of Athens , Greece

The annual scholar awards from Lupine Publishers honor a selected number Read More...


