Lupine Publishers Group
Lupine Publishers
Menu
ISSN: 2641-1725
Research Article(ISSN: 2641-1725) 
Qualitative and Quantitative Analysis of Centralite 1 and 2 Using High Performance Thin Layer Chromatography Method Volume 5 - Issue 4
Namir Halilović1,2* and Azra Bašić Halilović3,4
- 1Department of Chemistry, University of Sarajevo, Bosnia and Herzegovina
- 2Ammunition Surveillance Laboratory, Armed Forces BH, Bosnia and Herzegovina
- 3Faculty of Pharm and Health, University of Travnik, Bosnia and Herzegovina
- 4Institute for Biomedical Research and Diagnostics GENOM, Travnik, Bosnia and Herzegovina
Received: October 02, 2020; Published: October 13, 2020
*Corresponding author: Namir Halilović, Department of Chemistry, University of Sarajevo, Bosnia and Herzegovina and Ammunition Surveillance Laboratory, Armed Forces BH, Bosnia and Herzegovina
DOI: 10.32474/LOJMS.2020.05.000216
Abstract
In this paper, we examined the possibility of using high performance thin layer chromatography for the qualitative and quantitative determination of Centralites 1 (1,3-diethyl-1,3-diphenylurea) and 2 (1,3 dimethyl-1,3-diphenylurea). For this purpose, we developed new method in which we find an appropriate mixture of carrier solution, as a key factor in the development of the method, using a mixture of toluene, acetone and cyclohexane. We confirmed in the experiment that mixtures of 9 vol. toluene and 1 vol. acetone for Centralites 1 or 2, and 4 vol. toluene and 6 vol. cyclohexane for diphenylamine stabilizer, are appropriate. Experiments have shown that this method can be used in the testing of propellants, tested on mine caliber of 120 mm. The results of the experiment are proved by high performance liquid chromatography method. The results obtained by experiment, in combination with other analytical methods such as the vacuum stability test (VST), can be successfully used to predict the stability of propellants, which was further confirmed by the qualitative thin layer chromatography (TLC) method. Eight samples of mine 120 mm were tested and the maximum deviation of HPTLC results from HPLC was 0.04%. The results obtained are fully usable for predicting the life of the tested propellants.
Keywords:Centralite 1; centralite 2; high performance thin layer chromatography; mine 120 mm; propellant; propellant stability
Introduction
Modern propellant, so-called smokeless type, is consisting primarily of nitrated cellulose, but frequently with nitroglycerine as well. Propellant consisting of nitrocellulose (NC) alone is termed single-base propellant, and those powders that contain nitroglycerine besides nitrocellulose are called double-base propellants [1]. Active compounds mainly decompose to nitrogen oxides (NO and NO2) that catalyze and accelerate the decomposition process and may lead to self-heating and auto-ignition. Stabilizers are added to propellants to stop such decomposition, being essential their addition in the propellant’s composition [2]. Powders and propellants must contain one or several additives called stabilizers, the function of which is to prevent chemical change in the energetic constituents over a reasonable period of time [3]. Nitrocellulose based propellants show a slow, but constant decomposition of nitrate ester groups under the formation of nitrogen oxides and nitric acids. These components catalyze the further decomposition of the propellant and may finally lead to an autocatalytic decomposition [4]. The article [5,6] explains the formation of nitric acid and nitric oxide in propellants in details, and the final result of the reactions is an increase in ambient temperature, which could theoretically be one of the causes of propellant inflammation. Currently, most planar chromatography is based on the thinlayer technique, which is faster, has better resolution, and is more sensitive than its paper chromatography equivalent [7]. Today, such techniques have largely been replaced by LC methods, which are readily automated and faster. Thin-layer chromatography has found widespread use in clinical laboratories is the backbone of many biochemical and biological studies. It also finds extensive use in industrial laboratories [8]. Typical thin-layer separations are performed on a glass plate coated with a thin and adherent layer of finely particles; this layer constitutes the stationary phase. Mobile phases are also similar to those found in HPLC [7]. For a better understanding of a thin layer chromatographic separation for analysis of propellants, we described it and compare its results with Vacuum Stability Test (VST) and High Performance Liquid Chromatography (HPLC), which are standard methods by NATO Allied Ordnance Publication (AOP) 48 and NATO Standardization Agreement (STANAG) 4556 and with qualitative TLC method based on Qpak-13 Austrian kit. Additionally, in this experiment, we make life prediction of propellant samples base on obtained results. The aim of this paper is to develop a new method of propellant analysis using HPTLC, which is inexpensive and acceptable in laboratory work. We used a total of 4 different methods of work. On HPTLC, we developed a new method of analysis and to prove the accuracy and validity of the obtained results, we used comparisons with the results of the HPLC method, and VST and TLC methods.
Experiment
The problematic nature in NC propellants is the aging reaction that liberates NOx into the medium. The primary part of the mechanism of this reaction is the hemolytic scission of the nitrate esters, which is illustrated in Figure 1. The primary processes of propellant decomposition cannot be prevented. The stabilizers have the ability to respond with nitrogen oxides by the formation of nitrate and nitrated compounds. The concentration of stabilizers in the propellant gives us important information about the actual grade of propellant decomposition. Centralite 1 and 2 are commonly used stabilizers for single, double and triple base propellants. In this work, we used eight samples of propellants from Mine Caliber 120 mm, the manufacturer year 1995. All samples were tested on HPLC, HPTLC, VST and TLC methods. HPLC and HPTLC are used in comparison purpose of quantitative determination of stabilizers C1 and C2 contents. By interpreting the results of all the above methods, the life expectancy of the propellant has been forecast.
Materials
For developing HPTLC method in purpose of analytical tests on propellants we used next equipment and chemicals:
a. CAMAG LINOMAT 5 (automatic sample applicator)
b. CAMAG TLC SCANNER (quantitative detector)
c. LINOMAT SYRINGE 695.0014 - 100μL
d. Sterilized syringe – 2 ml
e. Syringe filters, RC 0,2 μm
f. Short Thread Vial – 1,5 ml
g. Pure N2(g)
h. 1,3-Diethyl-1,3-Diphenylurea 99%, SIGMA-ALDRICH
i. 3-Methyl-1,1-diphenylurea ≥ 99%, SIGMA-ALDRICH
j. Sartorius electronical scale, class 1
k. Acetone 99,8 %, Fisher Scientific, U.K.
l. Toluene 99,9 %, Fisher Scientific, U.K.
m. Acetonitrile 99,8 %, CARLO ERBA, France
n. Distilled water
o. HPTLC Silica gel 60 F254(20x10 cm)
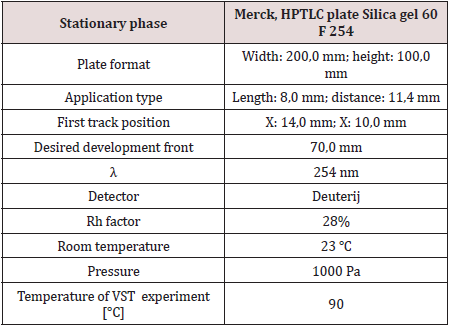
In the experiment, we used a total of 4 different methods of work. On HPTLC, we developed a new method of analysis, using the conditions shown in the Table 1. To prove the accuracy and validity of the obtained results, we used comparisons with the results of the HPLC method, and VST and TLC methods.
Results and Discussion
Procedure
In the purpose of experiment, we prepare samples of propellants, then we developed HPTLC plates, one of them in the purpose of stabilizer detection, qualitative detection, and the other in the purpose of quantitative detection of C 1 and C 2. For the qualitative analysis we tested a lot of different ratio of solvents for developing a chromatograph, and in results we will show one of the best. For quantitative analysis of C 2 and C 2, we tested also a lot of different solvents with a different ratio, and we will present one of them with a very high R2 factor. On the HPTLC plate, we use eight spots for the application of a standard solution of stabilizers C 1 and C 2. The other eight spots we use for the application of propellant samples. It is important to mention that we used two spots each time for one reference or sample, and for calculation, CAMAG software used average value. So, on one plate we can examine four propellants sample.
Sample preparation
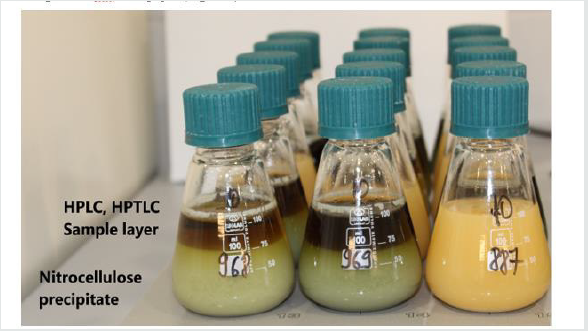
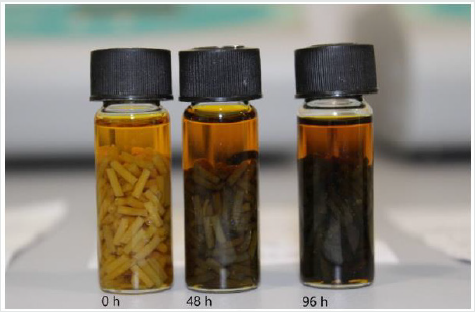
According to the sample, it is necessary to select suitable solvents of high purity. After full dissolving of sample (Figure 1) in organic solvent, 2.000 ± 0.005 of propellant in 80 ml of acetonitrile, it is necessary to add 20 ml of pure water. NC is insoluble in water, which allows its preparation. After precipitation of the NC, the sample is taken from the top layer of solvent using a 0.25 μm filter paper (Figure 2). For Thin Layer Chromatography TLC, we prepared samples by chopping them to a size of 2x2 mm, as shown in Figure 3.
Figure 3: TLC propellant sample without artificial aging (0 h = current state of propellant), and after aging on 80ºC in periods of 48 h (2.3 year) and 96 h (4.6 years).
Sample application and developing a chromatogram
Sample application is the most critical aspect of HPTLC, particularly for quantitative measurements. The most frequent technique still is application with a glass capillary as spot or short streak. We applied sample as a 5 mm short streak, 1 cm from the edge of the plate. Linomat 5 sample applicator by CAMAG in purpose of qualitative/quantitative evaluation is used in this experiment. For both types of application some manual skill is required to obtain reproducible results. Substance zones which are too large from the beginning will cause poor separations since during chromatography they will become even larger and more diffuse [6]. After application allow the solvent of the samples to evaporate completely. It takes about 10 minutes or blow the plate with cold or hot air. The development of a chromatogram should start after the solvent of the applied samples is evaporated completely. If reproducible migration distances are required, a saturation of the chamber atmosphere with eluent or solvent vapor is necessary. In our experiment, we used a mixture of 9 vol. toluene and 1 vol. acetone for C1 of 2, and a mixture of 4 vol. toluene and 6 vol. cyclohexane for DPA stabilizer.
Qualitative detection
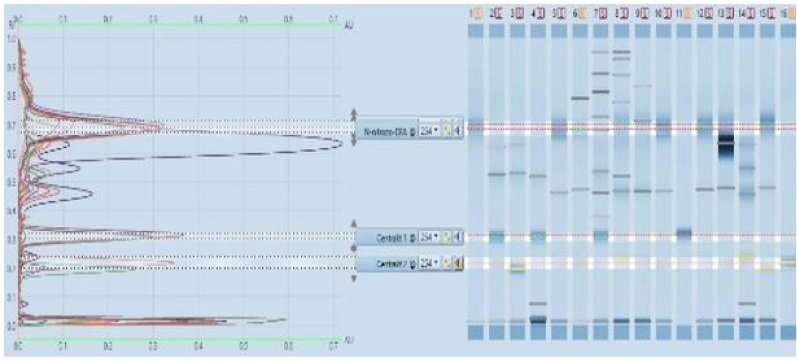
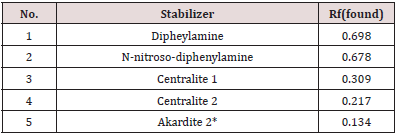
Qualitative detection of the stabilizer in the propellant can be done by comparing the positions of the corresponding peaks in the developed HPTLC or TLC plate. The plate is shown in Figure 4. The data from a single chromatogram usually do not provide sufficient information to permit the identification of the various species present in a mixture because of the variability of Rf values with sample size, the thin layer plate and the development conditions. In addition, there is always the possibility that two quite different solutes may exhibit identical or nearly identical Rf values under a given set of conditions. After the application of prepared propellant samples, we developed a chromatograph in a solvent mixture of toluene and acetone. The next step is to determine the right position, Rf of stabilizers standard and C 2, and on comparison principle found which kind of stabilizer is in the propellant sample. For that purpose, we found Rf values for standard solutions showed in Table 2. It is very important to determine the exact values of Rf. Each molecule that develops on the chromatogram has the exact intrinsic value of this factor. The Rf factor is influenced by the type of solvent, ie its polarity, but also by the polarity and the size of the molecules that develop on the chromatogram. Molecules are identified using Rf values. Akardite II or AII (1-methyl-3,3- diphenylurea) In a situation that we can’t clearly decide which stabilizer is present in the propellant, then we can use more clear way, but in the other hand, more slowly way of stabilizer determination. It is one kind of results in the form of graphics, which we can use in the CAMAG software, showed in Figure 4. The results obtained by described procedure are shown in Table 3 and Table 4. It is important to mention that results, obtained from the HPTLC plate in the screening process, are confirmed with the TLC method. In Table 4, column HPTLC - Stabilizer is equal with column TLC - Stabilizer. There is important to emphasize that the TLC test is based on chemical reaction and results is a red color like proof of Centralites (or blue for diphenylamine), but with this test, we can’t know is it C1 or C2, red color like the result is same for both.
Table 2: Rf values for some stabilizers after developed HPTLC/ TLC plate in solvent mixture of toluene and acetone.
Quantitative detection
For this experiment we make standard solutions in acetonitrile of C2 and C2 stabilizers in range 0,5 – 2 %. Reason for this kind of range is because of facts that content of Centralites in propellants are usually high, more than 2 % and up to 10 %. The Table 4 consist results from eight double based propellants samples which we selected like representative in our experiment. First four consist C1, and the other four consist C2. All samples are from same mine caliber 120 mm, and propellants samples are from 1995. For quantitative detection with HPTLC plates automatic scanners are used. There are several advanced generations of scanners. In new generation of scanners signal to noise ratio was improved, spectral range extended: 190 - 900 nm. We can mention that there is a big similarity between HPTLC (C 1 → R2 = 0.9982; C 2 → R2 = 0.9980) and results on the other two methods. With increase contents of stabilizer, generally we can mention decrease in released gas on VST method. For better view see Table 3. Samples 3, 1 and 2 slightly deviate from this conclusion, and for this type of stabilizers it is not something unusually. Reason for this is nature of Centralites, we can say that these stabilizers are lazy in reaction with nitro gases after a certain age of propellant. However, obtained results are competent, and we can conclude it in comparison results of sample 4 and the all other. Sample 4 have 0.5% of C 1 and 1,033 ml/g released gas and other samples have double or more concentration of stabilizer and approximately half less value of released gases. According to Bosnian National Standards from field of stability of propellants which are in coordination with NATO standards in this field, we combine HPTLC and VST results to create category of propellants stability. Additionally, we compared this category with TLC category in Table 4. We can mention that difference is in sample 4. According to HPTLC result for sample 4: 0.50 % of C 1 is to low concentration for category 1, and VST result of 1,033 ml/g is just 0,033 ml/g above 1. category range. So, we can mention that this sample is in 2. category or in some kind of transition category. It is very important to mention that we did not know the initial concentration of the stabilizer in our samples. The TLC method shows category 1 in this case, but the TLC method is a qualitative method based on the human eyes, so deviation on just one sample is more than a good result. When creating the stability category, using only the TLC method, we used a descriptive rating. This involves observing the developed plate and noticing the presence or absence of a stain at the characteristic Rf of the C1 and/or C2 degradation products. The absence of a stabilizer degradation product is not always an indication that the propellant is stable. This fact occurs with lazy stabilizers, because the decomposition products are not formed near the stabilizer, so NOx gases endanger the stability of the propellant on the way from the source to the stabilizer. For the purpose of the experiment, we artificially aged the fuel at 2.3 and 4.6 years, which is equivalent to heating the sample at 80 degrees for 48 and 96 h. Descriptive grade A has meaning: C 1 or 2 is clearly recognizable, and N-nitroso-ethylaniline and 4-nitro centralite are barely recognizable; B – C 1 or 2 is clearly recognizable, nitrosoethylaniline and 4-nitro-centralite are clearly recognizable. Samples 1, 2 and 3 have the highest content of stabilizer, but according to the TLC method they are not more stable compared to other propellants. They already belong to description B after 2.3 years, which means that fuel degradation has already begun. This example demonstrates the importance of combining the HPLC and HPTLC methods in combination with a thermal method, such as VST or TLC, to create a final assessment of the stability of the propellant. We tested samples on nitroglycerine content (NG column) and confirm it also with another chemical test (TLC column). So, we prove that they are double-base propellants. Final, Table 4 show a comparison of results on two quantitative methods, HPTLC and HPLC. Analyzes on both methods are made on the same day in two different laboratories, and the similarity of results is very good. Samples 2 and 6 showed the same results of stabilizers quantity on both methods. All other samples showed the difference in the second decimal: samples 4 and 8 showed a difference in 0.01 %, sample 5 in 0.02%, samples 1 and 7 in 0.03 %, and sample 3 in 0.04 %. This difference is not so big, and it should be noted that such deviations are often greater with repeated analyzes using the same method, and in our case, they are completely different analytical devices with different analytical performances. However, using the results of HPTLC analysis we obtain identical stability categories as with the results of HPLC analysis. CEN – using TLC method we get information that Centralite molecule is in solution, but without information is it 1 or 2, because of it we use shortcut CEN instead of C 1 or C 2
a) Centralite 1 or 2 is clearly recognizable, and N-nitrosoethylaniline
and 4-nitro centralite are barely recognizable.
b) Centralite 1 or 2 is clearly recognizable, nitrosoethylaniline
and 4-nitro-centralite are clearly recognizable.
A. Category 1: Propellant and rocket fuel good for safe
storing at 25 °C in period of 4 years.
B. Category 2: Propellant and rocket fuel good for storing
at 25 °C in a period of 2 years, priority in the use of ammunition
labored with this propellant.
Conclusions
Centralite 1 and Centralite 2 can be determined qualitatively by HPTLC without error or with an acceptable error using a mixture of 9 vol. toluene and 1 vol. acetone as carrier solvent on 254 nm. It is possible to use combinations of other solvents, but with the invention of the appropriate Rf factor for individual stabilizers, while overlapping positions of different molecules must be avoided. Centralite 1 and Centralite 2 can be determined quantitatively by HPTLC with or without the presence of diphenylamine and/ or N-NO-diphenylamine in the same propellant sample, using a mixture of 9 vol. toluene and 1 vol. acetone as the carrier solvent on 254 nm. Results obtained from the HPTLC method are useful for the purpose of qualitative and quantitative analysis of propellant samples, but for their useful application, they require a combination with some thermal method of propellant analysis. Quantitative analyzes of propellants from the HPTLC method can be used to determine and predict the stability status of propellants in combination with Vacuum Stability Test.
Table 4: Results of qualitative and quantitative analysis of propellants samples with C 1 and C 2 on three different analytical methods

CEN – using TLC method we get information that Centralite molecule is in solution, but without information is it 1 or 2, because of it we use shortcut CEN instead of C 1 or C 2
A – Centralite 1 or 2 is clearly recognizable, and N-nitroso-ethylaniline and 4-nitro centralite are barely recognizable.
B – Centralite 1 or 2 is clearly recognizable, nitroso-ethylaniline and 4-nitro-centralite are clearly recognizable.
Category 1: Propellant and rocket fuel good for safe storing at 25 °C in period of 4 years.
Category 2: Propellant and rocket fuel good for storing at 25 °C in a period of 2 years, priority in the use of ammunition labored with this propellant.
References
- Espinoza E (1994) Characterization of smokeless gunpowder by means of diphenylamine stabilizer and its nitrated derivatives. Analytica Chimica Acta 288(1-2): 57-69.
- Lopez M, Bravo JC, Garcia Ruiz C, Torre M (2013) Diphenyamine and derivatives as predictors of gunpowder age by means of HPLC and statistical models. Talanta 103: 214-220.
- Folly P, Mader P (2004) Explosives Propellant Chemistry. Schweizerische Chemische Gesellschaft 58(6).
- Chovancova M, Očko P, Pechova A, Lopuch J (2006) Lifetime prediction of propellants according to NATO standards. Problems of Armament Technology R 35(98): 7-14.
- Cho KH (2010) A study on the self-life estimation of the propellant KM10. Journal of the Korean 5(11): 1735–1740.
- Halilović N, Hadžić R, Malešević I, Jurčević M, Starčević D (2019) Application of thin layer chromatography for qualitative analysis of gunpowder in purpose of life prediction of ammunition. International Journal of Biosensors & Bioelectronics 5(1): 4-12.
- Skoog DA, Holler FJ, Crouch SR (2007) Principles of Instrumental Analysis. Belmont USA Thomson Higher Education (4).
- Sherma J, Fried B (2003) Handbook of Thin-Layer Chromatography. New York Dekker USA (3).

Top Editors
-

Mark E Smith
Bio chemistry
University of Texas Medical Branch, USA -

Lawrence A Presley
Department of Criminal Justice
Liberty University, USA -

Thomas W Miller
Department of Psychiatry
University of Kentucky, USA -

Gjumrakch Aliev
Department of Medicine
Gally International Biomedical Research & Consulting LLC, USA -

Christopher Bryant
Department of Urbanisation and Agricultural
Montreal university, USA -

Robert William Frare
Oral & Maxillofacial Pathology
New York University, USA -

Rudolph Modesto Navari
Gastroenterology and Hepatology
University of Alabama, UK -

Andrew Hague
Department of Medicine
Universities of Bradford, UK -

George Gregory Buttigieg
Maltese College of Obstetrics and Gynaecology, Europe -

Chen-Hsiung Yeh
Oncology
Circulogene Theranostics, England -
.png)
Emilio Bucio-Carrillo
Radiation Chemistry
National University of Mexico, USA -
.jpg)
Casey J Grenier
Analytical Chemistry
Wentworth Institute of Technology, USA -
Hany Atalah
Minimally Invasive Surgery
Mercer University school of Medicine, USA -

Abu-Hussein Muhamad
Pediatric Dentistry
University of Athens , Greece

The annual scholar awards from Lupine Publishers honor a selected number Read More...


