Lupine Publishers Group
Lupine Publishers
Menu
ISSN: 2641-1725
Review Article(ISSN: 2641-1725) 
Non-statistically Significant Interactions between Treatments and an Approach for Dealing with these Statuses Volume 5 - Issue 4
Zakaria M Sawan*
- Cotton Research Institute, Agricultural Research Center, Ministry of Agriculture and Land Reclamation, Egypt
Received: October 30, 2020; Published: November 10, 2020
*Corresponding author: Zakaria M Sawan, Cotton Research Institute, Agricultural Research Center, Ministry of Agriculture and Land Reclamation, 9 Gamaa Street, 12619, Giza, Egypt
DOI: 10.32474/LOJMS.2020.05.000219
Abstract
A field experiment on cotton yield resulted in a non-statistically significant interaction. An approach for follow-up examination between treatments based on least significant difference values was suggested to identify the effect regardless of insignificance. It was found that the classical formula used in calculating the significance of interactions suffers a possible shortage that can be eliminated by applying a suggested revision.
Keywords: Cotton yield; Mepiquat Chloride; nitrogen; non-significant interactions; potassium
Introduction
Managing the balance of vegetative and reproductive growth is the essence of managing a cotton crop. It is known from numerous fertilizer experiments that the yield of field crop is strongly dependent on the supply of mineral nutrients [1-3]. Several approaches have been used in an attempt to break this yield plateau, among them the application of plant growth regulators (PGR’s), particularly Mepiquat Chloride (MC) has received much attention recent years [4,5].1.2. Also, a statistical approach for dealing with the non-significant interactions between treatments depending on least significant differences, regardless of statistical insignificance is suggested [6].
Methodology
In (30oN, 31o: 28’E and 19 m altitude) Egypt using the cotton
cultivar Giza 86 (Gossypium barbadense L.) in I and II seasons.
The soil texture in both seasons was a clay loam with an alluvial
substratum, (pH = 8.10, 44.75% clay, 27.40% silt, 20.00% fine sand,
3.00% coarse sand, 2.85% calcium carbonate and 1.85% organic
matter). Each experiment included 16 treatment combinations of:
Two N rates (95 and 143 kg N per hectare), which were applied
as ammonium nitrate (NH4NO3, 33.5% N) at two equal doses, 6
and 8 weeks after planting. Each application (in the form of pinches
beside each hill) was followed immediately by irrigation. The K
and MC were applied to the leaves with uniform coverage using a
knapsack sprayer. The application was carried out between 9.0 and
11.0 h [6].
A randomized complete block design with four replications
was used for both experiments. Seeds were planted on 3 April in
season I and 20 April in season II. Hills were spaced 25 cm apart
on one side of the ridge, with seedlings thinned to two plants hill-
1 six weeks after planting. The total amount of surface irrigation
applied during the growing season was about 6,000-m3 per
hectare. Plots were irrigated every two weeks until the end of the
season (October 11, in season I and October 17 in season II), for a
total of nine irrigations. Phosphorus (P) fertilizer was applied at
the rate of 24 kg P per hectare as calcium super phosphate during
land preparation. The K fertilizer was applied at the rate of 47 kg
K per hectare as potassium sulfate before the first irrigation (the recommended level for semi-fertile soil). Fertilization (P and K),
along with pest and weed management was carried out during the
growing season according to the local practice performed at the
experimental station [6].
In both seasons, ten plants were randomly taken from the
center ridge of each plot to determine the seed cotton yield in g per
plant. Total seed cotton yield of each plot (including ten plant sub
samples) was used to determine seed cotton and lint yield (kg per
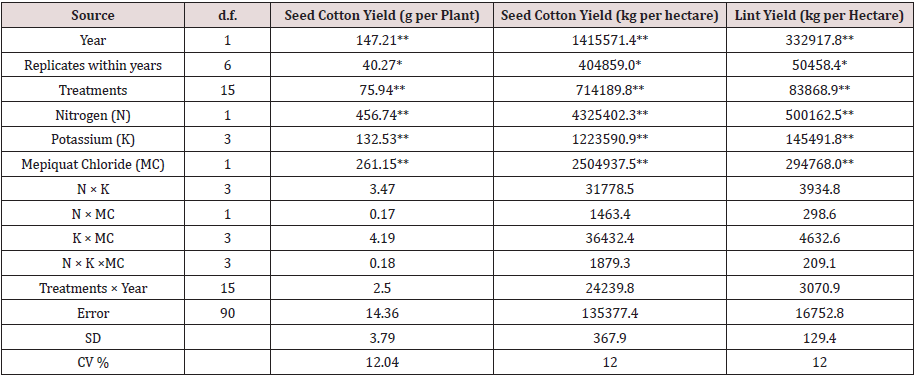
hectare) [6] (Table 1).
Table 1:Mean squares for combined analysis of variance for yield in cotton during seasons I and season II. * Significant at P = 0.05** Significant at P = 0.01 [6].

The least significant difference (LSD) test method at 5% level of significance was used to verify the significance of differences among treatment means and the interactions to determine the optimum combination of N, K and MC [6].
Results
Effects of main treatments on yield
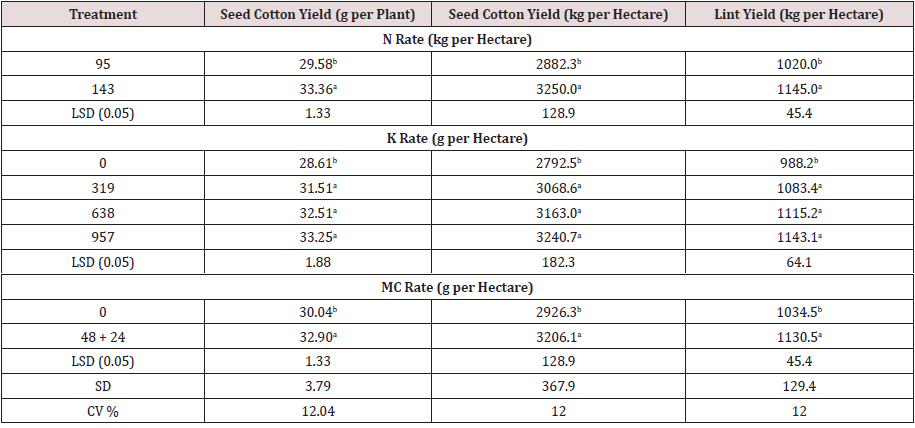
Seed cotton yield per plant, as well as seed cotton and lint yield per hectare, were increased by as much as 12.8, 12.8, and 12.3 %, respectively, when the nitrogen rate was increased (see Table 2) [6]). N is an important nutrient for control of new growth and preventing abscission of squares and bolls and is also essential for photosynthetic activity [7,8]. When K was applied at all three rates (319, 638 and 957 g K per hectare), seed cotton yield per plant and seed cotton and lint yield per hectare also increased [6]. These increases could be attributed to the favorable effects of K on yield components, that is, the number of opened bolls per plant and boll weight leading consequently to higher cotton yield [9,10]. Mepiquat Chloride (MC) significantly increased seed cotton yield per plant, as well as seed cotton and lint yield per hectare (by 9.5, 9.6 and 9.3%, respectively), compared to the untreated control [6] that lead to yield enhancements of both boll retention and boll weight [10].
Table 2: Effect of N-rate and foliar application of K and MC on yield in cotton combined over seasons I and II**Values followed by the same letter in a column are not significantly different at P = 0.05 [6].

Effects of interactions between treatments on yield
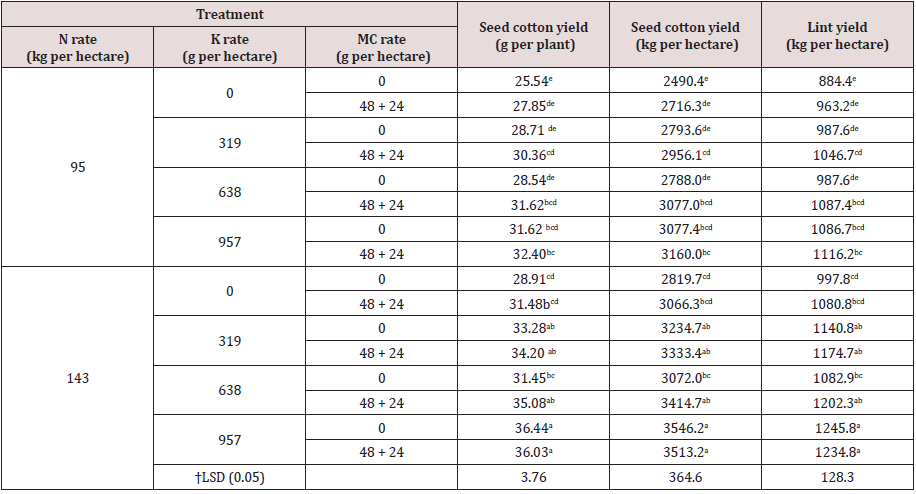
No significant interactions were identified among the variables
in this study (N rates, K rates and MC) with respect to the characters
under investigation. Generally, interactions indicated that the
favorable effects accompanied the application of N; spraying cotton
plants with K combined with MC on cotton productivity was more
obvious by applying N at 143 kg per hectare and combined with
spraying cotton plants with K at 957 g per hectare and also with MC
at 48 + 24 g active ingredient per hectare.
Regarding the non-significant interaction effects, increases
were observed in seed cotton yield per hectare (about 40%) as
a result of applying the same combination [6]. Differences were
observed between the interactions in this study, that is, the first
order (see Tables 3-5) and the second order (see Table 6); however,
these interactions were not statistically significance. Because it
is possible that experimental error could mask the pronounced
effects of the interactions [6]a statistical approach for dealing with
the non-significant interactions between treatments is suggested.
Table 3: Effect of interaction between N rate and foliar application of K on cotton yield combined over seasons I and II**Values followed by the same letter in columns under every character head are not significantly different at P = 0.05; † LSD, Least Significant Difference; [6].

Table 4: Effect of interaction between N rate and foliar application of MC on cotton yield combined over seasons I and II**Values followed by the same letter in columns under every character head are not significantly different at P = 0.05; † LSD, Least Significant Difference [6].

Table 5: Effect of interaction between K rate and foliar application of MC on cotton yield combined over seasons I and II**Values followed by the same letter in columns under every character head are not significantly different at P = 0.05; † LSD, Least Significant Difference [6].

Table 6: Effect of interactions between N rate, foliar application of K and MC on cotton yield combined over seasons I and II**Means followed by the same letter in a column are not significantly different at P = 0.05; † LSD, Least Significant Difference[6].

Differences between treatment combinations regardless of the
non-significance of the interaction effects from the ANOVA.
Results show that, if no significant differences are identified
between the different levels of any main factor (N, K or MC)
when the LSD is calculated, then the significance does not exist.
Conversely, if the significance of the interactions between the main
factors (first and second order interactions) is not identified, then
the estimation of the LSD of the interactions between the main
factors could provide a significant result [6]. For these reasons, the
formula used in calculating the significance of interactions suffers
a possible shortage.
Study results indicate that it could be useful to modify or add to the original formula used for calculating F values of interactions [6]via:
F = Mean Square for Interaction / Mean Square for Error
In this connection, calculating the significance of interactions
could proceed as:
F = Mean square for interaction × n / Root of mean square for
error
Where n = number of main factors in the interaction.
Based on findings from this study, it may be concluded that the use of the suggested formula could secure the disclosure of any significant effects among interactions regardless of experimental error [6].
References
- Ansari MS, Mahey RK (2003) Growth and yield of cotton species as affected by sowing dates and nitrogen levels. Journal of Research Punjab Agricultural University 40(1): 8-11.
- Gormus O (2002) Effects of rate and time of potassium application on cotton yield and quality in Turkey. Journal of Agronomy and Crop Science 188(6): 382-388.
- Pervez H, Ashraf M, Makhdum MI (2004) Influence of potassium rates and sources on seed cotton yield and yield components of some elite cotton cultivars. Journal of Plant Nutrition 27: 1295-1317.
- Kumar KA K, Patil BC, Chetti MB (2004) Effect of plant growth regulators on biophysical, biochemical parameters and yield of hybrid cotton. Karnataka Journal of Agricultural Science 16: 591-594.
- Nuti RC, Witten TK, Jost PH, Cothren JT (2000) Comparisons of Pix Plus and additional foliar Bacillus cereus in cotton. In Proceedings Beltwide Cotton Production Research Conference San Antonio 4-8, 684-687. Memphis TN, National Cotton Council, TX USA.
- Sawan ZM (2013) An approach for dealing with statuses of non-statistically significant interactions between treatments. Journal of Modern Applied Statistical Methods 12: 220-226.
- McConnell JS, Mozaffari M (2004) Yield petiole nitrate and node development responses of cotton to early season nitrogen fertilization. Journal of Plant Nutrition 27(7): 1183-1197.
- Wiatrak PJ, Wright DL, Marois JJ (2006) Development and yields of cotton under two tillage systems and nitrogen application following white lupine grain crop. Journal Cotton Science 10: 1-8.
- Pettigrew WT, Meredith WRJr, Young LD (2005) Potassium fertilization effects on cotton lint yield yield components, and reniform nematode populations. Agronomy Journal 97(4): 1245-1251.
- Sharma SK, SundarS (2007) Yield, yield attributes and quality of cotton as influenced by foliar application of potassium. Journal of Cotton Research and Development 21(1): 51-54.
- Snedecor GW & Cochran WG (1980) Statistical Methods. 7th Ed Ames Iowa Iowa State University Press, USA.

Top Editors
-

Mark E Smith
Bio chemistry
University of Texas Medical Branch, USA -

Lawrence A Presley
Department of Criminal Justice
Liberty University, USA -

Thomas W Miller
Department of Psychiatry
University of Kentucky, USA -

Gjumrakch Aliev
Department of Medicine
Gally International Biomedical Research & Consulting LLC, USA -

Christopher Bryant
Department of Urbanisation and Agricultural
Montreal university, USA -

Robert William Frare
Oral & Maxillofacial Pathology
New York University, USA -

Rudolph Modesto Navari
Gastroenterology and Hepatology
University of Alabama, UK -

Andrew Hague
Department of Medicine
Universities of Bradford, UK -

George Gregory Buttigieg
Maltese College of Obstetrics and Gynaecology, Europe -

Chen-Hsiung Yeh
Oncology
Circulogene Theranostics, England -
.png)
Emilio Bucio-Carrillo
Radiation Chemistry
National University of Mexico, USA -
.jpg)
Casey J Grenier
Analytical Chemistry
Wentworth Institute of Technology, USA -
Hany Atalah
Minimally Invasive Surgery
Mercer University school of Medicine, USA -

Abu-Hussein Muhamad
Pediatric Dentistry
University of Athens , Greece

The annual scholar awards from Lupine Publishers honor a selected number Read More...


