Lupine Publishers Group
Lupine Publishers
Menu
ISSN: 2641-6921
Research Article(ISSN: 2641-6921) 
Upgrading of Koton Karfe Iron Ore through Roasting and Leaching Volume 2 - Issue 2
Adeosun AS1, Abere DV2*, Akinwole IE1, Ojo SA3, Otebe S4, Uzuh FD2, Abubakar UBS2 and Goyol CG2
- 11Department of Materials Science and Engineering, Obafemi Awolowo University Ile-Ife, Nigeria
- 2National Metallurgical Department Centre (NMDC), Nigeria
- 3Department of Mechanical Engineering, University of Akron, USA
- 4Ministry of Water Resources Abuja, Nigeria
Received: November 13, 2019; Published: November 22, 2019
*Corresponding author: Abere DV, National Metallurgical Department Centre (NMDC), Jos, Nigeria
DOI: 10.32474/MAMS.2019.02.000134
Abstract
This study investigated the de-phosphorization, de-sulphurization and de-mineralization of roasted pre-treated Koton-karfe iron ore by atmospheric organic acid leaching with the aim of upgrading the iron ore to concentrate and super-concentrate for use in indirect and direct iron making processes, respectively. The work involved chemical and mineralogical characterization, roasting pre-treatment and particle size analysis of the iron ore as-received, as-roasted and as-leached. The ore as-received and as-roasted at 750˚C was subjected to factorial design based atmospheric organic acid leaching at fine and coarse particle sizes of 75 and 475μm; low and high contact times of 30 and 90 minutes were observed. Operation carried out at concentrations of 0.2 and 1.0 M at temperatures of 30 and 90˚C. The leaching was carried out in single and multistage. XRF analyses were carried out on all the samples. The leaching sequence of H2O-HCOOH-H2O was found to produce the highest grade of the iron ore concentrate in the multistage leaching. The results of the XRF analysis showed that as-received Koton-karfe iron ore contains; 43.45, 0.0246, 0.098 weight % of iron, phosphorus, Sulphur respectively. The as-roasted Koton-karfe iron ore contains; 46.91, 0.012, 0.05 weight % of iron, phosphorus, Sulphur, respectively and roasted-leached with formic acid in multistage contains; 67.89, 0.00123, 0.001 weight % of iron, phosphorus, and Sulphur. The results obtained indicates that the % purity of the iron content in the roasted-leached Kotonkarfe iron ore was increased by 56.25 weight %, while the deleterious phosphorous, Sulphur and silica contents were drastically reduced by 95.00, 98.98 and 80.85 weight %, respectively. The iron content of the roasted-leached sample of 67.89 weight % satisfy the specifications of 63 and 67% Fe minimum content for iron ores for both in-direct and direct iron making processes, respectively. The research has thus shown that hydrometallurgical leaching process is an efficient beneficiation route for the separation of iron oxide from other gangue oxides in the Koton-karfe iron ore. It can also be deduced that the roasting process significantly enhanced the leaching removal of sulphur, phosphorus and other gangue materials in the ore. Thus, the pre-roasting leaching process has significantly reduced the undesirable phosphorus, sulphur and silica content in the ore and increased the iron metal value in the ore rendering it suitable for both the blast furnace process in Ajaokuta and the Midrex reduction operation at Aladja.
Keywords: Leaching; sulphur; phosphorus; acid, iron, roasted
Introduction
Nigeria is endowed with abundant iron ore deposit of which
some of them have been investigated and some are still under
investigation. Iron ore is the major raw material in Iron and steel
industry. It occurs as pure iron oxide, which may be magnetite
(Fe3O4), hematite (Fe2O3), or as hydro oxide (HFeO2) goethite and
Limonite (2Fe2O3. xH2O)], and carbonates (FeCO3) siderite. In
general, the forms in which iron is found in nature depend on the
pH and the oxygen concentration. At neutral pH and in the presence
of oxygen, ferrous iron (Fe2+) is oxidized to ferric iron (Fe3+). Under
these conditions, ferric iron forms highly insoluble precipitate,
Fe(OH)3, [1]. The two broad types of iron ore occur prominently in
Nigeria are:
a. Banded iron formation (BIF) which occurs in folded bands
and lenses associated with the Precambrian meta-sedimentary
schist belts prominently outcropping in the western half of the
country. Prominent locations include Tajimi, Itakpe, Ajabanoko,
Ochokochoko Toto, Farin Ruwa, Birnin Gwari, Maru, Jamare, Kaura
Namoda, Kakun, Isanlu, Roni and Ogbomoso areas [2].
b. The Cretaceous sedimentary (oolitic) iron deposits occur
prominently around Agbaja, Kotonkarfi, Nsudde areas in the North
central and south eastern zones of the country respectively [2].
In simplified terms, the Precambrian rocks of Nigeria may be
grouped into three principal subdivisions. These are the ancient
gneiss magmatite complex, the schist belts and the plutonic
series plus affiliated minor rocks which bear imprints of Liberian
(~2700Ma), Eburnean (~2000Ma), and Pan African (~650Ma)
tectonic events, the latter being the most widespread. Older ages
>3.0Ga have more recently been indicated from some. Such relict
signatures tend to reinforce the assertion that this Precambrian
terrain may have been part of an Archaean proto shield which
was later affected by Proterozoic crustal activities and subsequent
evolvement of the Phanerozoic basins. Overlying these older
assemblages are sedimentary sequences of Cretacecous to Tertiary
ages deposited in five basins notably Mid-Niger basin, Benue
Trough, Anambra Basin all of Cretaceous ages and the Sokoto
(Illumeden Basin), Chad and the Niger Delta basin of Tertiary and
Tertiary to Recent ages respectively [2].
The banded iron formation of Nigeria generally occurs in the
following metamorphosed folds:
I. The cretaceous sedimentary iron formation: Although
they are described as sedimentary, they are in fact partly lateritic in
character. So far only two of such deposits have been investigated
in details and they include the oolitic iron stones of the Agbaja
Plateau and the rubbly iron stone of Enugu. Similar iron stones
have been found as caps of varying dimensions on some Cretaceous
successions of the Illumeden and Niger embayments notably
around Kotonkarfe and Bida basin [2].
II. The Lokoja- Okene iron ore deposit (Central Nigeria):
The most notable iron ore occurrence in this region include
Itakpe, Ajabanoko, Oshokoshko, Tajimi, Agbado-Okudu, Ebiya,Ero,
Echakaraku, Ozenyi, Udiarehu and some others. They occur as bands
and lenses of banded (and sometimes massive) iron formation
dipping between 210 and 850 and mostly conformable to the host
rocks (gneisses and amphibolities). The tabular ore bodies, up to
45m thick, and extending for distances from hundreds of meters
to over 5 km, are developed to a depth of over 300m, and are often
displaced by small to large faults, The ore are mostly magnetite and/
or hematite with quartz, biotite and amphiboles in the groundmass,
iron content ranges between 15% and 65%, averaging 30-36% [2].
a. Rich ores with more than 50% Fe and constitutes about 4.5%
of the total reserves.
b. Medium grade ores, with 30-50% Fe, and constitutes about
85.4% of the reserve
c. BIF Occurrences in north-western Nigeria.
The numerous occurrence of banded iron formation associated
with the metasediments of the schist belt areas occurs poradically
in minor bands and lenses These locations extend from Tsofon Birni Gwari -Farinruwa to south of Birnigoga,and west of Kaura-Namoda,
Baraba hills , 5km west of Maru, Koriga river, kalangai and Jamare
areas. Magnetite and hematite are the major ore constituents in
variables percentages. Average ore grade is usually between 38.9
- 57.4% Fe 2O3 [3].
BIF occurrences in south western Nigeria
Three occurrences of iron bodies at Oko, Gbede, and Ajashe
Oyo state of Nigeria have been mapped around Ogbomosho area
as narrow lens sand bands. They are mostly hematite, magnetite
iron formation with a Fe grade of 34.4% at Oko, 42.7% at Gbege
and 39.0% at Ajashe. They are extensive laterally enough to attract
detailed economic evaluation, although the thickness of occurrence
have not been ascertained [2]. Agbaja iron ore deposit has the
largest reserve in Nigeria. In term of total iron content it also has
some of the highest value. It is closely followed by Koton-karfe
and Bassa-Nge deposits which lie in the same region and bear
same chemical, mineralogical and petrographic characteristics [4].
The Agbaja, Kotonkarfe, Bassa-Nge ore body is centered in Lokoja
confluence (60 45E; 70 47N), and covers an expense of land –
approximately 400 km2 in the geographical area of Nigeria in Kogi
State to be precise. The confluence divides the deposit into three
major areas:
1. The Agbaja-mount Patti-Lokojaarea(approximate 150 km2)
located west of the river Niger
2. The Kotonkarifi area (approximately 170 km2) located north
of confluence
3. The BassaNge area (approximately 80 km2) located south east
of the confluence
When the average Fe value of 53.10 % for koton-karfe is
compared with that of 36.80% for Itakpe iron ore (which is
currently being exploited for use in the blast furnace steel plant at
Ajaokuta and the direct reduction steel plant at Aladja), however
because of the chemical composition of the ore and Its complex
mineralogy, the koton-karfe deposit has been abandoned over
years in favor of the poorer but less problematic Itakpe iron ore
deposit. It can be seen that Fe, SiO2 and P content of run of mine of
koton-karfe iron ore samples do not meet the market specification.
Beneficiation with traditional processing methods such as jigging,
tabling, magnetic separation, floatation etc. and leaching with
chemical reagents (acids or bases) or micro-organism can be
used to produce a concentrate and super concentrates that meet
the market specification [4]. Research on the up-grading of locally
available iron ores in Nigeria has recently received interest after
earlier efforts dating back to the last two decades when the defunct
Nigeria Steel Development Authority (NSDA) was established. A
metallurgical research laboratory was also set up as an appendage
of the NSDA with a mandate to characterized and process locally
available iron ores and other raw materials for the then springing
Iron and Steel industries [1].
The first recorded indigenous reports on the beneficiation of a locally available iron ore are those of [4,5] that worked on the Itakpe iron ore deposit. However, from 1973 upwards, many other iron ore deposits have been located and their beneficiation characteristics ascertained [6]. Thomas determined the work index of the Kotonkarfe iron ore as received (run-off-mine) and after calcinations at 1200˚C, using the Berry and Bruce method. He reported that the work index for the as received was 17.00 kwh/tonne, while that for the calcined gave 11.33 kwh/tonne. He attributed the difference in the work indexes to the possible presence of moisture and some minerals in the as received sample, while in the calcined sample most of the volatile minerals must have been decomposed or transformed thereby making it easier to grind. He also reported that the Koton-karfe iron ore is a soft texture iron ore of the type B according to the Denver grindability curves, which meant that minimum amount of energy was required to crush or grind the ore. [7] developed a process route for the beneficiation of the Koton-karfe iron ore to be used as feeds to Ajaokuta and Delta steel plants. The work includes physical separation process employed to concentrate the ore in terms of its iron content and to reduce the contents of the associated gangues. He reported that of the three concentration methods used, that is, gravity, magnetic and froth flotation, the magnetic concentration method gave the best results at particle size fraction of -180+125μm. However, the high phosphorus content of the ore undoubtedly affects its suitability and process ability for iron and steel making and thus, must be reduced to a desirable or tolerable level.
Materials and Methods
The materials used for this research are 10 kg of Koton-karfe iron ore sample obtained from the Mineralogical Laboratory of National Metallurgical Development Centre (NMDC), Jos, Nigeria and organic acids reagent. The as-received ore was crushed and ground using jaw crusher (BD 1028), cone crusher (HZ24KL) and ball milling machine. A representative sample of about 650 g was obtained through cone and quartering, thereafter air dried for 48 hours to remove surface moisture in the ore. About 525 g of the asreceived ore was roasted and sieved using Electric sieve shaker to produce different particle size: 3.35, 2.36, 1180, 600, 475, 300,150 and 75μm.
Ore roasting
About 650 g of the Koton-karfe iron ore was placed in a silica dish 145x85x20 mm to occupied three quarter of the silica dish. The sample was placed in a cold furnace and the thermostat was set at 350˚C and then switched on. The furnace’s door was 25 mm wide opened throughout the roasting period to ensure an unrestricted supply of oxygen. The sample was turned after every 15 minutes interval for efficient mixing. The temperature was raised by 100˚C every hour until the roasting temperature was reached. This was done in four steps at 25˚C in every 15 minutes. The roasting temperature was 750˚C. The sample was left in the furnace at 750˚C for further two hours, while still turning the sample at every 15 minutes.
Sieve analysis
A mass of 525 g of the roasted Koton-karfe iron ore sample was poured into the nest of sieves through 3.35μm size. The sieve shaker was mechanically vibrated for about 20 minutes. The different micro sizes were obtained and the 75μm and 475μm size were taken for the research. Similarly, about 525 g of the asreceived Koton-karfe iron ore sample were sieved using the same procedure to obtained 75μm and 475 μm size as a control sample.
Optical microscopy (photomicrography analysis)
The koton-karfe iron ore concentrate was characterized microscopically, using the Leica reflected light microscope model number DMRX/MP60 and CETI light transmission microscope with magnification 4/0.1, fuse 250 V, bulb type 6 V, 20 W. The Glass slides of the samples were prepared by placing each of them on a hot plate after they have been smeared with a mixture of Araldite resin and hardener as at when moderately hot. The pulverized koton-karfe iron ore was off the slide and the stuck particles lightly tapped with a spatula to drive off air bubbles from the particles. After about 30 minutes the slide laden with the concentrate particles was washed with water and allowed to dry in air overnight to ensure it stuck permanently to the slide. The concentrate laden face of the slide was grounded on a motor driven grinding wheel until its thickness is sufficiently reduced to about 2 mm thickness. Afterwards, the surface was polished with silicon carbide until it became transparent to transmit light. The polished surface was thereafter viewed under a Medina Scientific CETI light transmission microscope model number 0727808, at a magnification of x4. The images obtained were transfer to the computer, via a digital camera attached to the microscope. This enabled the micrograph to be obtained in electronic form.
24 Factorial designs for single stage leaching experiment
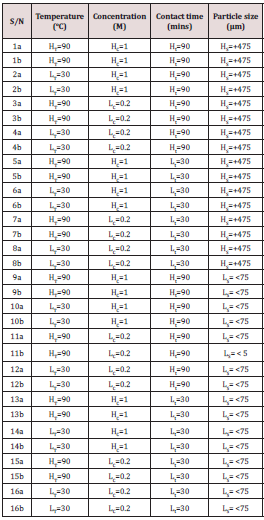
The experimental design for single stage leaching process was designed by taking two levels of each of all four process parameters. The high and low temperature (HT and LT), the high and low molar concentration of the most active organic acid (HC and LC), the high and low contact time (Ht and Lt) and the high and low particle size of Koton-karfe iron ore (HS and LS). This design generated a total of sixteen experimental runs and was duplicated to give a total of thirty- two (32) experimental runs in order to ensure accurate result. The leaching routes were displayed in row in the tabular form as the experiment was carried out in row form.
Single stage leaching
Under single stage leaching process, both high and low concentration (HC= 1.0 M, LC= 0.2 M) of the most active organic acid determined were prepared and the leaching process was carried out such that either of the 1 g of +475μm or 75μm size of koton-karfe iron ore sample was transferred into 250 ml beaker containing 1M or 0.2 M molar concentration of formic acid and was heated in a Gallenkamp oven set at certain temperature of either HT = 90˚C or LT= 30˚C for a contact time of either Ht = 90 minutes or Lt= 30 minutes according to the 24 factorial design leaching method. The process was carried out in duplicate and it generated a total of thirty-two (32) experimental runs as shown in Table 1.
Multistage leaching
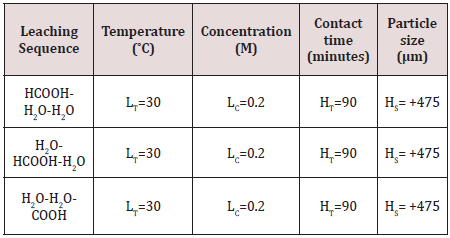
Multistage leaching process as indicated in Table 2was carried out in three sequences of acid-water-water, water-acid-water and water-water-acid. This leaching procedure was done by the use of Formic acid being the most active organic acid and the most leached process parameters obtained from the single stage leaching (low temperature- LT, low concentration- LC, high contact time- Ht, high particle size- HS). For the first sequence (acid-water-water), 1 g of +475 µm size of Koton-karfe iron ore sample was weighed and transferred into the 250 ml beaker containing 30 ml of 0.2 M of aqueous solution of formic acid, stirred for about 5 minutes and was heated to a temperature of 30˚C in a Gallenkamp oven for 90 minutes. The remaining residue was transferred into the 250 ml beaker containing 30 ml of distil water, stirred and heated in a Gallenkamp oven set at 30˚C for contact time of 90 minutes.The solution was filtered and the residue collected, after oven dried for about 90˚C. The residue was transferred again into 250 ml beaker containing 30 ml of distil water, stirred for about 5 minutes and was heated in a Gallenkamp oven set at 30˚C for 90 minutes. Then, it was filtered and the residue was collected and oven dried for about 90˚C. The weight of the final residue was weighed and noted.
The second sequence (water-acid-water) was carried out with 1 g of +475μm of Koton-karfe iron ore sample was transferred into 250 ml beaker containing about 30 ml of distil water, stirred for about 5 minutes and was heated in a Gallenkamp oven for 90 minutes. The solution was filtered and the residue was collected, after oven dried for about 90˚C. The residue was transferred again into 250 ml beaker containing 30 ml of distil water, stirred for 5 minutes and was heated in a Gallenkamp oven set at 30˚C for 90 minutes. The weight of the final residue was weighed and noted. The third sequence (water-water-acid) was carried out in the same manner as the first two sequences. About 1 g of high particle size of +475 μm Koton-karfe iron ore was transferred into 250 ml beaker containing 30 ml of distil water. The solution was stirred for 5 minutes and was heated in the Gallenkamp oven set at a temperature of 30˚C for 90 minutes. The solution was filtered through whatman filter paper and the residue was collected. The residue was oven dried at 90˚C. The residue collected was transferred again into the 250 ml beaker containing about 30 ml of distil water, stirred for 5 minutes and was heated in the Gallenkamp oven set at a temperature of 30˚C for 90 minutes. Then, the solution was filtered to collect the residue and oven dried. The remaining residue was transferred into the 250 ml beaker containing about 30 ml of 0.2 M aqueous solution of formic acid. The solution was stirred for 5 minutes and heated in the Gallenkamp oven set at a temperature of 30˚C for 90 minutes. Then, the solution was filtered the whatman filter paper and the residue was collected. The residue was oven dried and weighed. The residues obtained from those three sequences of acid-waterwater, water-acid-water and water-water-acid were examined and the sequence that gave the highest weight loss was taken as the best multistage leaching.
X-ray fluorescence spectroscope (XRF)
About 0.5 g of + 475μm size of as-received, as-roasted, the best single stage leached sample, and the best multistage leached sample were pelletized each to obtain cylindrical pellets suitable for the X-ray fluorescence spectrometer machine model HERZOG PW1606. Each pellet was mounted on the sample holder and irradiated in the XRF for 20 minutes at a fixed tube operating condition of 25 KVA and 6 mA. The test result was displayed on the computer connected to the X-ray fluorescence spectrometer and the percentage of the Phosphorus, Sulphur content and other elements present were analyzed and recorded.
Fourier transform infrared spectroscope (FTIR)
About 2 mg of as-roasted and as-received sample of Koton-karfe iron ore was mixed with about 200 mg of (Potassium Bromide) KBr. The mixture was dried and grounded. The particle size is unified and less than two micrometers. The mixture of as roasted Kotonkarfe iron ore and KBr was squeezed to form transparent pellet that can be analyzed directly. The background spectrum was collected by an interferogram and its subsequent conversion to frequency data was by inverse Fourier transform. The single beam spectrum of the sample was collected which contains absorption bands of the as-roasted Koton-karfe iron ore as well as the background spectrum (gaseous or solvent). The ratio between the single beam sample spectrum and the single beam background spectrum gives the spectrum of the as roasted Koton-karfe iron ore and the data analysis was done by assigning the observed absorption frequency bands in the sample spectrum to appropriate normal models of vibration in the molecules. The procedure was repeated for as received and best leached koton-karfe iron ore. FT-IR (Model IR Prestige 21) analysis was carried out on the best leached Kotonkarfe iron ore, best multistage leached sample, and as-received Koton-karfe iron ore sample. All the Infrared spectra were plotted on each specimen over the frequency range 4000-400 cm-1at resolution of 4 cm-1.
Results and Discussion
Particle size distribution
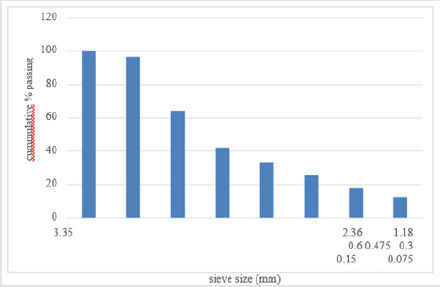
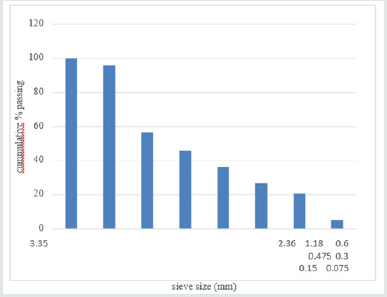
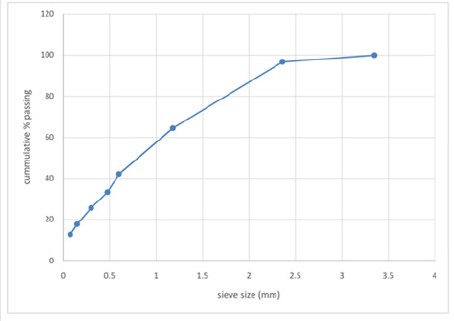
The particle size analysis result obtained for the as-received
and as- roasted Koton-karfe iron ore are presented in Figures 1 &
2 respectively. The result obtained shows that the mesh sieve size
3350μm has the highest % mass passing (100 %) while the mesh
sieve size 75μm has the least of 12.75% passing. The results of
particle size distribution of as-received koton karfe iron ore through
a nest of a sieve is presented in Figure 1, while the result of particle
size distribution of roasted Koton-karfe iron ore is presented in
Figure 2. The results show that 96.68 % passing of as-received
Koton-karfe iron ore through the 2360μm mesh size, followed by
64.48 % passing through the 1180 μm mesh size, 42.13 %, 33.27 %,
25.61 %, 17.72 %, and 12.75 % passes through the 600 μm, 475 μm,
300 μm, 150 μm, and 75 μm respectively. The greatest percentage
of 100 % of Koton-karfe iron ore passing through 3350 μm mesh
size shows that the iron ore is mainly of medium grade size [3].
The result obtained for the as-roasted Koton-karfe iron ore shows
that the mesh size 3350 μm has the greatest % cumulative passing
which is similar to the as-received sample of Koton-karfe iron ore,
while the mesh size 75 μm has the least of 5.15 % of as-roasted
Koton-karfe iron ore passing different from the result obtained for
as received Koton-karfe iron ore. The result show that 95.95 % of
as-roasted Koton-karfe iron ore passing through the 2360 μm mesh
size was obtained, followed by 56.62 % % passing through the
1180 μm mesh size, 45.80 %, 36.44 %, 26.80 %, 20.73 %, and 5.15
% passes through the 600 μm, 475 μm, 300 μm, 150 μm, and 75
μm respectively. These shows that the as-roasted Koton-karfe iron
ore sample has improved compared to the as-received Koton-karfe
iron ore that is the as-roasted sample has a finer component than
as-received Koton-karfe iron ore sample.
The leaching in this research work was carried out using the
samples +475μm mesh size and <75μm sieve size which are 36.44
% and 5.15 % respectively. Cumulative size distribution in bar chart
are presented in Figures 1 & 2) and line graph in Figures 3 & 4)
which explained the trend in which the percentage passing sample
in cumulative form rises with respect to the sieve number.
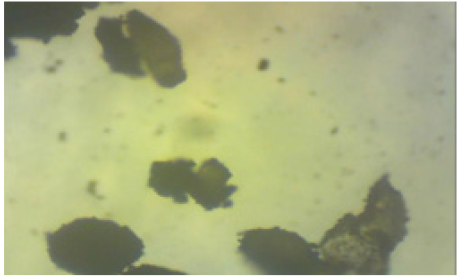
Figure 4: The photomicrograph of as-received Koton-karfe iron ore sample (475 μm)
showing whitish to grey quartz and few dark opaque iron ore (x100).
Photomicrographs
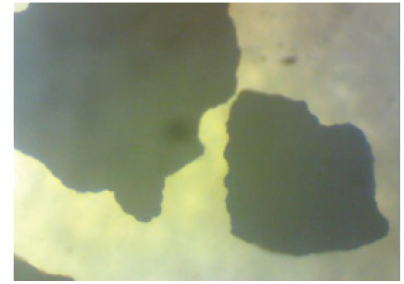
The results of the reflected or light transmission micrographs of the Koton-karfe iron ore sample as-received, as-roasted and the best multistage leached roasted are presented in Figures 4-6 respectively. Figure 4 shows that Koton-karfe iron ore as-received has whitish to grey colour of quartz; dark grey colour in reflected light and whitish in transmitted light which is in line with [8]. Figure 5 indicates that the ore as-roasted has much dark opaque colour in transmitted light signifying the present of the iron bearing mineral in the Koton-karfe iron ore [8]. Figure 6 has shown more opaque colour than Figure 5 indicating larger amount of the iron bearing mineral in Koton-karfe iron ore as confirmed by the XRF analysis. The dark opaque patches are also found to be larger in size in the roasted than in the as-received sample. The results obtained thus strongly suggest that both roasting and leaching treatments improved the iron mineral contents of the ore [9]. In addition, the roasting treatment might have caused the coarsening of the iron ore particles in the process of converting from ferrous to the ferric state. The roasting might have converted most of the iron II oxides to iron III oxide and decompose components such as carbonates, while leaching might have converted gangue oxides like silica and calcium oxide to silicates. It can thus be inferred that the organic acid leaching with Formic acid has caused a reduction in the gangue oxides [8].
Figure 5: The photomicrograph of Koton-karfe iron ore as-roasted sample (475 μm)
showing whitish to grey quartz and dark opaque iron ore (x100).
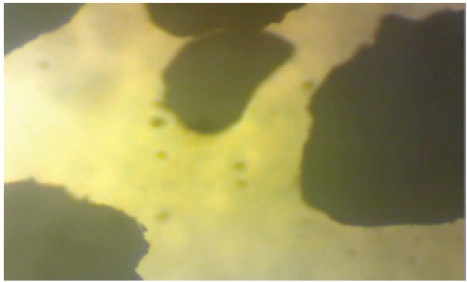
Figure 6: The photomicrograph Multistage leached Koton-karfe iron ore sample (475 μm)
showing whitish to grey quartz and dark opaque iron ore (x100).
Single- stage leaching experiments
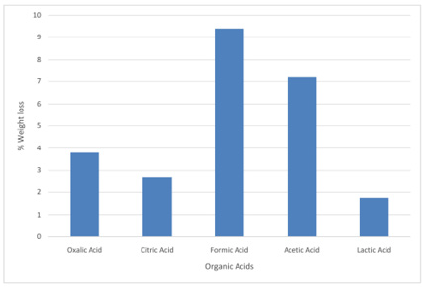
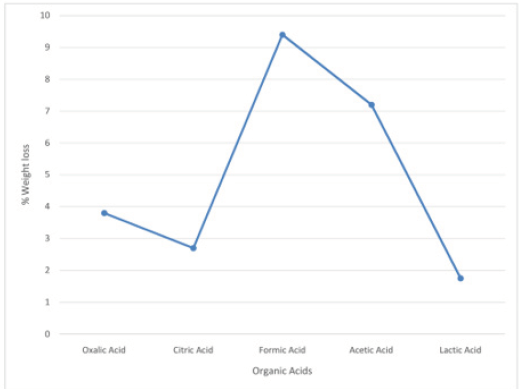
The results obtained from the preliminary single stage leaching to determine the most active organic acid among the selected organic acids are presented in Figures 7-10, respectively. The results show formic acid as the most active organic acid for the leaching of Koton-karfe iron ore. When a low concentration of 0.2 M of oxalic, citric, formic, acetic and lactic acids were used to leach the -75μm fractions of Koton-karfe iron ore samples at a low temperature of 30oC and low contact time of 30 minutes. The average weight losses obtained due to the leaching out of the gangue oxides were 4.13, 4.1, 8.33, 6.43 and 3.90%. The reductions in weight obtained for leaching with oxalic, citric and lactic acids are close and are very much lower than for formic acid. This may be due to the fact that both of them are high in molecular weight and the higher the molecular weight of the organic acid the lower the reactivity [10]. The observation that formic acid gave the highest weight reduction suggests that the increase in the carbon ratio of an organic acid decreases its strength since it has the lowest molecular weight of the acid used [10]. The potency of formic acid (HCOOH) is further affirmed from the fact that it is a methanoic acid with the least hydrogen ion (H+). It has also been observed that formic acid is miscible with water and it is a high polar organic solvent somewhat soluble in hydrocarbon [10]. The high leaching potency of formic acid is shown by its use in cleaning purpose as a substitute for mineral acids [9]. The acetic acid which is next in potency to formic acid is of the ethanoic group and also has a low molecular weight similar to that of formic acid confirming its potency. Results of further work on determination of the most active organic acid are presented in Figures 9 & 10 after leaching coarse particle sizes of Koton-karfe iron ore of +475 μm size consists with the selected organic acids at higher concentration, temperature and contact time of 1M, 90˚C and 90 minutes, respectively. The weight loss % obtained for leaching with oxalic, citric, formic, acetic and lactic acids were 3.23, 0.16, 6.03, 5.03% and 1.86%, respectively. The results obtained showed that the weight loss reductions are generally lower for the coarser fractions of +475 μm than for the much finer fraction of -75μm. Formic acid still gave the highest reduction in gangue oxides leached out confirming its superior leaching potency as confirmed by the XRF analysis.
Figure 7: Bar chart on leaching activities of Koton-karfe iron ore in various organic acids at 30˚C, 75 μm, 30 mins and 0.2 M concentration
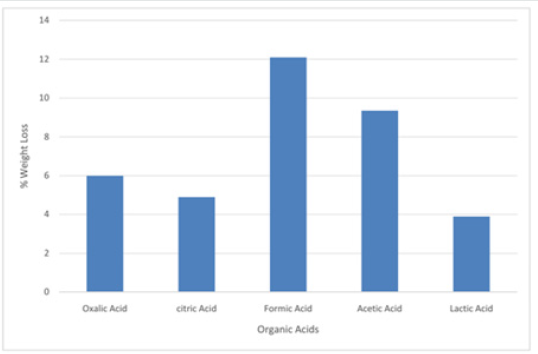
Figure 8: Graph on leaching activities of Koton-karfe iron ore in various organic acids at 30˚C, 75 μm, 30 mins and 0.2 M concentration
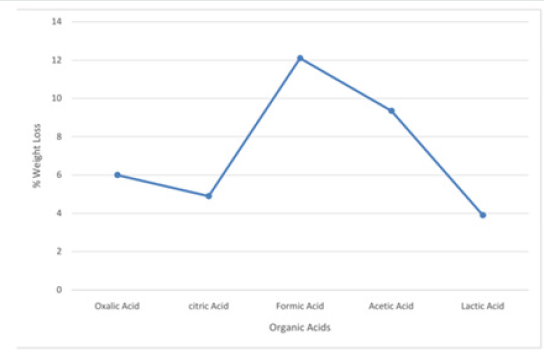
Figure 9: Bar chart on leaching activities of Koton-karfe iron ore in various organic acids at 90˚C, 475 μm, 90 mins and 1.0 M concentration.
Design of 24 factorial experiments
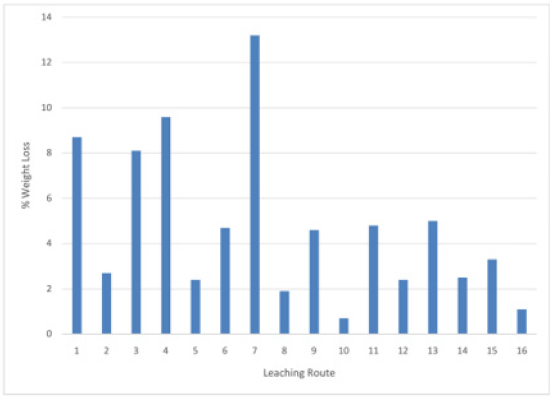
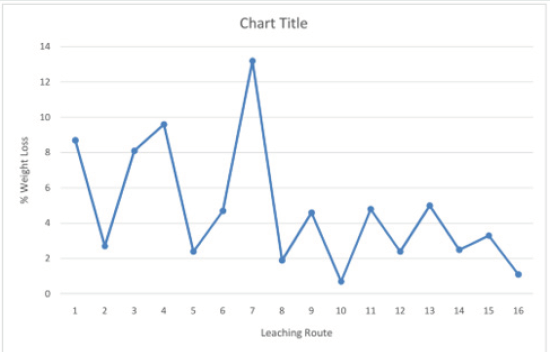
The results obtained in the 24 factorial single stage leaching Koton-karfe with the most potent formic acid (HCOOH) through all sixteen leaching routes is presented inFigures 10&11). The results presented in (Figures 10&11) for the single stage factorial acid leaching using the most active organic acid (Formic). It is observed that the seventh (7th) leaching route gave the highest weight loss of 13.2 %. It was obtained when low temperature of 30˚C (LT) was used with low concentration of HCOOH of 0.2M molar concentrations (LM) to leach +475 µm (HS) coarse particle sizes of Koton-karfe iron ore sample for low contact time of 30 minutes (Lt). The next sequence of process parameters that is next in value to the highest weight loss is fourth (4th) leaching route which gave the weight loss of 9.6 % and it is obtained when low temperature of 30oC (LT) with low concentration of HCOOH of 0.2M concentration was used to leach coarse particle size of Koton-karfe iron sample of +475 µm (HS) at high contact time of 90 minutes (Ht). Also, the least weight loss is observed in the tenth (10th) leaching route with a weight loss 0.7 %.This weight loss is obtained when low temperature of 30˚C (HT) was used with high concentration of HCOOH of 1M (HC) to leach fine particle size of Koton-karfe iron ore sample of -75 µm (LS) at high contact time of 90 minutes (Ht). The results obtained show that Koton-karfe iron ore sample with HCOOH leached at high temperature, low concentration, low contact time and high particle size gave the highest leaching effect in terms of weight loss of gangue oxides. The highest value of weight loss recovery was obtained at a very low concentration of HCOOH, because the increasing concentration of organic acids causes little increase in the solution acidity because the organic acid is only partially dissociated in aqueous solution and by dilution of the acid with water, the surface area of contact between the acid and the carbonates will increase [11]. Analysis of the results in Figure 12shows that low concentration of Formic (HCOOH) at high temperature of Koton-karfe iron ore sample in an oven and low concentration of Formic (HCOOH) at low contact time bring about general reduction in weight of the Koton-karfe iron ore sample.
Figure 10: Bar chart on leaching activities of Koton-karfe iron ore in various organic acids at 90˚C, 475 μm, 90 mins and 1.0 M concentration
Multistage leaching
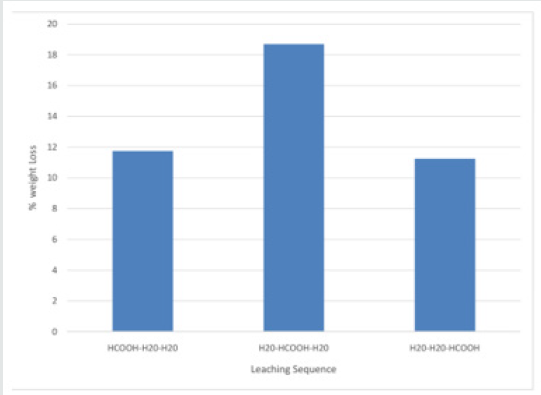
The results obtained for the multistage leaching when Koton-karfe iron ore sample was leached in the sequence HCOOH-H2O-H2O, H2O-HCOOH-H2O and H2O-H2O-HCOOH are presented in Figure 13 in which the weight losses of each sequence are 11.7 %, 18.7 % and 11.3%, respectively. Figure 11 further shows that the first stage dilute HCOOH leaching in the HCOOH-H2O-H2O leaching sequence yielded a higher weight loss for the HCOOH than the second stage leaching in the H2O-HCOOH-H2O route that however gave higher weight losses for its last two stages resulting in the cumulative highest reduction. The results thus showed that the preliminary water treatment with an intermediate acid leaching and a final water washing was more efficient than the first stage acid leaching followed by two stage water cleanings. The results agreed with the observation of [11, 12] on the dilute sodium carbonate leaching of Lafia-Obi coal and the dilute sulphuric acid leaching of Itakpe iron ore, respectively. The higher leaching potency of the H2O-HCOOH-H2O leaching route may be because the initial water treatment cleaning makes the iron particles more responsive to the leaching reaction.
Figure 13: Bar chart of multistage leaching of Koton-karfe iron ore at 0.2 M concentration, 90˚C, 30 mins and 475 μm
X ray Fluorescence Analysis (XRF)
Table 3 shows the XRF analysis of the as received sample of Koton-karfe iron ore with the major constituents of the iron ore to include Fe–43.45, Si – 25.85Mn– 0.8215, P– 0.0246, Mg-0.4263, Ca – 0.6298, Ti – 0.261, Na-0.4092, K-0.3272 and S- 0.0980 % This agrees with initial observations by [13]. The results obtained show that the iron ore is of medium grade type with low P and S contents.
Roasting of the koton-karfe iron oreThe effect of roasting the iron ore was observed in the Table 3). There was a drastic reduction in the % of phosphorus and sulphur of about 51.22 and 48.98, respectively. The percentage purity of the Fe in the Koton-karfe iron ore sample was observed to increase by 7.38 % as a result of the roasting process. The results show that the roasting process reduced the P and S contents and this suggest these deleterious components were volatized during the roasting. The results obtained agree with the observations of [11, 14].
XRF of leached koton-karfe iron ore
The results of the XRF analysis in Table 3 showed that the multistage leaching of the +475 µm particle size of Koton-karfe iron ore in H2O-HCOOH-H2O sequence at 0.2 M HCOOH yielded iron ore concentrate with 67.89% Fe, indicating about 56.25% upgrade of the Fe content. Similarly, there was a drastic reduction in sulphur and phosphorus content by 98.98 % and 95% respectively when the ore was roasted at 750˚C, and then leached in the H2O-HCOOH-H2O sequence. The results obtained agree with the observations of[15-17] that roasting causes the ore to be more amenable to leaching and that the degree of goethite to hematite is expected to increase with the roasting temperature and time. The Fe content of the concentrate exceeds the 63% specification for the blast furnace use and is slightly higher than the 67% Fe content required for Midrex direct reduction process [8, 18]. The very high reduction in alkalis oxides is significant because they cause major incidents like frozen hearth in the blast furnace [19].
FTIR analysis of koton-karfe iron ore
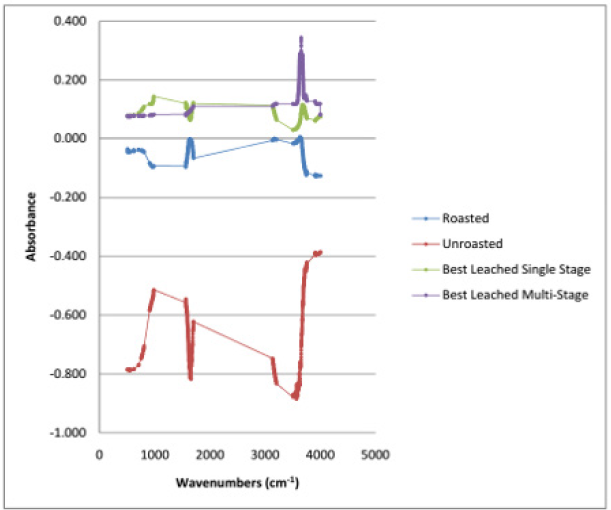
The FTIR results for as-roasted show an absorption corresponding to Fe in the ore the FTIR spectra for the as leached, as roasted and as received is as shown in Figure 14. The presence of broad and intense absorption band at 3100-3200 cm-1is due to FeOOH. Absorptions at 795 and 913 cm-1are due to O-H bending and serve as diagnostic bands for FeOOH in accordance with the observations of [13]. Absorption at 3694 cm-1represents surface hydroxyl groups. The absorption band due to bulk hydroxyl stretch of the studied iron ore range between 3124 and 3133 cm-1and one absorption band due to surface hydroxyl group at about 3416 cm-1. The complete disappearance of the absorption band at 3660 cm-1indicates that the phosphate was adsorbed on the surface of the iron oxy-hydroxides which was in agreement with the observations of [15]. The results also conform to those obtained from the XRF analyses. The band at 3484 cm-1 was not replaced by adsorbed phosphates. The presence of structural SO3 can be expressed by bands at 982 cm-1 and around 610 cm-1[3, 13]. This shows the absorption of sulphur in oxide form. The band at 610 cm-1 for SO3 may overlap with the iron band [16]. A band at1085 cm-1 can be related to quartz[10]. These bands can be used to identify the degree of crystallinity and the extent of Al- for Fe-substitution in the iron structure [20]. Quartz was identified by FTIR at 1082 cm-1 (Si–O).
Conclusions
This research has proven beyond doubt that Koton-karfe iron ore can be fully utilized to supply iron ore concentrate to the Ajaokuta and Aladja steel plants, since a super-concentrate with 67.87% Fe grade was obtained even for the coarse ore fraction. This grade exceeds the 63% Fe specification for the blast furnace use and slightly higher than the 67% Fe required for Midrex direct reduction process. The research has also shown that hydrometallurgical process is an effective beneficiation route for the separation of iron oxide from other gangue oxides in the Koton-karfe iron ore. It can also be deduced that the roasting process significantly enhanced the leaching removal of sulphur, phosphorus and other gangue materials in Koton-karfe iron ore. Formic acid proved to be the best organic acid for the leaching of phosphorus, sulphur from the Koton-karfe iron ore resulting in the removal of 95% and 98.98% phosphorus and sulphur content, respectively. The pre-roasting leaching process thus reduce the phosphorus and sulphur content in the Koton-karfe iron ore below the specification indicating a more efficient steelmaking with the ore because high percentages of phosphorus causes steel embrittlement. The conclusions in line with the objective are enumerated below; the chemical and screen distribution composition of Koton-karfe iron ore has been determined, Pre-roasting was effective in raising the % purity of Fe by 7.96 %, multistage leaching reduced the SiO2 in the roasted ore by 80.85% and S, P by 98.98, 95.00%, respectively and the multistage leaching has rendered the coarse Koton-karfe iron ore suitable for use for both Blast Furnace and Midrex processes.
References
- Uwadiale GGOO, (1989) Up-grading of Nigerian Ore. Journal of Mineral and Metallurgical Processing pp. 117-123.
- MMSD(2010) Iron Ore Exploration Opportunity in Nigeria. Fed. Min. of Mines and steel Development, Abuja, Nigeria.
- Haroyushi Tanabe and Masayuki Nakada (2003) Steelmaking Technologies, contributing to steel industries. NKK Technical review pp. 18 – 27.
- Uwadiale OO (1984) Beneficiation Studies of Agbaja Iron Ore, Ph.D. Thesis, Department of Pure and Applied Chemistry, University of Strathclyde, Glasgow, Scotland.
- Umunakwe PU (1985) Developing a new mine: The Itakpe case, Proceedings of the Annual Conference of Nigeria Mining and Geosciences Society.
- Thomas (2012) Determination of the work indexes of the run-off mine and calcined Koton karfe iron ore. Nigerian Journal of Engineering 18(2).
- Thomas DG (2008) Development of Process Route for the Beneficiation of KotonKarfe Iron Deposit: Seminar on PhD Dissertation, Dept. of Metallurgical and Materials Engineering, Ahmadu Bello University, Zaria.
- US EPA (1994) Extraction and Beneficiation of ore and minerals. Technical resource document Vol. 3.
- ASTM C-1220 (1998) Standard Test Method for Static Leaching of Monolithic waste Forms for Disposal of Radioactive Waste. American Society for Testing and Materials, Annual Book of ASTM Standards 12(1): 609-624.
- Roman M Balabin (2009) Polar (Acyclic) Isomer of Formic Acid Dimer: Gas-Phase Raman Spectroscopy Study and Thermodynamic Parameters. J. Phys. Chem. A 113(17): 4910-4918.
- Jin Yong shi, Jiang Tao, Yang Yong bin, Li Qian, Li Guang hui et al. (2006) Removal of phosphorus from Changde iron ore by chemical leaching. Journal of Central South University of Tecchnology 13(6): 673- 677.
- ASTM D-4874 1995 Standard Test Method for Leaching Solid in a Column Apparatus. American Society for Testing and Materials, Annual Book of ASTM Standards 11(4): 78-84.
- Brent Hiskey (2000) "Metallurgy, Survey" in Kirk-Othmer Encyclopedia of Chemical Technology. Wiley-VCH, Weinheim.
- Dukino, RD, England BM, Kneeshaw M, (2000) Phosphorous distribution in BIF-derived iron ores of Hamersley Province, Western Australia. Trans Instn Min Metall (Sect B: Applied Earth Science) 109: 168 -176.
- Fleming, LN, Harrison NA, Inyang HI (1996) Leachant pH Effects on the Leachability of Metals from Fly Ash. Journal of Soil Contamination5 (1): 53-59.
- Somnath Basu (2007) Studies on dephosphorization during steel making.
- Wills BA (1985) Mineral Processing Technology 3rd Pergamon Press, United Kingdom, pp.78-90.
- Ghosh A, Ray HS (1991) Principles of Extractive metallurgy (2nd edition). New Delhi.
- Poos A (1992) Future requirements for blast furnace coke quality. Cokemaking International4: 29-30.
- Babich A, Senk D, Gudenau HW, Mavrommatis KTh (2008) Iron making Textbook. Die Deustech Publikation in der Deutschen.

Top Editors
-

Mark E Smith
Bio chemistry
University of Texas Medical Branch, USA -

Lawrence A Presley
Department of Criminal Justice
Liberty University, USA -

Thomas W Miller
Department of Psychiatry
University of Kentucky, USA -

Gjumrakch Aliev
Department of Medicine
Gally International Biomedical Research & Consulting LLC, USA -

Christopher Bryant
Department of Urbanisation and Agricultural
Montreal university, USA -

Robert William Frare
Oral & Maxillofacial Pathology
New York University, USA -

Rudolph Modesto Navari
Gastroenterology and Hepatology
University of Alabama, UK -

Andrew Hague
Department of Medicine
Universities of Bradford, UK -

George Gregory Buttigieg
Maltese College of Obstetrics and Gynaecology, Europe -

Chen-Hsiung Yeh
Oncology
Circulogene Theranostics, England -
.png)
Emilio Bucio-Carrillo
Radiation Chemistry
National University of Mexico, USA -
.jpg)
Casey J Grenier
Analytical Chemistry
Wentworth Institute of Technology, USA -
Hany Atalah
Minimally Invasive Surgery
Mercer University school of Medicine, USA -

Abu-Hussein Muhamad
Pediatric Dentistry
University of Athens , Greece

The annual scholar awards from Lupine Publishers honor a selected number Read More...


