


Lupine Publishers Group
Lupine Publishers
ISSN: 2641-6921
Research Article(ISSN: 2641-6921) 
The Effect of Layer Lay-Up on the Formability of Al/Cu Two Layer Sheet in Electromagnetic Forming Volume 4 - Issue 2
Received:May 25, 2021; Published: June 15, 2021
*Corresponding author:Alireza Fallahi Arezoodar, Mechanical Engineering Department, Amirkabir University of Technology, Tehran, Iran
DOI: 10.32474/MAMS.2021.04.000185
Abstract
Electromagnetic sheet forming is a high-velocity process that the strain rate is considerable. The formability of the material increased in the high strain rate process. In this study, an Al/Cu two- layer sheet’s formability at a high strain rate is investigated using electromagnetic forming. The two-layer sheet produced by the explosive method was used to create different geometry and different strain states in the experimental test. The necking strain was extracted by griding the sheet. The coil is designed to create enough pressure to reach the fracture in the sheet. The driver sheet is also used to create more pressure on the workpiece. The displacement of the sheet and the strain distribution were investigated in a different geometry with different widths. The magnetic pressure is 19% higher in the CA lay-p (Cu near the coil and Al near the die) than the AC lay-up (Al near the coil and Cu near the die). The strain distribution is calculated in a different geometry. The results showed that in low-width geometry, the sheet’s free edges have the maximum strain, and the strain distribution is not uniform in the sheet. The strain distribution is uniform in the workpiece wider than 50 mm because the driver sheet cannot pass through the sheet’s sides. The Al/Cu two-layer sheet’s formability in the AC lay-up is greater than the CA lay-up. This value has reached about 42% in the W75 geometry.
Keywords: Electromagnetic forming; Al/Cu two-layer sheet; strain distribution; formability
Introduction
The sheet metal forming process is widely used in the industry. Formability is the inherent characteristic of a material. Forming limit diagrams (FLDs) are used to determine the formability of metallic sheets. Keeler and Baclofen first introduced the FLD concept in 1961[1]. The researcher’s results have demonstrated that FLDs are affected by several factors such as strain rate, strain hardening index, and sheet thickness [2,3]. Marciniak and Kuczynski using the theory that considers the necking develops in regions of the initial heterogeneity [4]. They assumed an initial geometrical nonhomogeneity in the form of a groove on the sheet [4,5]. The thickness in the groove zone is less than the safe zone. The groove grows and changes its direction when the force is applied. Nowadays, twolayer metallic sheets are widely used in various industries, such as aerospace and automotive. In 2016, Hashemi et al. calculated the FLDs of Aluminium–Copper two-layer metallic sheets using the (M-K) theory. In their research, equations for the M-K method were used simultaneously as a set of non-linear equations. The results had a good agreement with the experiment. In 2016, Karajibani et al. [6] investigated the FLD of Aluminium-Copper two-layer sheet. They used numerical simulation and experimental verification for their research. By using the acceleration of the equivalent plastic strain, they found the time of necking. Results from the numerical simulations were fairly in agreement with the experiment. Tseng et al. [7] analyzed Aluminium/Copper clad metals’ formability with different thicknesses by experimenting and using the numerical method. They found that the formability of clad metal sheets can be controlled by changing the holding force and the blank diameter in deep drawing tests. Marandi et al. [8] used the hydraulic bulge test equations to predict the bulge height. The experimental results showed that the layer’s lay-up does not affect the test results. Darabi et al. [9] investigated the effect of layers lay-up and material properties on two-layer sheets’ formability. They developed the analytical model based on the M-K model to predict a two-layer sheet forming limit diagram. They found that the strain hardening exponents and the strain rate sensitivity coefficients significantly affect the two-layer sheet’s formability. Zahedi et al. [10] determined the necking and fracture forming limit curves of laminated Al/Cu sheets using a damaged plasticity model. They used the time-dependent method and the modified XueWierzbicki damage plasticity model in the Abaqus/Explicit. They found that the thinning of the sheet occurs earlier if the outer layer is Aluminium. In this layer lay-up, the necking happens in lower strains. Therefore, the forming limit diagram of the Al/Cu two-layer sheet is higher when the Al layer is an inner layer. Alai et al. [11] investigated the forming limit diagram and the bimetallic Al/Cu composite sheet’s mechanical properties at different temperatures. The result showed significant anisotropy in the Al/Cu composite sheet due to the explosive welding process. The Al/Cu composite sheet’s formability enhanced about 34.8% when the temperature increased from 230C to 120C and 67.5% when it increased from 1200C to 2200C [12].
Using a high strain rate forming process is a way of increasing metal formability. Electromagnetic, electro-hydraulic, and explosive forming are the most practical processes in high strain rate conditions. Gerdooei et al. [13] investigated the effect of strain rates on sheet metal formability in the experiment. They showed that the strain rate is more effective on the Al sheet than the Steel sheet. The positive minor strain states increase more than negative minor strain. Pepelnjak et al. [2] studied the impact of the strain rate on sheet metal formability at room temperature. They investigated the effect of strain on the yield stress and flow curves [14]. The strain rate and the use of two-layer metal to increase the formability of low ductility metals have been frequently studied. However, there has been little study of FLD of two-layer metal at a high strain rate. Thus, this research aims to investigate the effect of layers lay-up on the formability of Al/Cu two-layer sheet strains at a high strain rate. The coil is designed for the process to reach the sheet to fracture. The electromagnetic sheet forming is simulated in the sequentialcoupled method. The workpiece with a different geometry is used to create different strain conditions. The driver sheet is also used to create more pressure and more displacement on the workpiece. The experimental test was also done for the verification of simulation results.
Determining The Magnetic Pressure
A series of equations are used to determine the pressure. We assumed that for the EMF process that takes place in a very small interval of time, the inductance could be constant. If the mutual inductance does not change during sheet forming, the discharged current in the coil is expressed by Equation (1).
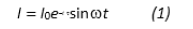
Where I0 represents the maximum intensity of the discharge current, t the circuit’s damping
coefficient, and w the angular frequency. According to the reference [15], the magnetic field
density B possesses a radial component follows:
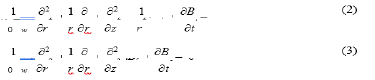
Where sw is the workpiece’s conductivity, m0 is the void permeability, and t defines the time.
The eddy current has only a circumferential component due to axisymmetric of the sheet. Lorentz force density has a radial and an axial component as:
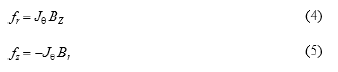
Where
Jθ is circumferential component of eddy current.
The magnetic pressure applied on the sheet is given by equations (6) and (7).
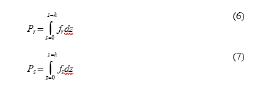
Where h is the thickness of the sheet.
Using the finite difference method explained in the reference [15], the magnetic pressure acting on the sheet can be estimated.
Simulation
In this section, the simulation of the electromagnetic sheet forming investigated using Maxwell and ABAQUS software.
Coil Design
To achieve the appropriate electromagnetic pressure to create sufficient forming in the sheet, four coils with Table 1 specifications were designed. All four coils were modeled in Maxwell software, and the maximum pressure at maximum current was extracted from the software. The maximum pressure of each coil is given in Table 1.
Table 1: Coil design parameters and the maximum pressure for each coil.

Finally, the fourth coil was selected as the optimal coil with sufficient pressure to form the sheet. Figure 1 shows the coil simulated in the Maxwell software. The coil is designed in 9 turns with double layers to produce sufficient magnetic pressure. The upper plate is located on the top of the coil with a 200 mm diameter hole in its center to allow the magnetic field to move through the upper plate. The sheet is on the upper plate, and the die is fixed on the sheet using four screws. Each section of the coil’s turns is set as one coil in MAXWELL software, then all of the coil’s turns are attributed to one winding. The winding is connected to the external circuit modelled in Maxwell circuit software with a 256 μF capacitor bank. A big cylinder of air surrounds the whole model and insulates it from the environment. The Eddy effect should be considered for the sheet, coil, and die. Meshing in Maxwell software is done automatically, and only the size of each element must be entered manually. The element’s size is considered 50 mm for cylindrical air and 10 mm for the sheets and die. The skin depth effect is also considered in the mesh module. The magnetic field is calculated on the sheet at the current peak time. Finally, the magnetic pressure is used as a mechanical pressure in finite element software.
Figure 1: The coil simulated in the Maxwell software.

Mechanical Simulation
Simulation of the electromagnetic forming process of the sheet forming consists of two fields, magnetic and mechanical structure. Hence, both the magnetic and mechanical structure part of the process must be simulated [16,17]. Sequential coupled and loosed coupled methods can be used for the simulation of electromagnetic forming. In this study, the sequential coupled method is used to make fewer errors than experimental tests using the magnetic pressure equations. For simulation, the ABAQUS 6.14 commercial software and a subroutine in VDLOAD are using. The pressure applied on the sheet in each time step is calculated using the subroutine. The inductance change according to the geometry change is considered in the subroutine after each time step. The geometry updated and the magnetic pressure calculated using the finite difference method. The ABAQUS finite element software is used in the mechanical simulation. The explicit dynamic analysis should be considered in the ABAQUS solver because of the forming process’s non-linear nature. The sheet is modeled as a shell, and the die and upper plate are modeled as rigid bodies in ABAQUS. The composite shell section is assigned to each layer. The properties of each layer and its thickness are defined separately for each layer. The bending effect is concluded in the simulation using five integration points through the thickness. Figure 2 shows half of the sheet’s model, die, and upper plate used in ABAQUS software. The electromagnetic forming process has a dynamic condition, and the strain rate is higher than the static condition. The tensile test results are not helpful for the simulation of the electromagnetic forming process. The flow stress behavior of materials is modeled using Johnson-Cook’s plasticity model [18].
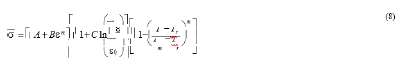
Where A, B, C, and m are material constants and 
plastic strain, strain hardening exponent, strain rate, transition temperature, and melting temperature, respectively. In this study, Al 1050 and Cu 1100 were used. Table 2 shows the Johnson-Cook constants parameters according to the references.
Table 2: The Johnson-Cook constants parameters for Al and Cu.

Figure 2: The half of the model of the sheet, die, and upper plate modeled in ABAQUS.

The interaction between the upper plate, die, and sheet is considered a surface-to-surface contact with a 0.19 coefficient of friction for Aluminum to Steel and 0.15 for Copper to Steel [19,7]. The contact between the sheet and the die is only in the entrance radius of the die. The simulation results showed that the effect of friction in this process is not significant because there is no contact between the pressure source and the sheet in the electromagnetic forming process. Two steps were considered to simulate the electromagnetic sheet forming process: the first step for simulating the draw bead force and the second step for the forming process. In the first step, the upper plate moves toward the die and, after that, is fixed in its position. In the second step, the pressure is applied to the sheet. The forming process was simulated in 100μs. Mesh size verification is used to verify the mesh size. Figure 3 shows the mesh size verification of the sheet. The fine mesh is used only in the center of the sheet instead of using the entire surface. In this way, the time of simulation decreases. The circle with a 50mm diameter is considered as the fine mesh on the sheet.
Finally, the sheet’s element is set as hexagonal with a size of 0.3 mm in the sheet’s center section.
Figure 3: The mesh size verification in the simulation.

Experiment
Table 3: The chemical composition of Al1050 and Cu1100 used in the experiment.

Table 4: The chemical composition of Cu1100.

Table 3 and Table 4 show the chemical composition of Al and Cu layers used to create a two- layer sheet.
By comparing the present Aluminium and Copper’s chemical composition with the standard BS EN 573-3: 2009 and BS EN 13601:2002, the type of materials used is confirmed. The uniaxial tensile test was done according to ASTM-E8 to measure the Al/Cu two-layer sheet’s mechanical properties and the monolithic Al and Cu sheet. Figure 4 shows the Al/Cu two-layer sheet’s stress and strain curve and the monolithic Al and Cu sheet. Table 5 shows the material properties of the Al/Cu two-layer sheet. The forming setup is assembled, as shown in Figure 5. First, the coil was wounded nine turns in a double layer and then located in the coil bed. The coil, lower plate, upper plate, and die were assembled coaxially. Assembly details are shown in Figure 5. The insulation pad is located on the upper plate below the sheet. This pad separates the upper plate and the sheet. The two-layer sheet production used in the experiment is significant because it should not be separated during forming. The explosive joint was used to produce the Al/Cu two-layer. The use of this method for producing a two-layer sheet provides a better bonding between the two layers, and as a result the layers do not separate during the forming process. Each layer’s thickness was determined by observing the layer under an optical microscope with a 50X zoom. The thickness of Al was 0.27, and the thickness of Cu was 0.23.
Figure 4: The stress-strain curve of Al/Cu two-layer sheet and monolithic Al and Cu sheet.

Figure 5: Electromagnetic tool’s structure assembly.

Table 5: The mechanical properties of the Al/Cu two-layer sheet and monolithic layer.

The sheet was cut into different geometries to create different widths. Different load states were created using the different specimen’s width. Figure 6 shows the geometries of the used specimens. The grids are printed on the sheet’s surface with an initial diameter of 3mm. The major and minor strains were calculated using the Dino-light microscope by measuring the sheet’s oval diameters. Figure 7 shows the workpiece with the grid on the surface. By using equations (1) and (2), the major and minor strain can be calculated after the forming process.
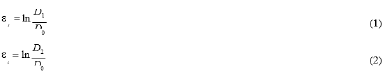
Where, D1 is the major diameter and D2 is the minor axis diameter of the oval circle after forming and D0 is the initial diameter of the printed grids. Figure 8 shows the electromagnetic forming machine, which consists of the following parts: 1- Forming structure 2- Switch 3- Power supply 4- Capacitor banks, and 5- Control part.
Figure 6: Laterality of Vocal Cord Paralysis.

Figure 7: Laterality of Vocal Cord Paralysis.

Figure 8: Laterality of Vocal Cord Paralysis.

Results And Discussion
Figure 9 shows the magnetic pressure applied to the sheet in 5500V discharge voltage in both the AC and CA lay-up. Because of its symmetry, only half of the chart was drawn in Figure 9. As shown in Figure 9, the CA lay-up has a 19% higher magnetic pressure than the AC lay-up. Cu’s electrical conductivity is greater than Al, so a higher eddy current is created in the Cu layer in comparison to the Al layer. According to the Maxwell equation reported in [15], the magnetic field in the Cu layer increased in comparison to the Al layer. Finally, the magnetic pressure increased in the CA lay-up more than the AC lay-up. The magnetic pressure is minimum in the center of the sheet. This phenomenon occurred because of the existence of two magnetic fields’ intersecting on the sheet’s left and right sides. The sheet’s surroundings drive the center of the sheet. The inertial force has a vital role in forming the sheet in EMF [20]. The driver sheet was used below the two-layer sheet to eliminate the electrical layer’s conductivity differences. The driver plate is located on the coil under the two-layer sheet. The magnetic pressure is applied to the driver sheet, and the driver sheet moves away from the coil and impacts the two-layer sheet and forms it. The driver sheet is closer to the coil, and more magnetic pressure is applied to it than the workpiece at the same discharge voltage. Figure 10 shows the driver sheet and two-layer sheet in the electromagnetic forming.
Figure 9: Laterality of Vocal Cord Paralysis.

Figure 10: Laterality of Vocal Cord Paralysis.

As shown in Figure 11, in the same discharge voltage, the sheet’s displacement increased using the driver sheet. The driver sheet is closed to the coil, and more pressure is applied to that, so the displacement of the workpiece increased due to the more pressure. The CA lay-up also has more is placement than the AC lay-up in the same discharge voltage. The pressure applied on the sheet is bigger in the CA lay-up than in the AC lay-up. Figure 12 shows the driver sheet’s effect on the logarithmic strain distribution from the center of the sheet to the sheet’s outer side in the W25 workpiece in 5500V discharge voltage. As shown in Figure 12, the strain distribution is more uniform when the driver sheet is not used in the simulation. Using the driver plate causes the side edges of the main plate to move upwards, causing more strain on the plate’s edges. Figure 13 shows the strain distribution in the width of the workpiece for four different geometry in 5500V. As shown in Figure 13, in W25 geometry, the side of the sheet has a maximum strain comparison to the center of the sheet. This is because the driver sheet passes through the sides of the sheet in W25 geometry and pushes the edges of the workpiece upwards. In the wider workpiece, the driver sheets cannot pass through the main sheet’s sides and only impact it. As a result, using the driver plate at low widths causes nonuniform strain on the workpiece. One of the most important topics in sheet forming is formability. For this purpose, necking strains have been used in this section. Table 6 shows the predicted voltage for the necking of the different workpiece as well as the maximum dome height of the workpiece in the simulation and experimental test.
Figure 11: Laterality of Vocal Cord Paralysis.

Figure 12: Laterality of Vocal Cord Paralysis.

Figure 13: Laterality of Vocal Cord Paralysis.

Table 6: Predicted voltage for the necking and the maximum dome height in simulation and experiment.

As can be seen from Table 6, there is a difference of about 5% to 17% between the dome height obtained in the experimental test and the simulation. This difference is the lack of accurate matching of material properties in simulation and experimental testing and the lack of consideration for sheet anisotropy as well as energy loss in the electrical and magnetic system and the set of wires and coils, which is not included in the simulation. In geometries with higher widths, the dome height predicted in the simulation is higher than the dome height in the experimental test, and for geometries with lower width, it is higher than the experimental results. Figure 14 shows the major strain with displacement when the necking phenomena in three different geometries in AC lay-up. As shown in Figure 14, as the width of the workpiece increases, the location of the necking is not much different because the electromagnetic pressure distribution is constant for all geometries due to the presence of the drive plate. Also, as the sheet’s width increases, the strain mode shifts to the near-plane strain and then to the biaxial stretch mode The major strain in the sheet with W75 geometry in two different lay-ups was calculated at the necking, comparing the AC and CA layups. Figure 15 shows the results of this comparison. From Figure 15, before necking, the strain applied to the sheet in the AC lay-up is greater than the CA lay-up. Therefore, it can be concluded that the formability of the double layer sheet in the AC lay-up is greater than the CA lay-up. This value has reached about 42% in the W75 geometry. Figure 16 shows the thickness distribution in a frame before fracture for three different geometry.
Figure 14: Laterality of Vocal Cord Paralysis.

Figure 15: Laterality of Vocal Cord Paralysis.

Figure 16: Laterality of Vocal Cord Paralysis.

Figure 17: Laterality of Vocal Cord Paralysis.

As shown in Figure 16, the greatest thinning is in the of the sheet’s center and close to it. This area is the place where maximum pressure is applied to the sheet. The center of the sheet is an important place for thinning due to the greatest amount of deformation. Unlike the method of mechanical bulge test, the thinning location has nothing to do with the punch and width of the sheet. Figure 17 shows the necking forming limit diagram of the Al/ Cu two-layer sheet calculated from the AC and CA lay-up experiment. As shown in Figure 17, the AC lay-up has higher formability than the CA lay-up. The Cu layer plays a role as a protective layer for the Al layer with lower formability. In this method, the necking occurs with a delay in the two-layer sheet. During the two-layer sheet’s electromagnetic forming, the outer layer is under tension, and the inner layer is under compression. The tensile localization occurs with delay in the two-layer sheet when the outer layer has a higher tensile strength. The two-layer sheet’s formability increased when the Cu layer was used in the Al/Cu two-layer sheet’s outer surface. In Figure 17, the forming limit diagram of the Al/Cu two-layer sheet has more errors on the left side of diagram. On the left side of the diagram, the strain distribution is not uniform because of the workpiece’s lower width. On the right side of the forming limit diagram, the driver sheet impacts the workpiece completely, and the strain distribution is more uniform than on the left side.
Conclusion
The electromagnetic forming of Al/Cu two-layer sheet simulated, and the experimental tests were done to investigate the effect of the layer lay-up on the formability of the sheet. In summary, the following results were obtained from this study:
a. The electromagnetic pressure in the CA lay-up is 19% higher than the AC lay-up in the Al/Cu two-layer sheet’s electromagnetic forming.
b. The strain distribution is not uniform in the workpiece with low width when the driver sheet is used in the process. The driver sheet passes through the sides of the sheet.
c. The discharge voltage of necking is predicted for different geometry workpieces. There are about 5-17% errors for the dome height between the simulation and experimental results.
d. The AC lay-up has higher formability than the CA lay-up. This value has reached about 42% in W75 geometry. The Cu layer acted as a protective roll in the AC lay-up and increased the formability.
e. The forming limit diagram of AC lay-up is 25% higher than the CA lay-up.
Availability of Data and Materials
No date available for the manuscript.
Competing Interests
The authors received no financial support for the research, authorship, and publication of this article.
Funding
The authors received no financial support for the research, authorship, and publication of this article.
Authors Contributions
Milad Shabanpour is A Ph. D student of mechanical engineering at Amirkabir university of Technology, and Alireza faalhai Arezoodar is a Supervisor of Milad shabanpour.
Acknowledgements
None. No funding to declare
References
- Keeler SP (1961) Plastic instability and fracture in sheets stretched over rigid Massachusetts Institute of Technology, USA
- Gerdooei M, Dariani B (2008) Strain-rate-dependent forming limit diagrams for sheet metals. Proceedings of the Institution of Mechanical Engineers, Part B: Journal of Engineering Manufacture 222 (12): 1651-1659.
- Zhang C, Chu X, Guines D, Leotoing L, Ding J, et al. (2015) Dedicated linear–Voce model and its application in investigating temperature and strain rate effects on sheet formability of aluminum Materials & Design 67: 522-530.
- Marciniak Z, Kuczyński K (1967) Limit strains in the processes of stretch-forming sheet International journal of mechanical sciences 9 (9): 609-620.
- Marciniak Z, Kuczyński K, Pokora T (1973) Influence of the plastic properties of a material on the forming limit diagram for sheet metal in International Journal of Mechanical Sciences 15 (10): 789-800.
- Hashemi R, Karajibani E (2018) Forming limit diagram of Al-Cu two-layer metallic sheets considering the Marciniak and Kuczynski theory. Proceedings of the Institution of Mechanical Engineers, Part B: Journal of Engineering Manufacture 232 (5): 848-854.
- Karajibani E, Hashemi R, Sedighi M (2017) Forming limit diagram of aluminum-copper two- layer sheets: Numerical simulations and experimental verifications. The International Journal of Advanced Manufacturing Technology 90 (9-12): 2713-2722.
- Tseng HC, Hung C, Huang CC (2010) An analysis of the formability of aluminum/copper clad metals with different thicknesses by the finite element method and experiment. The International Journal of Advanced Manufacturing Technology 49 (9-12): 1029-1036.
- Marandi F, Jabbari A, Sedighi M, Hashemi R (2017) An Experimental, analytical, and numerical investigation of hydraulic bulge test in two-layer Al–Cu Journal of Manufacturing Science and Engineering 139: (3).
- Darabi R, Azodi HD, Bagherzadeh S (2017) Investigation into the effect of material properties and arrangement of each layer on the formability of bimetallic sheets. Journal of Manufacturing Processes 29: 133-148.
- Zahedi A, Dariani BM, Mirnia MJ (2019) Experimental determination and numerical prediction of necking and fracture forming limit curves of laminated Al/Cu sheets using a damage plasticity International journal of mechanical sciences 153: 341-358.
- Alaie A, Hashemi R, Kazemi F (2021) Investigation of forming limit diagram and mechanical properties of the bimetallic Al/Cu composite sheet at different temperatures which fabricated by explosive welding. Proceedings of the Institution of Mechanical Engineers, Part B: Journal of Engineering Manufacture 235 (1-2): 73-84.
- Kinsey B, Korkolis Y (2019) High‐Speed Forming (Electromagnetic, Electrohydraulic, and Explosive Forming). Modern Manufacturing Processes pp. 265-294.
- Pepelnjak T, Smoljanič S (2013) The impact of strain rate on sheet metal formability at room RMZ–M&G 60: 3-8.
- Correia J, Siddiqui M, Ahzi S, Belouettar S, Davies R (2008) A simple model to simulate electromagnetic sheet free bulging process. International Journal of Mechanical Sciences 50 (10- 11): 1466-1475.
- Bartels G, Schätzing W, Scheibe HP, ML (2009) Comparison of Two Different Simulation Algorithms for The Electromagnetic Tube Int J Mater Form 2(1): 693-696.
- Hiping YU, I CL, Jianghua Deng (2009) Sequential coupling simulation for electromagnetic–mechanical tube compression by finite element analysis. Journal of Materials Processing Technology 209 (2): 707-713.
- Johnson GR, Cook WH (1983) A constitutive model and data for metals subjected to large strains, high strain rates and high temperatures. In: Proceedings of the 7th International Symposium on Ballistics, The Netherlands 1: 541-547.
- Javadi M, Tajdari M (2006) Experimental investigation of the friction coefficient between aluminium and Materials Science-Wroclaw- 24 (2/1): 305.
- Daehn GS (2006) High-velocity metal Metalworking: Sheet Forming (ASM Handbook Volume 14B) 14: 405-418.


-

Mark E Smith
Bio chemistry
University of Texas Medical Branch, USA -

Lawrence A Presley
Department of Criminal Justice
Liberty University, USA -

Thomas W Miller
Department of Psychiatry
University of Kentucky, USA -

Gjumrakch Aliev
Department of Medicine
Gally International Biomedical Research & Consulting LLC, USA -

Christopher Bryant
Department of Urbanisation and Agricultural
Montreal university, USA -

Robert William Frare
Oral & Maxillofacial Pathology
New York University, USA -

Rudolph Modesto Navari
Gastroenterology and Hepatology
University of Alabama, UK -

Andrew Hague
Department of Medicine
Universities of Bradford, UK -

George Gregory Buttigieg
Maltese College of Obstetrics and Gynaecology, Europe -

Chen-Hsiung Yeh
Oncology
Circulogene Theranostics, England -
.png)
Emilio Bucio-Carrillo
Radiation Chemistry
National University of Mexico, USA -
.jpg)
Casey J Grenier
Analytical Chemistry
Wentworth Institute of Technology, USA -

Hany Atalah
Minimally Invasive Surgery
Mercer University school of Medicine, USA -

Abu-Hussein Muhamad
Pediatric Dentistry
University of Athens , Greece
