


Lupine Publishers Group
Lupine Publishers
ISSN: 2641-6921
Review Article(ISSN: 2641-6921) 
Metal Chemosensors, Its Classification and Application Volume 4 - Issue 5
Received: November 8, 2021; Published: November 22, 2021
*Corresponding author: Hayat Ullah, Department of Chemistry, University of Okara, Okara-56300, Punjab, Pakistan
DOI: 10.32474/MAMS.2021.04.000200
Abstract
Sensors play an important role in detection of various cation, anions and neutral molecules in chemical and biological samples and have found much interest in the three decades. The sensors bind with analyte species, which lead to change in electron density on sensor molecules and cause changes in its signals or color. Varieties of chemical sensors are used including cationic and anionic and neutral molecules sensors. Molecular recognition and molecular transduction take place in chemical sensing. Generally, a chemosensors consist of three parts, receptor which is binding site, unit whose properties change with binding and spacer.
Keywords: Chemosensors; Application of chemosensors; Classification of chemosensors
Introduction
A Chemosensors is a substance capable of changing color or
signal in absorption or emission spectra in the presence of certain
specific species with definite concentration which indicate its
presence or absence. The information is obtained in the form of a
measurable physical signal that is linked with the certain chemical
species concentration called analyte [1]. The chemosensors may be
broadly classified into two categories.
1. Cation’s sensors
2. Anion’s sensors
Cation Sensors
Optical cation sensing was initially started for metal ions not
having its own spectra in the visible region, has been broadly
studied. With the better understanding of host-guest chemistry of
crown ethers, it became easier to develop chromogenic sensors for
metal ions. Later many outstanding examples of chromophoric and
fluorophoric receptors for different cations have been prepared
and studied.
I. Chromogenic cation sensors: The chromogenic cation
sensors may be grouped into three broad categories [2].
a. Chemosensors for photometry in organic media: These
chemosensors mostly function in organic media only. This class
includes neutral and few protonic moiety dependents on their net
charge when form complex with metal ions. In neutral chemosensors
the net electronic charge transfer from the donor to acceptor end
inside chromophore. In these chemosensors both intermolecular
and intramolecular electron donor acceptor interactions involve,
causing metal induced bathochromic or hypochromic spectral
shifts. Thus the metal binding with chemosensor affects the
electronic state (ground and excited) of chromophore with
respect to the corresponding electronic state of the un-complex
chromophore. In protonic chemosensors, various functionality like
azophenol, nitro phenol having acidic protons play vital role in the
chemosensor skeleton.
b. Chemosensors for extraction photometry: In this class
anionic type chemosensors are mostly involve having protondissociable
group which is a part of the chromophore. These
chemosensors interact with metal ions which are shown in the
form of optical properties. If the singly charged anion is produced
upon deprotonating, then it gives charge-neutralized complex with
monovalent metal ion which is from aqueous solution extractable
to a water-immiscible organic solvent. Occasionally receptors have
two anionic side arms results in divalent metal ions molecules extraction. The potential of these chemosensors are greatly affected
by the steric orientation of the anionic group and hollow of the
receptor to put up the specific metal ion.
c. Chemosensors for photometry in aqueous media: These
chemosensors are specifically designed in aqueous media for metal
photometry, instead of using lethal and volatile organic solvents
as well as phase separation step which is required in extraction
photometry.
II. Fluorogenic cation sensors: Large number of fluorescent
signaling systems manipulating the photo induced intramolecular
electron transfer (PET) mechanism for metal ions detection are
reported. These sensor are planned in such a way to covalently
link fluorophores with electron donating atoms of acyclic or macro
cyclic receptors. The binding site in the receptor contributes a lone
pair of electron to the excited fluorophore through PET and as
result the excited fluorophore comes to the ground state by a nonradiative
pathway, trigger quenching of fluorescence. The metal ion
takes this lone pair through bonding; the PET is blocked, resulting
in the recovery of fluorescence. A system with fluorescent on/
off ability can possibly act as a molecular photonic switch, which
is the utmost significant component of any true photonic device.
Keeping in view the above techniques, some admirable receptors
for numerous analytes have been prepared and checked for use in
medical diagnostics, physiology and in environmental chemistry.
Some chromogenic receptors based on crown ethers [3], podands,
calixarenes, thiacalixarenes and azacrown-calixarenes have been
also reported [4,5] (Figure 1).
Figure 1: Schematic diagram showing mechanism of ion recognition by fluorescent PET sensors.

Anion Sensors
The chromogenic anion sensors may be generally divided into
two main classes, following the classification put forth by both P. A.
Gale [6] and Tuntulani et al., [7].
i. Metal and Lewis acid based chromogenic hosts
ii. Nonmetal based chromogenic hosts
(I) Metal and Lewis acid based chromogenic hosts: In metal
involved chromogenic hosts, the color change comes from either
the color of metals or metal complexes, particularly transition metal
ions, whose electronic behavior are altered upon coordination
with anions. The anions possibly will also remove the coordinated
chromophore to give a colorimetric response. Also, coordination
aspects, the color change can came from reactions of chromogenic
hosts or indicators and anions. Such chromogenic anion sensor
can also be called a “chromoreactant”. When a reaction occurs,
the conformed host will certainly change its electronic properties,
which results in an observable color change. The role of the metal
ions in these receptors may be either it acts as non- coordinating
moiety but changing its physical properties in the presence of anion,
coordination site for the anions or as an electron withdrawing
component in a system so as to enable attack of anion on it [8-10].
Several outstanding reviews are also available in the literature on
metal ion based anionic sensors [11-15].
(II) Nonmetal based chromogenic hosts: Anion sensors based
on nonmetal chromogenic hosts use H-bonding and/or electrostatic
interactions for carrying out the job. Limiting here to this group
of anion sensors, numerous such systems have been reported
like amide [16], pyrrole [17,18], urea and thiourea [19,20], azo
dye [21], naphthalene and naphthalimide [22], porphyrin units
having neutral hosts [23], ammonium and polyammonium [24],
guanidinium, or thiouronium [25] possessing cationic hosts.
Several outstanding reviews on fluorogenic/chromogenic are also
available in the literature [26], on guanidinium [27], calixarene [28]
and urea based receptors. In these neutral or positively charged
receptors, the polarized N-H part behaves as H-bond donors to
anions. Neutral ligands donate the loan pair of electrons to metal
and neutral receptors give H-bonds to the anion. Consequently,
metal-ligand complex formation can be studied in any solvent,
which make sure solubility of the reactants. This study is preferably
performed in aprotic media in order to evade competition for the
anion through H-bonding in solvents. The recognition process
in these cases normally involves either H-bonding or completes
deprotonating of -N-H protons or a stepwise process starting from
H-bonding to dissociation of proton [29]. In some cases it involes in stepwise deprotonation of two protons, without the intermediate
step related to the H-bonding. As suggested by Fabbrizzi et al. in
this host-guest complexation, subsequently following equilibria
may take place in solution, comprising a neutral receptor LH2 and
the anion X [30].
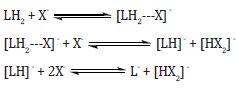
Here the first step relates to a H-bonded complex and in the second step abstraction of a proton from the complex involves to give a mono deprotonated derivative LH¯ which might give further fully deprotonated L according to step-3 at greater concentrations of the anion. The incidence of de-protonation is greatly reliant on the inherent acidity of LH, [HX2] ¯ stability and the solvent polarity. Still it is an effective and sensitive technique of anion sensing [31]. The variety of nanoparticles has been reported in literature for the sensing of various metal ions. Here in this study we focus only on various type of gold nanoparticles interaction with metal ions.
Glutathione-Protected Fluorescent Gold Nanoclusters
Figure 2: (A) Fluorescence response of 0.05 mg/mL GS-Au NCs upon addition of different concentrations of Cu2+ solution. (B) Linear relationship between F0/F and the concentration of Cu2+.

Figure 3: (A) and (B) Effect of different metal ions on the fluorescence of GS-Au NCs in PBS buffer (pH 7.0).

The glutathione (GS)-protected Au nanoclusters (GS-Au NCs) has been reported as a novel fluorescent probe for copper ion (Cu2+) detection. The sensing behavior of GS-Au NCs toward metal ions beed buffered aqueous media. The Cu2+, Hg2+ and Pb2+ metal ions were establish to quench efficiently the GS-Au NCs fluorescence emission upon studying various metal ions. This nanocluster have the ability to differentiate among these metal ions. The Cu2+and Hg2+ (or Pb2+), It was observed that in the presence of Pb2+, the GSAu NCs solution first appeared turbidity, but with ethylene diamine tetraacetate added to the solution, the fluorescence recovered and the turbidity vanished; in the presence of Hg2+, EDTA could not recover the quenched fluorescence of GS-Au CNs by Hg2+, which is in contrast with Pb2+ and Cu2+. The Cu2+limit of detection was approximately 86 nM based on the fluorescence quenching and linear fluorescence response in the Cu2+ concentration. The high sensitivity and selectivity toward Cu2+ among various metal cations make GS-Au NCs a good candidate for fluorescent sensors of Cu2+ + ions [32]. The fluorescence sensing experiments of GS-Au NCs toward Cu2+ were also examined for pH effect and pH 7.0 was found to be optimum (Figure 2A). The quenching in the presence of Cu2+ can be recognized due to complexation between the GS-ligands of the GS-Au NCs and Cu2+ ions (Figure 2B). The fluorescence sensing selectivity for Cu2+, Hg2+ and Pb2+, among seventeen kinds of metal ions such as Zn2+, Hg2+, Cu2+, Fe3+, Co2+, Na+, K+, Ag+, Li2+, Pb2+, Ba2+, Ca2+, Mn2+, Cr2+, Ni2+, Mg2+ and Cd2+ were confirmed by UV and florescence spectrophotometry (Figure 3A,B) Table 1.
Table 1: The coexistence ion effect on the sensing of Cu2+

Gold Nanoparticles having Fluorescent Cysteine- Coumarin Probes
Emissive molecular probes based on amino acid moieties are very attractive due to their use as new building blocks in peptide synthesis [33]. The coumarin probes (1 and 2) were synthesized and fully characterized. Their sensing capacity toward alkaline earth, transition, and post-transition metal and their acid base behavior (H+, OH) were explored by absorption and fluorescence spectroscopy in absolute ethanol. Compound 1 displays a strong complexation constant with the soft metal ions Cd2+, Zn2+, and Ag+. Compound 2 shows a great fluorescence quantum yield, and it might be used as a non pH-dependent fluorescent probe (Figure 4). Gold nanoparticles having compounds 1 and 2 as stabilizers were got by using a reductive method and were characterized by UV-vis, TEM and light scattering. The new stable Cou@AuNPs acted as supramolecular chemosensors, selective for Hg2+, with a simultaneous change of color from pink to dark red/brown [34]. The sensorial ability of both compounds toward Ca2+, Cu2+, Zn2+, Cd2+, Hg2+, Ni2+, Ag+, and Al3+metal ions were examined. Both compounds do not show any photo-physical changes under acidic conditions, but in basic media show an intense emission quenching of fluorescence emission. This is possibly due to the of the amine group deprotonation, which produces a photo-induced electron transfer (PET) process from the lone pair of electrons located in the nitrogen atom to the excited chromophore (Figure 5). The addition of metal ions to compound 1 in absolute ethanol does not change the ground state, but on the contrary, the excited state is quenched by metal ions like Zn2+, Cd2+, Ag+, and Hg2+ (Figure 6). Though, in other metals studied, the quenching was smaller. One of the possibilities is that in the ground state the metal ion is interacting with the amino acid unit far from the chromophore, and then altering its position after the irradiation for the carbonyl of the lactone in the excited state, making a quenching in the fluorescence emission [35,36] (Scheme-1).
Figure 4: Structure of Compounds 1 and 2.

Figure 5: Spectrofluorimetric titration of compound 1 with the addition of OH- in absolute ethanol.

Figure 6: Spectrofluorimetric titration of compound 1 in the presence of Zn2+ (A), Cd2+ (B), Ag+ (C), and Hg2+ (D) in absolute ethanol and in the presence of Ag+ (E) in a mixture of water/absolute ethanol (80:20).

Scheme 1: Coordination Proposed for Zn2+, Cd2+, and Ag+ Ions with Compound 1

The stoichiometry of each metal complex was predicted by the Job’s plot in which one metal ion is coordinated by 4 equal of 1. As an example, (Figure 7) shows the absorption and emission of 2 in the presence of Ni2+ and Al3+. The addition of Ni2+ or Al3+ (Figure 7 A, B) produces a decrease in the absorption spectrum with a concomitant appearance of a new shoulder or band. This band appears due to the participation of the carbonyl group in complexation [37]. Comparing both coumarin derivatives, 1 and 2, we can conclude that 1 is more affected by the metal ion complexation than 2. This fact can be observed in the column graph reported in (Figure 8).The AuNPs coated with compounds 1 and 2 were obtained by the Brust methodology on the basis of the reduction with NaBH4 (Scheme 2) [38]. The formation of the nanoparticles can be observed because of the appearance of the gold plasmonic resonance band at 520 nm and because of the change in color from orange to red. These AuNPs were not emissive because the luminescence of the coumarin was totally quenched by the gold metal core. The size of 1 and 2 nanoparticles of ca. 3.3 (1.1 nm and ca. 2.6 (1.2 nm, respectively, was measured by DLS. To explore the potential application of these functionalized small stable gold nanoparticles (AuNPs) as chemosensors for toxic, heavy, and soft metal ions Hg2+, Cd2+, Zn2+, and Ag+, several metal titrations were performed following the modifications in the surface plasmonic resonance band (SPRB) [39]. Only in the case of mercury (II) was an effect observed. The addition of Hg2+ showed a color change from pink to dark red/ brown in both systems (Figure 9), as well as an increase of 100-fold in the nanoparticle size, raising the AuNPs aggregation.
Figure 7: Spectrophotometric and spectrofluorimetric titration of compound 2 in the presence of Ni2+ (A), (B); Al3+ (C), (D);

Figure 8: Normalized fluorescence of compounds 1 (A) and 2 (B) in the presence of H+, OH-, Ca2+, Zn2+, Cd2+, Cu2+, Ni2+, Hg2+, Ag+, and Al3+ in absolute ethanol.

Scheme 2: General Synthetic Pathway for Gold Nanoparticles with 1

Figure 9: Naked-eye detection of Hg2+ by AuNPs 1 and after titration with Hg2+ in dichloromethane.

The spectrophotometric titration with Hg2+ for AuNPs with compound 1 and 2. On the basis of the Lambert Beer law and the extinction molar coefficient at 330 and 435 nm for free 1 and 2, respectively, it was possible to determine the approximate concentration of the ligands around each nanoparticle and the concentration of the Hg2+ ions. The absorption as a function of the number of Hg2+ equivalents necessary to stabilize the system (Figure 10). An inspection shows that for the AuNPs 2, 2 equiv of Hg2+ are necessary, instead of the 5 equiv for the AuNPs 1. The AuNPs 2 is more sensitive to mercury (II) than AuNPs 1 [40-43] Scheme 3.
Figure 10: (A) Absorption spectrum of AuNPs with compound 1 (full line) and 2 (dotted line). Spectrophotometric titration of AuNPs with compounds 1 (B) and 2 (C) with the addition of Hg2+ ions in dichloromethane. ([1] = 1.24 × 10⁻⁵ M, [2] = 6.35 × 10⁻⁶ M, [Hg2+] = 6.01 ×10⁻³ M, room temperature).

Scheme 3: basic design of our sensor system for Hg2

Colorimetric Detection of Mercury (Hg2+) Using DNA/Nanoparticle Conjugates
A novel and practical system for colorimetric detection of mercury at room temperature. The system utilizes a combination of oligonucleotides and NPs at low concentrations, which readily detects Hg2+ in aqueous solutions and in the presence of an excess of other metal ions [44]. The method can be rationalized for use to detect other metal ions by replacing natural DNA bases with metaldependent synthetic artificial bases [45]. To achieve this goal, a fundamentally different design was taken, making use of DNA/ NP conjugates and thymine-Hg2+-thymine (T-Hg2+-T) coordination chemistry [46] to develop a sensor system that operates within an adjustable operating temperature range and rapidly detects mercury in a single step. The basic design of our sensor system for Hg2+ is composed of three elements as shown in (Scheme 3). Two types of DNA-functionalized gold NP probes [47] (designated as probe A, Au-3ʹS-ATGCTCAACTCT5ʹ, and probe B, Au-5ʹSCGCATTCAGGAT3 ʹ), and an appropriate oligonucleotide linker (designated as probe C). To choose a specific sequence for the probe C, one has to ensure that it recognizes the particle probes A and B and forms stable DNA duplexes (or NP aggregated networks) only in the presence of Hg2+ at a given operating temperature. In the absence of Hg2+, these three probes do not form DNA/NP aggregates because of a lower melting temperature (Tm) than the operating temperature due to mismatches formed in the DNA duplexes. Importantly, by controlling the number of T-T mismatches in the system, one can precisely modulate the melting temperature of the three probes within a specific range. To this regard, it has been studied temperature profiles using UV-vis spectroscopy for a series of probe solutions containing oligonucleotide linkers (probes C1- 7) that are complementary to probes A and B except for various numbers of the T-T mismatch. As anticipated, melting temperatures of the probes A, B, and C1-7 were decreased from 50.3, 48.6, 40.0, 34.2, 26.2, 22.8, to 21.3°C with an increasing number of T-T mismatches. It should be noted that the melting temperature of the probes can be further suppressed well below the operating ambient temperature (23°C) with a solution containing eight T-T mismatches (probes A*, B, C7; Tm ) 14.4°C) as shown in (Figure 11).
Figure 11: Normalized melting curves of solutions containing probes A (or A*), B and the linker probes C1-7 with varied numbers of T-T mismatches.

As a proof-of-concept experiment, an aqueous solution of
Probes A, B, and C7 (2 nM, 2 nM, and 1 μM, respectively; Tm)
21.3°C) was selected for a prototype sensor system for Hg2+ at
room temperature. Upon addition of an aqueous solution of Hg2+
(10 μM), a clear red-to-purple/pinkish colorimetric response
occurred within 5 min (Figure 12a). The particle-amplified color
change indicates formation of stable Hg2+-mediated DNA base pairs
as evidenced by an increase in the sharp melting temperature
(42.4°C) shown in (Figure 12c). The UV-vis spectrum of the solution
also shows a bathochromic shift of the gold nanoparticles from 520
to 565 nm, indicating the formation of particle aggregates via Hg2+
induced hybridization events. The NP aggregates were confirmed
by transmission electron microscopy in contrast to dispersed NPs
in the absence of Hg2+. To exclude the possibility that Hg2+ may
directly remove the thiolated oligonucleotides from the surface of
the particles because of its thiophilic nature [48], we performed
control experiments without the oligonucleotide linker (probe
C7). Upon addition of various concentrations of Hg2+ (10, 50, and
100 μM), we did not observe visible color changes (or particle
precipitation) over a period of time of 48 h (Figure 12a, Blank2).
Taken together, these observations suggest that the rapid assembly
of the nanoparticles at ambient temperature is indeed attributed to
the formation of stable T-Hg2+-T base pairs in DNA duplexes.
In a further set of experiments, selectivity of metals ions was
studied. Solutions containing metal ions (Co2+, Pb2+, Ni2+, Cu2+, Ca2+,
Mn2+, Sn2+, Zn2+, Ru3+and Fe3+; each at 10 μM) were tested under the
same conditions as in the case of Hg2+. Remarkably, no optical and
thermal transition profile changes of the solutions were observed
with these metal ions up to millimolar concentrations (Figure 12a).
Figure 12: (a) Color response of a 14 nm NP detection system (probes A, B, and C7) in the presence of a selection of metal ions (Hg2+, Cu2+, Ca2+, Fe3+, Mn2+, Sn2+, Zn2+; 10 μM each). Note that Blank1 (probes A, B, and C7 without Hg2+) and Blank2 (probes A and B with Hg2+) were used as control references. (b) Color response of a 30 nm NP detection system under the same conditions. (c, d) Normalized melting curves of the solution (containing probe A, B, and C7) with or without Hg2+ (10 μM) for the 14 and 30 nm NP systems, respectively.

The specific detection for Hg2+ is clearly attributed to its
selective binding of T-T mismatches, resulting in the formation of
stable T-Hg2+-T complexes that lead to particle aggregation. We have
also investigated the sensitivity of our detection system. Various
concentrations (0.5, 1.0, 2.0, 3.0, 5.0, 10, 25, and 50 μM) of Hg2+
were added to a series of solutions containing 14 nm NP probes
(A and B; each at 2 nM) and the oligonucleotide linker (probe C7;
1 μM). The corresponding melting temperatures were measured
at 21.8, 22.3, 22.9, 24.8, 28.3, 42.4, 47.5, and 50.0 °C, respectively.
The limit of detection for the 14 nm NP systems by the naked eye
is about 3 μM of Hg2+.However, the sensitivity of the system can
be further improved (1μM) by using larger particles or varying
oligonucleotide sequences on the surface of the nanoparticles.
For example, upon addition of Hg2+ (10 μM) to a solution
containing 30 nm particles, an enhanced color change can be
readily observed (Figure 12b). The signal enhancement of the 30
nm NP system was attributed to significant extinction dampening
in the plasmon region of the spectrum that accompanies Hg2+-
induced NP aggregation. In contrast to the 14 nm NP counterpart, a
larger melting transition (e.g., 27 versus 21 °C with 10 μM of Hg2+)
was observed for the 30 nm NP solution between the dispersed and
aggregated states (Figure 12d).
Colorimetric And Fluorometric Chemosensors For Selective Signaling Toward Ca2+ And Mg2+ By Aza- Crown Ether Acridinedione-Functionalized Gold Nanoparticles
Figure 13: Structure of aza-crown ether acridinedione-functionalized gold nanoparticles (ACEADD-GNPs) 3

The aza-crown ether acridinedione-functionalized gold
nanoparticles (ACEADD-GNPs) 3 have been synthesized and
investigated as a fluorescent chemosensor for metal ions. A blue
shift along with an intensity enhancement of emission and color
change are observed in the presence of both Ca2+ and Mg2+
ions. The enhanced fluorescence intensity is attributed to the
photoinduced electron transfer (PET) suppression through space
and color change of the suspension from red to blue due to shifted
surface plasmon resonance (SPR) with aggregation of nanoparticles
by the sandwich complexation (Figure 13) [49]. Aza-crown ether
acridinedione-GNPs exhibit the absorption spectrum of ACEADDGNPs
(3) that consists of two bands: (i) the additive absorption
spectrum of ACEADD due to ICT around 360 nm and (ii) a broad
band in the visible region around 529 nm, which is attributed
to the surface plasmon resonance (SPR) for the stabilized gold
nanoparticles. Crown ethers are known for the unusual property
of forming stable complexes with alkali metals. The exceptional
stability correlates, to some extent, with the close fit of the cation to
the crown cavity where, upon complexation, the oxygen atoms lie
in a nearly planar arrangement about the central cation. Although
15-crown-5 complexes best with Na+ and 18-crown-6 favors K+, a
sandwich complex of 2:1 between 15-crown-5 and K+ is also well
known [50–58].
Interestingly, addition of Na+ and K+ ions did not alter the
absorption or emission properties of (3). In contrast, on the addition
of Ca2+ or Mg2+ ions (0–9.6 × 10⁻⁵ M), the acetonitrile solution of 6
(2.5 × 10⁻⁵ M) showed a red shift in the absorption maximum. The
significant change in the color visible to the naked eye demonstrates
that the ACEADD-GNPs recognize Ca2+ and Mg2+ and lead to the nano
aggregation (Figure 14). A highly specific, for both Ca2+ and Mg2+
ions, binding event is achieved by the cation-induced sandwich-like
structure of the aza-crown ether acridinedione-GNPs Scheme-4 and
the resultant nano-Au aggregation through colorimetric response
that is indicated by broadening and red shifting of surface plasmon
resonance peak as reported by Patel et al [59] and Lin et al [60].
The ACEADD-capped gold nanoparticle’s colloidal solution
appears red (Figure 15). However, upon addition of Ca2+ and
Mg2+ the solution immediately turns blue. The significant change
in color demonstrates that the ACEADD-GNPs recognize Ca2+ and
Mg2+. Surprisingly, a pronounced blue shift along with an intensity
enhancement of the ACEADD-GNPs emission was observed for (3)
in the presence of Ca2+ and Mg2+. An intensity maximum is reached
at [M2+]/4 = 2.5 × 10⁻⁵ M, and the emission maximum shifts as
much as 40 nm (from 440 to 400 nm), when excited at 360 nm as
shown in (Figures 15,16). The corresponding additive absorption spectrum of ACEADD is not affected but SPR peak is shifted. The
spectral features of blue shifted and intensity enhanced emission
are retained, albeit to a lesser extent, and requiring a higher ratio
of metal ion concentration. With lower concentration of metal ion,
the emission maximum is at 420 nm. The kmax continues to shift
toward blue upon further addition of Ca2+ or Mg2+ (e.g. kmax = 400
at [M2+]/4 = 2.5 × 10⁻⁵ M). Apparently, the interactions between 3
and metal ions are weak and the ACEADD-GNPs emission indicates
a symmetrical sandwich-like structure; the blue shifted form is
generally attributed to partially overlapping crown ether moiety
of ACEADD, which might account for the weak emission of blue
shifted ACEADD-GNPs and poor sensitivity of the ACEADD emission
to the ground state structure. Accordingly, the binding of Ca2+ or
Mg2+ in (3) not only brings the crown group together in the ground
state leading to the formation of a sandwich but also prohibits or
minimizes such a relaxation event in the excited state leading to a
blue shifted emission. The enhancement in fluorescence intensity
is attributed to the suppression of the PET process through space.
Addition of other metal ions such as Na+, K+, Sr2+ and Ba2+
showed only marginal changes to the d emission of (3), when
compared to those with both Ca2+ and Mg2+ ions.
Figure 14: The absorption spectra of 6 upon addition of Ca2+ and Mg2+ in acetonitrile.

Scheme 4: The possible mechanism of the phenomenon of binding of the free ACEADD-GNPs with Ca2+ and Mg2+.

Figure 15: Colorimetric responses of ACEADD-GNPs colloidal solutions appear red. However, upon addition of Ca2+ (9.6 × 10⁻⁵ M) and Mg2+ (9.6 × 10⁻⁵ M) the solution immediately turns blue. Addition of other metal ions did not affect the color change.

Figure 16: The emission (kex = 360 nm) spectra of 3 upon addition of Ca2+ (0–9.6 × 10⁻⁵ M) in acetonitrile.

Colorimetric Chemosensors To Metal Nanoparticles Using Two New Tyrosine Schiff-Base Ligands For Cu2+ Detection
Two new tyrosine Schiff-base ligands 4 and 5 bearing an indole or a thianaphthene moiety were synthesized. The sensing ability towards Ca2+, Zn2+, Cd2+, Cu2+, Ni2+, Hg2+ and Al3+ metal ions was explored in absolute ethanol. Both compounds showed colorimetric properties in the presence of Cu2+ ions, changing their colour from light yellow to purple (4) and dark pink (5). The minimal amount of Cu2+ that compounds 4 and 5 could quantify was ca. of 8 ppm. In order to obtain new nanomaterials based on the reported systems, new gold and silver nanoparticles were successfully synthesized by self-reduction of compound 4 in an aqueous alkaline environment. A size distribution with a peak almost symmetrically centered on 12 ± 3.5 nm for AgNPs, and a distribution quite asymmetrical with an average size of 7.50 ± 6 nm for AuNPs were determined by TEM images. In the case of gold nanoparticles the poly disperses distribution suggested some nanoparticle aggregation [61]. The sensing ability of compounds 4 and 5 were carried out in the presence of Ca2+, Zn2+, Cd2+, Cu2+, Ni2+, Hg2+ and Al3+ in absolute ethanol solutions. Compound 4 presented spectral changes only in the presence of Zn2+ and Cu2+.(Figure 17) presents the spectral behavior of compound 5 with the addition of Zn2+ metal ion. The addition of Zn2+ induces a small decrease in the absorption band at 300 nm, and a red shift from 350 to 378 nm, with an isosbestic point at 369 nm. The appearances of an isosbestic point at 369 nm means that there are two different species in equilibrium. The complexation constant observed was logK1-1 = 5.110 ± 0.002, suggesting the formation of the mononuclear complex. Based on Pearson’s rule and the spectral modifications, the interaction of the metal ion probably occurs between the nitrogen donors atoms presented in the molecule [62]. Compound 5 shows similar results with Zn2+ and Cd2+, which can be seen in (Figure 18 A), which shows the spectrophotometric titration in the presence of Zn2+. On a careful inspection of (Figure 18 A), with the increase of Zn2+ ions, a decrease in the absorption at 300 nm is observed, followed by the appearance of band at 350 nm with an isosbestic point at 330 nm.
Figure 17: The emission (kex = 360 nm) spectra of 3 upon addition of Mg2+ (0–9.6 × 10⁻⁵ M) in acetonitrile.

Figure 18: Structure of tyrosine Schiff-base ligands 4 and 5

Similar results were observed for compound 4. The complexation constant for both metal ions, Zn2+ and Cd2+ was very similar, logK1-1 = 5.256 ± 0.002 for Zn2+ and logK1-1 = 5.253 ± 0.002 for Cd2+, which suggests that the complex formation involves the same donor atoms. The addition of Ca2+ to compound 5 (Figure 19 B) only produces a small quenching in the absorption at 300 nm, without the band formation at 350 nm. The formation constant has a stoichiometry metal: ligand 1:2, log K = 11.29 ± 0.01, leading us to the formation of a different complex, involving two ligands. This result suggest that compound 5 forms more stable metal complexes with Ca2+ than with Zn2+ and Cd2+. Due to the presence of a sulphur atom, we also explore compound 5 for mercury (II) ions (see Figure 20). Addition of increased amounts of metal-salt in absolute ethanol induces to a red shift in the absorption band of 16 nm, and the appearance of a new band at 375 nm, corresponding to the complex stoichiometry metal: ligand 1:1, with a formation constant, of logK1-1 = 2.978 ± 0.01. According, to Pearson’s law [62] the interaction within the metal ions probably involves the sulphur donor atom. A colorimetric chemosensor can be described by 4 and 5 in the presence of copper (II) ions [63, 64]. Electronic transitions, such as, charge transfer and d–d transitions might occur in compounds with transition metal ions developing optical ways for sensing. Thus, if a charge transfer transition occurs, an electron of a ligand orbital interacts with another orbital centered in the metal, giving rise to a ligand–metal charge transfer (LMCT) transition, resulting in a coloured complex [65].
Figure 19: Spectrophotometric titration of compound 4 with the addition of Zn2+ in absolute ethanol ([4] = 1.14 × 10⁻⁵ M, T = 298 K).

The complexation constants in both cases were calculated using HypSpec [66] obtaining a logK1-1 = 3.06 ± 0.01 for compound 4 and a logK1-1 = 4.269 ± 0.001 for 5. In comparison, compound 5 shows the strongest value for Cu (II). Based on the tyrosine properties, which are easily oxidizing [67], and on the unfiled d orbital of Cu2+, a LMCT band is formed for 4 at 530 nm and for 5 at 510 nm. Due to the change of colour and in metal complexes of tyrosine reported on literature, the copper (II) metal ion coordination could involve the oxygen and nitrogen donor atoms of tyrosine [68]. The detection (LOD) and quantification (LOQ) limits were determined in absolute ethanol. For compound 4 the values at 530 nm were of 0.006 ± 0.001 (LOD) and of 0.010 ± 0.001 (LOQ); and for compound 5 the values at 510 nm, were of 0.005 ± 0.001 (LOD) and of 0.009 ± 0.001 (LOQ). Taking into account these results, the minimal amount of Cu2+ that might be sensed in absolute ethanol is ca. 8 ppm. Several in situ copper (II) titrations were performed using compound 4 by MALDI-TOF-MS without any other external organic matrix, using the layer by layer technique [69], where a drop of metal ion containing one equivalent was added over the dried ligand spotted on the MALDI-TOF-MS plate (1 μg/ml). The interaction between compound 4 and Cu2+ shows peaks corresponded to the complex species [(4) Cu(BF4)2]+ at 676.5 (676.0) and [(4) 2(Cu(BF4)2) .CH3CN]+ at 954.5 (954.0), which confirms the Complexation of 5 by the one and two Cu2+ metal ions in the gas phase. The formation of AuNPs was indicated by the appearance of dark red color and of the gold plasmonic band at 520 nm; and the AuNPs by the appearance of a yellow colour and a surface Plasmon resonance at 415 nm (Figure 21,22). Moreover, several studies of absorption and emission spectroscopy were performed, with the aim to confirm the anchoring of the compound 4 to the metal nanoparticle surface. The resulting nanoparticles were extracted three times with dichloromethane to remove the unlinked products.
Figure 20: Spectrophotometric titration of compound 5 (A and B) with the addition of Zn2+ (A) and Ca2+ (B) in absolute ethanol ([5] = 9.53 × 10⁻⁶ M, T = 298 K).

Figure 21: Spectrophotometric titration of compound 5 with the increased addition of Hg2+ in absolute ethanol. The inset shows the absorption as function of [Hg2+]/ [2] at 375 nm ([5] = 9.53 × 10⁻⁶ M, [Hg2+] = 9.22 × 10⁻³ M, T = 298 K).

Figure 22: (Below, left) Schematic structure of the MNPs with compound 4. (Below, right) Absorption spectra of MNPs (aqueous phase), in water, T = 298 K.

References
- Bǎnicǎ, Florinel-Gabriel (2012) Chemical Sensors and Biosensors: Fundamentals and Applications. Chichester, John Wiley & Sons, UK, 576.
- Takagi M (1990) “Cation Binding by Macrocycles,” Eds. Inoue Y, Gokel GW, Dekker. New York 465.
- Kaneda T, Umeda S, Tanigawa H, Misumi S, Kai Y, et al. (1985) Am Chem Soc 107: 4802.
- Kubo Y, Maruyama S, Ohhara N, Nakamura M, Tokita SJ (1727) Chem. Soc Chem. Commun 1727.
- Oueslati F, Dumazet-Bonnamour I, Lamartine R (2003) New J Chem 27: 644.
- Gale PA, Coord Chem Rev (2003) 240: 191. (b) Gale, P. A. Coord. Chem. Rev (2001) 213: 79.
- Suksai C, Tuntulani T (2003) Chem Soc. Rev 32: 192.
- Cabell LA, Best MD, Lavigne JJ, Monahan MK, Anslyn EVJ (2001) Chem Soc Perkin Trans 2: 315.
- Shihadeh YA, Benito A, Lloris JM, Martínez-Máñez R (2005) Inorg. Chem. Commun 3: 563.
- Gale PA, Hursthouse MB, Light ME, Sessler JL, Warriner CN, Zimmerman RS (2001) Tetrahedron Lett 42: 6759.
- Dos Santos CMG, Harte AJ, Quinn SJ, Gunnlaugsson T (2008) Coord. Chem. Rev 252: 2512.
- Wong KMC, Yam VWW (2007) Coord. Chem. Rev 251: 2477.
- Beer PD, Bayly SR (2005) Top1. Curr. Chem 255: 125.
- Beer PD, Hayes, EJ (2003) Coord. Chem. Rev 240: 167.
- Sun SS, Lees AJ (2002) Coord. Chem. Rev. 230: 171.
- Bondy CR, Loeb SJ (2003) Coord. Chem. Rev 240: 77.
- Sessler JL, Camiolo S, Gale PA (2003) Coord. Chem. Rev. 240: 17.
- Bucher C, Zimmerman RS, Lynch V Sessler JL (2001) J. Am. Chem. Soc 123: 9716.
- Amendola V, Esteban-Gomez D, Fabbrizzi L, Licchelli M (2006) Acc. Chem. Res 39: 343.
- Gunnlaugsson T, Davis AP, Glynn M (2001) Chem. Commun 2556.
- Lee DH, Lee KH, Hong JI (2001) Org. Lett 3: 5.
- Cho E J, Moon JW, Ko SW, Kim SK, Yoon J, Nam KC J (2003) Am. Chem. Soc125: 12376.
- Starnes SD, Arungundram S, Saunders CH (2002) Tetrahedron Lett 43: 7785.
- Gerasimchuk OA, Mason S, Llinares JM, Song MP, Alcock NW, et al. (2000) Inorg. Chem 39: 1371.
- Camiolo S, Gale PA, Light ME, Hursthouse MB Supramol (2001) Chem 13: 613.
- Gunnlaugsson T, Glynn M, Tocci nee Hussey GM, Kruger PE, Pfeffer FM (2006) Coord. Chem Rev 250: 3094.
- Houk RJT, Tobey SL, Enslyn EV (2005) Top. Curr. Chem 255: 199.
- Lhotak P (2005) Top. Curr. Chem 255: 65.
- Boiocchi M, Boca LD, Gómez DE, Fabbrizzi L, Licchelli M, et al. (2004) J. Am. Chem. Soc 126: 16507.
- Gómez DE, Fabbrizzi L, Licchelli M, Monzani E (2005) Org. Biomol. Chem. 3: 1495.
- Gunnlaugsson T, Kruger PE, Lee TC, Parkesh R, Pfeffer FM, et al. (2003) Tetrahedron Lett 44: 6575.
- Guomei Z, Yinghui L, Jie X, Caihong Z, Shaomin S, et al. (2013) Glutathione-protected fluorescent gold nanoclusters for sensitive and selective detection of Cu2+, Sensors and Actuators B 183: 583-588.
- Muhammed MA, Verma P, Pal S, Retnakumari A, Koyakutty, M, et al. (2010) Luminescent quantum clusters of gold in bulk by albumin-induced core etching of nanoparticles: metal ion sensing, metal-enhanced luminescence and biolabeling, Chemistry. A European Journal 16: 10103-10112.
- Elisabete O, Cristina N, Benito RG, Jose LC, Carlos L (2011) Novel Small Stable Gold Nanoparticles Bearing Fluorescent CysteineCoumarin Probes as New Metal-Modulated Chemosensors, Inorg. Chem 50: 8797–8807.
- Grazul, M, Budzisz (2009) E. Coord. Chem. Rev 253: 2588.
- Gans P, Sabatini A, Vacca A (1996) Talanta 43: 1739.
- Santos HM, Pedras B, Tamayo A, Casabo J, Escriche, L, et al (2009) Inorg. Chem. Commun 12: 1128.
- Sheldrick GM (1997) SHELXS97, A Computer Program for the Solution of Crystal Structures from X-ray Data; University of G€ottingen: G€ottingen, Germany.
- Pearson RGJ (1963) Am. Chem. Soc 85: 3533.
- Ke L, Yi Z, Cheng Y (2011) A highly sensitive and selective ratiometric and colorimetric sensor for Hg2+ based on a rhodamine–nitrobenzoxadiazole conjugate, Inorganic Chemistry Communications 14: 1798-1801.
- Zhou Y, Zhu CY, Gao XS, You XY, Yao C (2010) Organic Letters 11: 2566-2569.
- Shi W, Ma HM (2008) Chemical Communications 16: 1856-1858.
- Liu W, Xu LW, Zhang HY, You JJ, Zhang XL, et al. (2009) Organic and Biomolecular Chemistry 7: 660-664.
- Xue X, Wang F, Liu X (2008) One-Step, Room Temperature, Colorimetric Detection of Mercury (Hg2+) Using DNA/Nanoparticle Conjugates, J. AM. CHEM. SOC 130: 3244-3245.
- Ogawa AK, Wt Y, Berger M, Schultz PG, Romesberg FEJ (2000) Am. Chem. Soc 122: 8803.
- Katz SJ (1952) Am. Chem. Soc. 74: 2238.
- Mirkin CA, Letsinger RL, Mucic RC, Storhoff JJ (1996) Nature 382: 607.
- Cotton FA, Wilkinson G, Murillo CA, Bochmann M (1999) Advanced Inorganic Chemistry; Wiley: New York.
- Velu R, Ramakrishnan VT, Ramamurthy P (2010) Colorimetric and fluorometric chemosensors for selective signaling toward Ca2+ and Mg2+ by aza-crown ether acridinedione-functionalized gold nanoparticles, Tetrahedron Letters 51: 4331-4335.
- Xiong D, Li H (2008) Nanotechnology 19: 465502.
- Masilamani D, Lucas ME (1992) In Fluorescent Chemosensors for Ion and Molecule Recognition; Czarnik, A. W, Ed, American Chemical Society: DC Washington.
- Inoue Y, Gokel GW (1990) Cation Binding by Macrocycles: Complexation of Cationic Species by Crown Ethers; Dekker: New York.
- Bradshaw JS, Krakowiak KE, Izatt RM (1993) Aza-Crown Macrocycles; John Wiley and Sons: New York.
- Toupance T, Benoit H, Sarazin D, Simon JJ (1997) Am. Chem. Soc 119: 9191.
- Boldea A, Levesque I, Leclerc MJ (1999) Mater. Chem 9: 2133.
- Flink S, Boukamp BA, van den Berg A, van Veggel FCJM, Reinhoudt DNJ (1998) Am. Chem. Soc. 120: 4652.
- Flink S, van Veggel FCJM, Reinhoudt DNJ (1999) Phys Chem B 103: 6515.
- Kimura K, Harino H, Hayata E, Shono T (1986) Anal. Chem 58: 2233.
- Patel G, Kumar A, Pal U, Menon S (2009) Chem. Commun 1849.
- Yi Lin, S, Wei Liu, S, Mei Lin, C, Chen CC (2002) Anal. Chem 74: 330.
- Elisabete O, Júlio DN, Hugo MS (2012) From colorimetric chemosensors to metal nanoparticles using two new tyrosine Schiff-base ligands for Cu2+ Inorganic Chimica Acta 380: 22-30.
- Pearson RGJ (1962) Am. Soc 84: 62.
- Lodeiro C, Capelo JL, Santos HM, Pedras B, Nuñez C (2010) Chem. Soc. Rev 39: 1.
- Bernard V (2001) Molecular Fluorescence: Principles and Applications, Wiley-VCH Verlag GmbH.
- Dunn TM, Lewis J, Wilkins RG (1960) Modern Coordination Chemistry, New York: Interscience. Chapter 4, Section 4, ‘‘Charge Transfer Spectra 268.
- Gans P, Sabatini A, Vacca A (1996) Talanta 43: 1739.
- Si S, Bhattacharjee RR, Banerjee A, Mandal TK (2006) Chem. Eur. J. 12: 1256.
- Sipos P, Kiss TJ (1990) Chem. Soc, Dalton Trans 2909.
- Fernández-Lodeiro J, Nuñez,C, Carreira R, Santos HM, Capelo JL, Lodeiro C (2011) Tetrahedron 67 : 326 RG Pearson J (1962) Am Soc 84: (16):62.


-

Mark E Smith
Bio chemistry
University of Texas Medical Branch, USA -

Lawrence A Presley
Department of Criminal Justice
Liberty University, USA -

Thomas W Miller
Department of Psychiatry
University of Kentucky, USA -

Gjumrakch Aliev
Department of Medicine
Gally International Biomedical Research & Consulting LLC, USA -

Christopher Bryant
Department of Urbanisation and Agricultural
Montreal university, USA -

Robert William Frare
Oral & Maxillofacial Pathology
New York University, USA -

Rudolph Modesto Navari
Gastroenterology and Hepatology
University of Alabama, UK -

Andrew Hague
Department of Medicine
Universities of Bradford, UK -

George Gregory Buttigieg
Maltese College of Obstetrics and Gynaecology, Europe -

Chen-Hsiung Yeh
Oncology
Circulogene Theranostics, England -
.png)
Emilio Bucio-Carrillo
Radiation Chemistry
National University of Mexico, USA -
.jpg)
Casey J Grenier
Analytical Chemistry
Wentworth Institute of Technology, USA -

Hany Atalah
Minimally Invasive Surgery
Mercer University school of Medicine, USA -

Abu-Hussein Muhamad
Pediatric Dentistry
University of Athens , Greece
