


Lupine Publishers Group
Lupine Publishers
ISSN: 2641-6921
Research Article(ISSN: 2641-6921) 
Mathematical Modelling Of Glucose-Responsive Behavior Of Concanavalin A-Sugar Affnity Based Hydrogels Volume 5 - Issue 1
Received:March 7, 2022; Published: March 17, 2022
*Corresponding author:Ruixue Yin, Complex and Intelligent Systems Research Center, East China University of Science and Technology, China
Wenjun Zhang, Division of Biomedical Engineering, University of Saskatchewan, Canada
DOI: 10.32474/MAMS.2022.05.000204
Abstract
Mathematical modeling plays an important role in studying the glucose-responsive behavior of chemically-controlled closedloop system for design and optimization. In this study, a glucose-responsive swelling model controlled by seven main equations was established and solved to investigate the glucose-responsive behavior of Con A-DexG hydrogel-based chemically-controlled closedloop system. The swelling ratio Q and diffusion coefficient D are two variables in the model, and they can help design the molecular structure of the hydrogel (i.e., a mixture of Con A and DexG) with a potential to design a personalized insulin delivery system.
Keywords: Glucose-responsive; Chemically-controlled closed-loop system; Concanavalin A; Mathematical modeling; Insulin delivery
Introduction
An artificial closed-loop system, known as the artificial pancreas, can fast respond to changes of blood sugar levels and release insulin instantly. It deems to be better therapeutic method than insulin multi-injection method and has attracted widespread attention in the fields of materials, mechanics, and biology [1-3]. A chemically controlled closed-loop system relies on the responsive materials that can quickly respond to the slight changes in the environment, resulting in physical or chemical properties change of the system [4,5]. Small changes in the environment can be temperature, pH, electrolyte concentration, biomolecules (such as glucose, enzymes, antigens, etc.) and fields (electric and magnetic fields). Glucose responsive materials that can sense blood glucose concentration and release insulin in response to changes of glucose level have a great potential to develop the chemically controlled closed-loop insulin delivery system for an improved diabetes care [6-9].
At present, three glucose-responsive materials have been investigated to develop the chemically controlled closed-loop insulin delivery system [10-12], which are glucose oxidase, concanavalin A (Con A), and phenylboronic acid. Among them, the Con A-sugar affinity-based system is the most promising one for clinical use due to its strongest specificity to glucose [13]. The first in vivo test in a live diabetic domestic pig was performed in Taylor's group by using an implantable artificial pancreas made from crosslinked dextran-Con A hydrogel [9]. Mathematical modeling plays an important role in studying the glucose-responsive behavior of chemically-controlled closed-loop system. On the one hand, the mechanism of swelling and drug releasing in hydrogel system is further improved theoretically, which promotes the development of soft matter science [14]; on the other hand, it can simulate the behavior of the system without doing a lot of experiments, thus saving the time and cost of the trial-and-error process [15]. The objective of this study is to construct a mathematical model for the glucose-responsive process of Con A-sugar affinity based chemically controlled system based on swelling and variable diffusion coefficient theory. The calculated swelling ratio Q was compared with the obtained Q by experiments to verify the model. The influence of glucose concentration as well as other physical parameters on the swelling model were discussed.
The swelling model of the Con A-DexG hydrogel
The hydrogel in this study has two major parts: Con A and DexG. DexG has carbon-carbon double bonds, and the double bonds can crosslink to form the chemical crosslinking of the hydrogel. DexG also has terminal glucose groups, and the terminal glucose groups can bind with Con A to form physical affinity crosslinking of the hydrogel. The crosslinked network absorbs water to an equilibrium swelling state, thus allowing the transport of macromolecular drugs, nutrients, and cellular wastes [16]. The Con A and DexG mixture acts as a concentrated solution at full hydration with osmotic forces causing the hydrogel swell. The combination of covalent and affinitive cross-linking bonds makes the hydrogel act like a spring against this force. When competitive glucoses are introduced into the hydrogel network, the amount of affinitive crosslink bonds decreases, leading to less resistance to osmotic forces and enhanced swelling. Flory-Rehner [17] proposed a theory to explain the relationship between crosslink density and the swelling of rubber compounds. Peppas and Merrill [18] modified the original equation to establish a polymer network swelling equation:
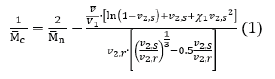
where is the number average molecular mass of the polymer chain between cross-links, is the number average molecular mass of the polymer chain, is the partial specific volume of the polymer, is the molar volume of water, is the Flory-Huggins polymer-solvent interaction parameter, is the polymer fraction of the hydrogel at equilibrium swelling, is the polymer fraction of the hydrogel after gel formation.
The swelling ratio can be calculated by the ratio of the polymer fraction of the hydrogel after gel formation to the polymer fraction of the hydrogel at equilibrium swelling, shown in equation 2.
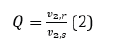
The volume increase caused by swelling will be regarded as a decrease in the polymer composition, so the swelling ratio will be greater than 1.
The competitive binding between DexG (DeG) and glucose (Glu) with Con A can be expressed as the given equations according to the ligand competition theory [16].

The binding process of both equations (3) and (4) are in a dynamic equilibrium, and the equilibrium constants are given by:
KDeG = [Con A-DeG] / [Con A] [DeG], (5)
KGlu = [Con A-Glu] / [Con A] [Glu]. (6)
The total number of cross-links was determined by finding the respective number of affinity and covalent bonds. The number of covalent bonds was assumed to equal the number of methacrylate groups measured for DexG molecules as it was assumed that each bind to a Con A molecule. Affinity cross-links were calculated by solving the binding equations 3- 6. It was assumed that there was only one dextran binding to one Con A tetramer. Although this is not strict, the model is greatly simplified.
According to the binding equations 3-6, the equilibrium constants of DexG-Con A and Con A-glucose binding are given by
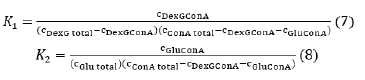
where is the initial concentration of Con A, is the initial concentration of DexG, is the initial concentration of glucose that is set to 0.022mol/L based on the concentration of blood sugar after meal in diabetic patients, is the concentration of resultant DexG-Con A complex, is the concentration of resultant Glu-Con A complex, and k1 and k2 are the equilibrium constants of DexG-Con A and Con A-glucose binding reactions, respectively. In order to calculate , Equation 8 needs to be rearranged and substituted into Equation 7. This leads to a quadratic equation, i.e.:

By calculating the concentration of covalent bonds and affinity cross-links, the average molecular weight between crosslinks can be calculated:
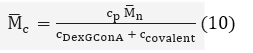
where cp is the concentration of polymer DexG in the hydrogel, and ccovalent can be calculated by the following equation:
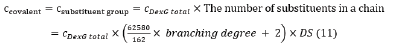
where the branching degree is characterized as 4.8% and the DS is characterized as 20.6% by NMR spectrum.
The concentrations of the components are governed by the degree of swelling; therefore, calculation of the swelling must be done iteratively. The swollen polymer fraction can be used to calculate the mesh size of the hydrogel [19]
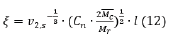
where Cn is the Flory characteristic ratio, Mr is the molecular mass of repeat unit, l is the unit length along the polymer backbone.
Then, the mesh size can be used to calculate the variable diffusion coefficient D based on the deviation from the liquid phase diffusivity [20,21]
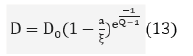
where D0 is the liquid phase diffusivity of the solute, a is the hydrodynamic radius of the solute.
Results and Discussion
Parameter’s calculation and validation
By using MATLAB software, the parameters can be calculated according to equations 1, 2, 7-13. The initial values and parameters calculated are shown in Table 1. For the model validation, the calculated swelling ratio Q was compared with the obtained Q by experiments in our previous study [22]. At the glucose level of 0.022 mol/L, the measured equilibrium swelling ratio Q of glucose-responsive Con A-DexG hydrogel samples by weighting method was about 4.75, while the calculated Q was 6.625 by the above mathematical model. The values are on the same order of magnitude. It is noted that the weighting method to get the swelling data also has significant operating error; therefore, using the swelling model of Con A-DexG hydrogel to get the swelling ratio is reasonable, and it is another effective way to obtain the swelling and diffusion behavior besides experiments.
Influence of glucose concentration on swelling and diffusion behavior
The parameter values at different glucose levels were calculated by MATLAB programming to discuss the influence of glucose concentration on the calculation results of the model. The range of glucose concentration was 0-0.06 mol/L.
(1) c_DexGConA
Table 1: Initial values and parameters calculated based on equations 1, 2, 7-13.

As it can be seen from Figure 1. The concentration of generated DexG-Con A complex decreases with increase of glucose level. According to the ligand competition equilibrium equations 3-4, with the increase of the glucose concentration, the chemical equilibrium of equation 4 shifts to the right side of the equation, generating more Con A-Glu complex. Meanwhile, the amount of Con A binding sites decreases, which also promoting the left shift of equation 3, leading to the decrease of DexG-Con A complex.
Figure 1: The concentration changes of the generated DexG-Con A complex with varied glucose concentration.

(2) 
According to the afore mentioned discussion, the concentration of DexG-Con Figure 2. A complex decrease with increased glucose concentration, resulting in a looser molecular network. The number average molecular mass of the polymer chain between cross-links increases correspondingly.
Figure 2: The change of number average molecular mass of the polymer chain between cross-links with varied glucose concentration.

(3) Q
The calculated Q>1 indicates that the hydrogel swells in the glucose solution. With the increase of glucose concentration, the swelling degree of hydrogel increases, and Q value increases, which is in good agreement with the conclusion obtained by experiments in our previous study The calculated Q>1 indicates that the hydrogel swells in the glucose solution Figure 3. With the increase of glucose concentration, the swelling degree of hydrogel increases, and Q value increases, which is in good agreement with the conclusion obtained by experiments in our previous study [22].
Figure 3: The swelling ratio change with varied glucose concentration.

(4) v2, s
As discussed above, with the increase of glucose concentration, the swelling degree of the hydrogel increases. Accordingly, more water enters the hydrogel system, leading to the decrease of the volume fraction of the polymer at equilibrium swelling Figure 4.
Figure 4: The polymer fraction of the hydrogel at equilibrium swelling change with varied glucose concentration.

(5) ξ
As glucose concentration increases, the swelling ratio increases and the molecular network of the hydrogel becomes looser and looser, leading to the increase of the mesh size Figure 5.
Figure 5: The mesh size change with varied glucose concentration.

(6) D
The diffusion coefficient reveals the insulin release rate during drug release process. As can be seen in Figure 6, The diffusion coefficient of insulin in the hydrogel gradually increases with the increase of glucose concentration. It is reasonable that with the mesh size of the hydrogel increases, it is easier for insulin to release through the hydrogel network.
Figure 6: The relationship between the variable diffusion coefficient of insulin and glucose concentration.

Conclusions
In this study, a glucose-responsive swelling model controlled by seven main equations was established and solved to investigate the glucose-responsive behavior of Con A-DexG hydrogel. The model was validated by the comparison of calculated swelling ratio Q and the measured Q obtained by weighting method. The model is proved to be an effective way to study the glucose-responsive behavior, in particular the swelling ratio Q and diffusion coefficient D. The effect of glucose concentration change on the swelling model was also explored. This study was a preliminary work for mathematical modeling and simulation of the glucose-responsive process of Con A-sugar affinity based chemically controlled systems. By the control of variables Q and D, the molecular structure and composition of Con A-DexG hydrogel may be possible to be tailed designed to meet the specific need of patients
References
- Kovatchev B, Kovatcheva A (2021) IEEE Spectrum, 58: 38-43.
- Ware J, Hovorka R (2022) Metabolism: Clinical and Experimental 127.
- Thabit H, Lal R, Leelarathna L (2021) Diabetic Medicine, 38.
- Heifler O, Borberg E, Harpak N, Zverzhinetsky M, Krivitsky V, et al. (2021) ACS Nano 15: 12019-12033.
- Fischer A, Lilienthal S, Vázquez-González M, Fadeev M, Sohn YS, et al. (2020) Journal of the American Chemical Society 142: pp 4223-4234.
- Jin X, Zhang X, Wu Z, Teng D, Zhang X, et al. (2009) Biomacromolecules 10: pp 1337-1345.
- Kim JJ, Park K (2001) Journal of Controlled Release 77: 39-47.
- Qi W, Yan X, Duan L, Cui Y, Yang Y, et al. (2009) Biomacromolecules10: pp1212-1216.
- Taylor M, Gregory P, Tomlins D, Jacob J, Sahota T, et al. (2016) International journal of pharmaceutics 371-378.
- Sabbagh F, Muhamad II, Niazmand R, Dikshit PK, Kim BS, et al (2022) International Journal of Biological Macromolecules pp. 222-243.
- Fan L, Zhang X, Liu X, Sun B, Li L, et al. (2021) Advanced Healthcare Materials p. 10.
- Lu Y, Yu H, Wang L, Shen D, Chen X, et al. (2021) European Polymer Journal p. 161.
- Xu M, Huang J, Jiang S, He J, Wang Z, et al. (2022) International Journal of Biological Macromolecules pp. 296-308.
- Drozdov AD, Declaville J (2020) Christiansen, RSC Advances 10: pp30723-30733.
- Lamberti G (2015) International journal of pharmaceutics. pp 157-158.
- Yin R, Bai M, He J, Nie J, Zhang W (2019) International journal of biological macromolecules pp. 724-732.
- Flory PJ, Rehner J (1943) The journal of chemical physics 11: 512-520.
- Flory PJ (1953) Principles of polymer chemistry, Cornell University Press, USA.
- Mason MN, Metters AT, Bowman CN, Anseth KS (2001) Macromolecules 34: 4630-4635.
- Lustig SR, Pappas NA (1988) Journal of Applied Polymer Science 36: 735-747.
- Pappas NA, Reinhart CT (1983) Journal of membrane science 15: 275-287.
- Yin R, Wang K, Han V, Nie J (2010) Carbohydrate Polymers 82: 412-418.


-

Mark E Smith
Bio chemistry
University of Texas Medical Branch, USA -

Lawrence A Presley
Department of Criminal Justice
Liberty University, USA -

Thomas W Miller
Department of Psychiatry
University of Kentucky, USA -

Gjumrakch Aliev
Department of Medicine
Gally International Biomedical Research & Consulting LLC, USA -

Christopher Bryant
Department of Urbanisation and Agricultural
Montreal university, USA -

Robert William Frare
Oral & Maxillofacial Pathology
New York University, USA -

Rudolph Modesto Navari
Gastroenterology and Hepatology
University of Alabama, UK -

Andrew Hague
Department of Medicine
Universities of Bradford, UK -

George Gregory Buttigieg
Maltese College of Obstetrics and Gynaecology, Europe -

Chen-Hsiung Yeh
Oncology
Circulogene Theranostics, England -
.png)
Emilio Bucio-Carrillo
Radiation Chemistry
National University of Mexico, USA -
.jpg)
Casey J Grenier
Analytical Chemistry
Wentworth Institute of Technology, USA -

Hany Atalah
Minimally Invasive Surgery
Mercer University school of Medicine, USA -

Abu-Hussein Muhamad
Pediatric Dentistry
University of Athens , Greece
