Lupine Publishers Group
Lupine Publishers
Menu
ISSN: 2637-4544
Research Article(ISSN: 2637-4544) 
Correlation of Tough Tacrolimus Level with Early Acute Rejections in Renal Allograft Recipients- A Prospective Study Volume 1 - Issue 3
Manish Tripathi*, Kalpesh Gohel, Umapati Hegde, Sishir Gang and Mohan Rajapurkar
- Department of Nephrology, Muljibhai Patel Urological Hospital and Society for Research in Nephro-Urology, India
Received: January 03,2018; Published: January 18, 2018
*Corresponding author: Manish Tripathi, Department of Nephrology, Emirates European Hospital, UAE
DOI: 10.32474/IGWHC.2018.01.000111
Abstract
Acute Rejection is the key mediators of long term graft loss. So we aimed the present study to assess the correlation of baseline pre transplant trough tacrolimus level with early rejection. We prospectively analyzed the trough tacrolimus level on the day prior to transplantation of 179 patients transplanted from September 2007 to September 2009. We divided them into three groups according to the trough levels: Group I = < 5 ng/ml, Group II = 5-15 ng/ml and Group III = > 15ng/ml. Their demography, incidence of BPAR, NOD, infections and biopsy proven CNI toxicity were studied. Incidence of BPAR were the highest in the Group I and lowest in the Group III. None of the patients in Group III had rejection with Banff grade > 2. Incidences of post transplant at infection, new onset diabetes were comparable. Trend towards higher incidence of biopsy proven CNI toxicity was noted from Group I to Group III. These results indicate that the incidence as well as severity of early rejection reduces as the pre transplant trough tacrolimus level increases. Trend towards higher nephrotoxicity with higher trough level was noted [1-25].
Keywords: Acute rejection; Renal transplant; Pre transplant tough; Tacrolimus level; Live donors; Graft survival; Nephrotoxicity
Abbrevations: BPAR: Biopsy Proven Acute Rejection; NOD: New Onset Diabetes; CNI: Calcineurin Inhibitor; MMF: Mycophenolate Mofetil; WIT: Warm Ischemia Time; CIT: Cold Ischemia Time; PTDM: Post Transplant Diabetes Mellitus; TAC: Tacrolimus; DGF: Delayed Graft Function; OHA: Oral Hypoglycemic Agent; TMA: Thrombotic Microangiopathy; TRAS: Transplant Renal Artery Stenosis; AGE: Acute Gastroenteritis; CMV: Cytomegalo Virus; HBV: Hepatitis B Virus; HCV: Hepatitis C Virus; UTI: Urinary Tract Infection; TCMR: T Cell Mediated Rejection; AMR: Antibody Mediated Rejection; TIR: Tubulo Interstitial Rejection
Introduction
Short-term transplant outcomes have improved such that, if no rejection episodes occur, recipients of live donor grafts can now expect graft function to exceed 95% at 1 year and 90% after 5 years. Several studies have shown that acute rejection is the most significant risk factor for chronic rejection and potential surrogate for long-term graft failure. Several trials are now aimed at the reduction of early acute rejection episodes to improve long term graft survival [1-24]. Transplantation with living donor allows anticipated planning of the procedure, which can be performed before dialysis treatment, and prior administration of an immunosuppressant scheme. Pre-transplant administration of immunosuppressant aims to minimize the incidence and severity of episodes of acute rejection. The risk of acute rejection is greater in the first week post-transplant and progressively decreases after the first months. Thus, the concentration of immunosuppressive drugs must be maximal at this initial phase and tapered during subsequent months, according to the evolution of patient and graft function [25-60].
Many transplantation centers advocate the administration of immunosuppressant pre-transplant, with a variation of one to five pre-operative days, while other centers only start the therapy after the surgery. The potential disadvantages of early administration of immunosuppressant therapy are the risk of infection and the nephrotoxicity effects of calcineurin inhibitors during allograft reperfusion. Up to the present moment, there is only one systematic study that addresses the impact of pre-transplant administration of immunosuppressive therapy consisting of cyclosporine as the CNI, on incidence and severity of acute rejection [60-75].
Material and Methods
Study Design
This is an open label randomized study consisting of renal allograft recipients from living donors. This study was carried out by Department of Nephrology, at a tertiary level referral hospital in western India, between January 2008 to September 2009. All patients enrolled were older than 18 years. The protocol received approval from the Ethical Committee of the hospital society. All the patients in the study received pre-transplant immunosuppressant starting 3 days prior to transplant. The follow up period was 1 year post transplant [75-90].
Immunosuppresion Scheme
Patients from the study group received Tacrolimus (0.15mg/ kg/d) divided into 2 doses and Azathioprine (2mg/kg/d), single dose, or Mycophenolate mofetil (4gm/d) divided into 2 doses, initiated 3 days pre-transplant. Methylpredn isalone (1g) was administered intravenous during surgery and after and after that, oral prednisalone was iniciated (8mg/kg/d) and gradually tapered to .3mg/kg/d after 3 months of transplant. Doses of Tacrolimus were adjusted according to the 12-hr trough level (C min), aiming to maintain the whole blood trough level between 10-20ng/ml over the initial 3-month post transplantation period and subsequently trough levels were reduced to 5-15ng/ml. Azathiprine dose was reduced or suspended in the presence of leucopenia. The Prednisalone dose was tapered to 0.4 mg/kg/d at the end of the first month, 0.3mg/kg/d at the second month, reaching 0.2mg/ kg/d at the third month [90-115].
Clinical Assessment
Serum creatinine was determined daily during the first 10 days and on day 14, 21, 28, 45, 60, 90, 180, 240 post transplant. Cmin was measured using a semi automated fluorescence polarization immunoassay (...) Baseline trough levels were measured on day of transplant and twice/week thereafter for the first 10 days. Subsequently trough levels were measured as per graft function and clinical requirement. The diagnosis of acute rejection was based on clinical and laboratory data. Percutaneous biopsy was always performed to confirm the diagnosis. The Banff 97 classification was used to graduate rejection severity. Acute rejection treatment included methylprednisalone (500mg/d) for 3-5 days or antilymphocyte globulin (ATG) in case of severe acute rejection (Banff grade 3) or steroid resistant acute rejection. The rejection-free graft survival was defined as patients free of rejection based in clinical/laboratory and or biopsy data. Graft loss was defined by the requirement of permanent dialysis after graft failure. Delayed graft function was defined as the requirement of dialysis during the first week after transplant in the absence of rejection and or technical problems. Non- response of acute rejection to conventional therapy was considered a failure of the protocol and the reason for conversion of the immunosuppressant therapy.
Statistical Analyses
Demographic, baseline characteristics and outcome characteristics were collected throughout the first year posttransplant. Demographic data included donor and recipient age, gender, relation and underlying native kidney disease. Baseline transplant information included induction used, anti-proliferative used, number of HLA mismatches, graft renal artery number(single or dual), WIT and CIT. Data on complications was also collected including post transplant rejections, surgical complications, infections, liver dysfunctions, PTDM, TAC nephrotoxicity, and delayed graft functions(DGF). DGF was defined as need for dialysis in the first week post-transplant.
PTDM was defined as requirement for oral hypoglycemic agents or insulin for the first time post-transplant. The outcome was assessed on the incidence and severity of acute rejection in correlation to base-line trough tacrolimus level measured on day 0 of transplantation. The side-effects of the immunosuppressive therapy was also assessed in the form of; episodes of posttransplant infection and their severity; liver dysfunction; PTDM and its severity (transient or persistent; requiring OHAs or insulin). Patients were divided and analyzed in three groups based on base-line trough TAC level on day 0 post-transplant: Group 1 : TAC 0- 5 ng/ml (n = 34), Group 2 : TAC 5-15 ng/ml (n =112), Group 3 : TAC >15 ng/ml (n = 33). Simple statistical tools were used for calculating demographic parameters. The difference between the two group means was tested using Student's t-test and the presence of episode within two groups by 2x2 Chi-square test. SPSS version 15.0 was used to carry the logistic regression analysis and to find the Pearson's correlation coefficients.
Results
One hundred and seventy-nine patients were included in the study, 145 (81%) males and 34 (19%) were females. The median age of cohort was 47.35 years (range 13-65 years). Our decision to take base-line trough tacrolimus level measured on day 0 of transplantation was based on the wide-ranging TAC seen in that time frame, despite all patients receiving the same initial oral dose of 0.15 mg/kg bid being started 2 days before transplant. TAC doses were subsequently adjusted in all groups to achieve a target TAC of 12-14 ng/ml by one week post-transplant.
Baseline Demographics
Male: female ratio among recipients in Group 1 was 24:10; Group 2 was 94:18; Group 3 was 27:6. Male: female ratio among donors in Group 1 was 9:25; Group 2 was 39:73 and in Group 3 was 13:20, as shown in table 11.1 and 11.2 respectively (Tables 1-7).
Table 1: One hundred and seventy-nine patients were included in the study, 145 (81%) males and 34 (19%) were females. The median age of cohort was 47.35 years (range 13-65 years).

Table 2: Patients were divided and analyzed in three groups based on base-line trough TAC level on day 0 post-transplant: Group 1 : median TAC 3.45 ng/ml (n = 34, range 1.1-5.0 ng/ml), Group 2 : median TAC 7.7 ng/ml (n =112, range 5.1-14.9 ng/ml), Group 3 : median TAC 20.7 ng/ml (n = 33, range 15.6-36.7 ng/ ml).

Table 3.1: Ratio of related donors to unrelated donors in each in each group was: Group 1- 28:6; Group 2- 76:36; Group 3- 22:11.

Table 3.2: Ratio of related donors to unrelated donors in each in each group was: Group 1- 28:6; Group 2- 76:36; Group 3- 22:11.

Table 4: Average age of recipient age in Group 1 was 49.06 + 10.15; in Group 2 was 47.38+9.6 and in Group 3 was 46.42+10.2. Table 5 categorizes them into 3 groups i.e. <20yrs; 20-40 yrs and >40yrs.

Table 5: Average age of donor in Group 1 was 49.05 + 10.15; in Group 2 was 47.7 + 10.14 and in Group 3 was 46.42 + 10.2. This is again categorized into 3 groups.

Table 6: Average age of donor in Group 1 was 49.05 + 10.15; in Group 2 was 47.7 + 10.14 and in Group 3 was 46.42 + 10.2. This is again categorized into 3 groups.

Table 7: Total ischemia time (TIT) was comparable in all 3 groups; in Group 1 TIT was 61.32+17.58; in Group 2 TIT was 57.15+9.7 and in Group 3 was 58.42+13.61. TIT in all the groups was divided into 3 groups.

HLA Mismatch
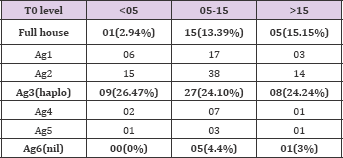
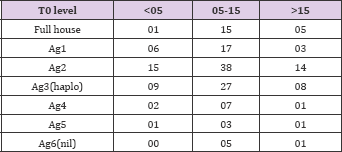
HLA mismatch in 3 groups were as follows: Group 1 haplo match was in 9 and nil match was in 0; Group 2 haplo match was in 27 and nil match was in 5; Group 3 haplo match was in 8 and nil match was in 1 patient. Various degree of HLA mismatch in all 3 groups is as shown in Table 8.
Table 8: HLA mismatch in 3 groups were as follows: Group 1 haplo match was in 9 and nil match was in 0; Group 2 haplo match was in 27 and nil match was in 5; Group 3 haplo match was in 8 and nil match was in 1 patient. Various degree of HLA mismatch in all 3 groups.
Immunosupression
Use of induction (ATG or IL2 receptor blockers) in 3 groups was as follows: Group 1 - 15; in Group 2 - 35; in Group 3-17. Different induction protocols used in 3 groups are as shown in Tables 9 & 10.
Table 9: Use of induction (ATG or IL2 receptor blockers) in 3 groups was as follows: Group 1-15; in Group 2 - 35; in Group 3 - 17. Different induction protocols used in 3 groups.
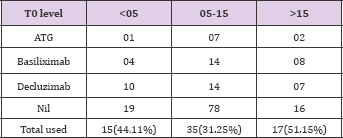
Table 10: Use of anti-proliferatives (AZA: MMF) in 3 groups were as follows: in Group 1- 20:14; in Group 2 - 50:62 and in Group 3 - 11:22.

Complications
Biopsy proven CNI toxicity in 3 groups was as follows: Group 1 - 2 (5.9%); in Group 2-9 (8.03%) and in Group 3 - 5 (15.1%). Table 11 shows its distribution in 3 groups.
Table 11: Biopsy proven CNI toxicity in 3 groups was as follows: Group 1-2 (5.9%); in Group 2 - 9 (8.03%) and in Group 3 - 5 (15.1%). Table 11 shows its distribution in 3 groups.

Rejections
Over the course of one year following transplant, there were 44 (24.58%) cases of biopsy proven ACR. When examined by quartile, a significant reduction in the rates of ACR was seen from Groups 1- 3. In Group 1 total ACR were 12 (35.3%); in Group 2 total ACR were 27(24.1%); and in Group 3 total ACR were 5(15.2%). This is shown in Tables 12-15.
Table 12: New onset diabetes after transplant (NODAT) in 3 groups was as follows: Group 1- 17(50%); Group 2 - 42 (13.5%) and in Group 3 -14 (42.4%).

Table 13: Non-infectious complications occurring during hospitalization and outpatient follow-up were as follows: Femoral neuropathy - 2; G.I side effects of MMF - 3; Hypertensive encephalopathy - 1; Proteinuria - 1; TMA -1; TRAS - 2.
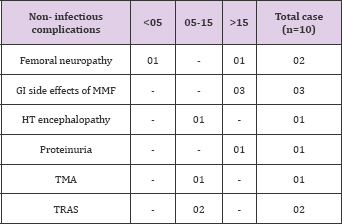
Table 14: Infectious complications were present in 57 patients .They were as follows: Acute gastroenteritis-5; CMV disease -14; Urinary tract infection - 26; Tuberculosis -2; Lower respiratory tract infection- 3; Herpes Zoster- 1; Post transplant HCV-1; post transplant HBV-3; Infected lymphocoel -1; Polyoma virus infection -1. Table 14 shows this distribution.
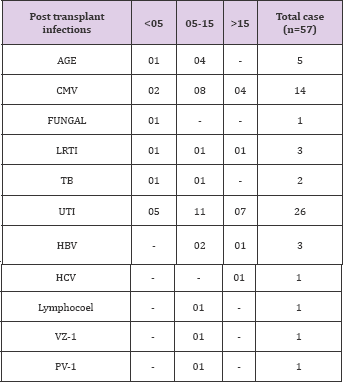
Table 15: In Group 1 total ACR were 12 (35.3%); in Group 2 total ACR were 27(24.1%); and in Group 3 total ACR were 5(15.2%). This is shown in table 15.

Discussion
ACR is a major factor in determining long-term graft outcome and its occurrence is heavily weighted towards the immediate posttransplant period. The critical influence of maintaining adequate early levels of immunosuppressive medications has been previously emphasized. Perico et al found that cylosporin levels on day 2 posttransplant were highly predictive of ACR episodes. Similarly, El- Sabrout et al. describe a significant reduction in ACR rates without an increase in toxicity after a loading dose of sirolimus. Staatz et al. identified a strong relationship between median TAC in the first post-transplant month and ACR. Their data were further analyzed by stratification into three groups based on median TAC, and those with the highest (10-15 ng/dl) values experienced no episodes of ACR. We found that biopsy proven ACR were reduced in a linear, graded fashion at all time points and for all TAC increments (Tables 16-25).
Table 16: Banff grading of these rejection episodes showed that grade 2 and grade 3 rejection were absent in Group 3, as seen clearly in table 16.
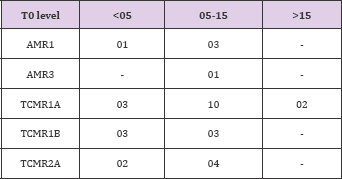
Table 17: Rates of post transplant infections in each group were as follows: in Group1- 12 (35.3%); in Group 2 - 33(29.5%) and in Group 3 - 15(45.4%). This is seen in table 17.

Table 18: Graft survival rates at the end of 1 year in each group was as follows: in Group 1 - 97.1%; in Group 2-98.2% and in Group 3 - 100% as shown in table 18.

Table 19:
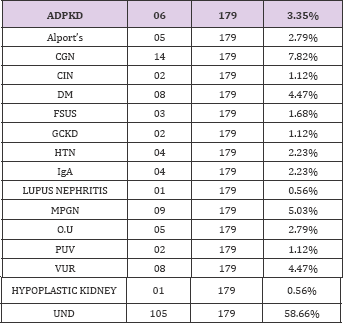
Table 20:

Table 21:

Table 22:

Table 23:
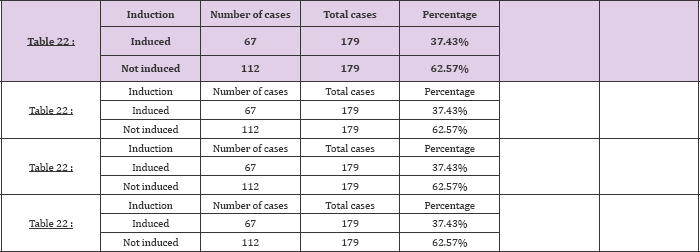
Table 24:

Table 25:

Our results suggest that targeting baseline (pretransplant) trough (T0) tacrolimus levels similar to those seen in Group 3(>15ng/ml) immediately post-transplant can yield extremely low ACR rates in the long term. With higher trough levels severity of rejections (based on Banff classification) also reduces and we did not encounter any antibody mediated or severe TIR rejection when the baseline trough levels were more than 15ng/dl. Tacrolimus toxicity like NOD was not different among various trough level groups, though there was a trend towards higher nephrotoxicity with higher baseline trough levels. Thus we propose that a target baseline trough tacrolimus levels similar to that seen in Group 3 would achieve the optimal balance between efficacy and toxicity. To avoid toxicity, the TAC dose was promptly adjusted to achieve a target range of 10-15 ng/ml before the end of first post transplant week. Despite this, a tendency towards increased toxicity was observed and warrants discussion. Despite a slower fall to nadir creatinine with higher baseline trough tacrolimus level, differences were undetectable by the end of the first week post-transplant. As mentioned earlier, in our study there was no trend towards increased NODAT in patients with higher baseline trough tacrolimus levels (Tables 17-35).
Table 26:
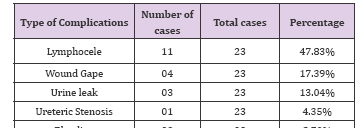
Table 27:

Table 28:
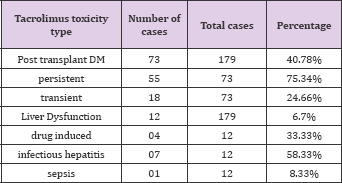
Table 29:

Table 30:
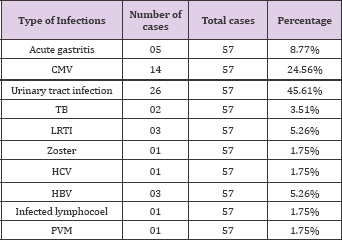
Table 31:

Table 32:

Table 33:

Table 34:

Table 35:

The potential for TAC to induce this complication is well known, although it is unclear if this is a dose-related phenomenon. Two recent studies were unable to demonstrate an association between Tacrolimus trough levels and the development of NODAT at any time point out to five years post-transplant. However, in an earlier study of 76 patients, Rodrigo et al. found that Tacrolimus trough levels of >24ng/ml early post-transplant was an independent risk factor for the development of NODAT. Although, all the patients in the study were started with initial dose of tacrolimus of 0.15mg/kg, only 18% could achieve the trough level of >15ng/ml.That an initial dose of 0.15mg/kg should yield such a wide range of early tacrolimus level is testament to the variability in tacrolimus handling in humans. To implement the finding of this study into clinical practice, knowledge of an individual's response to the drug before they are transplanted would be useful (Tables 36-44).
Table 36:

Table 37:

Table 38:
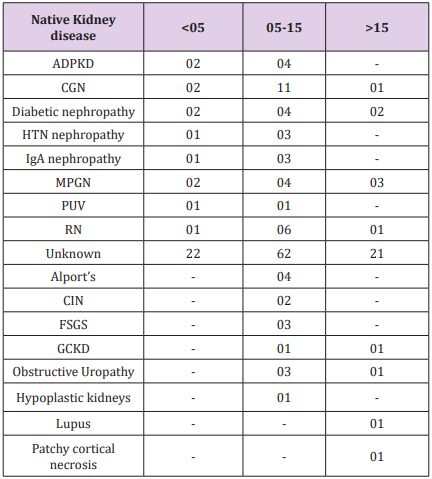
Table 39:

Table 40:

Table 41:

Table 42:

Table 43:

Table 44:

This question is being addressed by an Australian study that is soon to be reported. Increasing recipient age does appear to affect tacrolimus pharmacokinetics in both children and adults, with higher tacrolimus seen in older patients despite equivalent dosing. This suggests that younger patients would benefit from a higher initial tacrolimus dose, targeting tacrolimus similar to those observed in Group 3(.15ng/ml). This study demonstrates a clear association between baseline (pre-transplant) trough tacrolimus level and reduced long term ACR rates. Targeting high baseline tacrolimus levels (>15ng/ml) and aggressively managing tacrolimus dosing in this critical period of antigen presentation and immunological activation may result in reduced rates of long-term allograft damage (Tables 44-50).
Table 45:

Table 46:
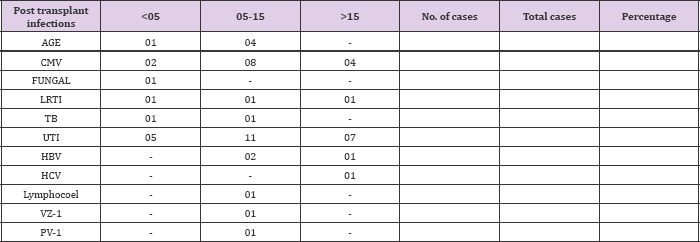
Table 47:

Table 48:

Table 49:
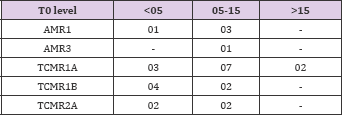
Table 50:
Conclusion
In summary, our study shows that the incidence of early rejection reduces as the baseline (pre-transplant) trough tacrolimus level increases. It also shows that with higher trough level severity of rejection also reduces and that there was no severe TIR and antibody mediated rejection when trough level was > 15ng/ml. Our study also showed that the incidence of NODAT was not different among various trough levels; although there was a trend towards higher rate of biopsy proven nephrotoxicity with higher trough levels. It was also seen that only 18% of the patients could achieve a baseline trough level of >15ng/ml inspite of being started on same doses of tacrolimus (0.15mg/kg) pretransplant .This shows a wide variability in tacrolimus handling in humans.
To conclude,
a. Incidences of early rejection reduces as the pretransplant trough tacrolimus level increases.
b. With higher trough level severity of rejection also reduces and we did not encounter any severe.
c. TIR or antibody mediated rejection when trough level was > 15 ng/ml.
d. NOD was not different among various trough levels and trend towards higher nephrotoxicity with higher trough levels.
e. Only 18 % could achieve the trough level of > 15 ng/ml.
References
- Arrazola L, Sozen H, Humar A, Papalois V, Uknis M, et al. (2000) Both immunologic and non immunologic factors are risks for long-term graft survival- a multivariate analysis. Transplantation Proceedings 32(7): 1831.
- Humar A, Ramcharan T, Kandaswamy R, Gillingham K, Payne WD, et al. (2002) Risk factors for slow graft function after kidney transplants: a multivariate analysis. Clinical Transplantation 16(6): 425-429.
- Paraskevas S, Kandaswamy R, Humar A, Gillingham K, Gruessner RW, et al. (2003) Predicting long-term kidney graft survival: can new trials be performed? Transplantation 75(8): 1256-1259.
- Sayegh MH, Turka LA (1998) The role of T-cell costimulatory activation pathways in transplant rejection. The New England Journal of Medicine 338(25): 1813-1821.
- Kreisel D, Krupnick AS, Gelman AE, Engels FH, Popma SH, et al. (2002) Non-hematopoietic allograft cells directly activate CD8+ T cells and trigger acute rejection: An alternative mechanism of allorecognition. Nature Medicine 8(3): 233-239.
- Denton MD, Magee CC, Sayegh MH (1999) Immunosuppressive strategies in transplantation. Lancet 353(9158):1083-1091.
- Suthanthiran M, Strom TB (1994) Renal transplantation. The New England Journal of Medicine 331(6): 365-376.
- Magee CC, Denton MD, Mieford EL (1999) Immunosuppressive agents in organ transplantation. Hospital Medicine 60(5): 364-369.
- Gotti E, Perico N, Gaspari F, Cattaneo D, Lesti MD, et al. (2005) Blood Cyclosporine Level Soon After Kidney Transplantation is a Major Determinant of Rejection: Insights From the Mycophenolate Steroid-Sparing Trial. Transplantation Proceedings 37(5): 2037-2040.
- Perico N, Ruggenenti P, Gotti E, Gaspari F, Dario Cattaneo, et al. (2004) In renal transplantation blood cyclosporine levels soon after surgery act as a major determinant of rejection: Insights from the MY.S.S Trial. Kidney International 65(3): 1084-1090.
- El Sabrout R, Delaney V, Butt F, Qadir M, Hanson P, et al. (2003) Improved freedom from rejection after a loading dose of sirolimus. Transplantation 75(1): 86-90.
- Staatz C, Taylor P, Tett S (2001) Low tacrolimus concentrations and increased risk of early acute rejection in adult renal transplantation. Nephrol Dial Transplant 16(9): 1905-1909.
- Lindholm A, Ohlman S, Albrechtsen D, Tufvenson G, Persson H, et al. (1993) The impact of acute rejection episodes on long term graft function and outcome in 1337 primary renal transplants treated by 3 cyclosporin regimens. Transplantation 56: 307-315.
- Matas AJ, Gillingham KJ, Payne WD, Najarian JS (1994) The impact of an acute rejection episode on long-term renal allograft survival. Transplantation 57(6): 857-859.
- Cecka JM (1991) Early rejection: Determining the fate of renal transplants. Transplantation Proceedings 23(1): 1263-1264.
- Gulanikar AC, MacDonald AS, Sungurtekin U, Belitsky P (1992) The incidence and impact of early rejection episodes on graft outcome in recipients of first cadaver kidney transplants. Transplantation 53(2): 323-328.
- Ferguson RM, Henry M, Elkhammas EA, Tesi RJ (1992) Acute rejection episodes-best indicator of long-term primary cadaveric renal transplant survival. Presented at the 18th Annual Meeting of the American Society of Transplant Surgeons, Chicago, IL, USA: 83.
- Brady HR, Kamel KS, Harding ME, Cook GT, DeVeber GA, et al. (1990) Low Dose Ciclosporin from the Early Postoperative Period Yields Potent Immunosuppression after Renal Transplantation. Nephron 55(4): 394399.
- Pirsch JD, D Alessandro AM , Sollinger HW, Hoffmann RM , Roecker E, et al. (1992) The effect of donor age, recipient age, and HLA match on immunologic graft survival in cadaver renal transplant recipients. Transplantation 53(1): 55-59.
- Takahara S, Kokado Y, Kameoka H, Takano Y, Jiang H, et al. (1994) Monitoring of FK506 blood levels in kidney transplant recipients. Transplantation Proceedings 26(4): 2106-2108.
- Kerhner R, Fitsimmons WE (1996) Relationship of FK506 whole blood concentrations and efficacy and toxicity after liver and kidney transplantation. Transplantation 62(7): 920-926.
- Winker M, Wonigeit K, Undre N (1995) Comparison of plasma vs. whole blood as matrix for FK506 drug level monitoring. Transplantation Proceedings 27: 822-825.
- Undre NA, van Hooff J, Christianns M, Vanrenterghem Y, Donck J, et al. (1999) Low systemic exposure to Tacrolimus correlates with acute rejection. Transplant Proceedings 31(1-2): 296-298.
- Backman L, Levy MF, Klintmalm (1995) The FK506 Multicentre Study Group, Whole-blood and the plasma levels of FK506 after liver transplantation: Results from the.com Multicenter Trial. Transplant Proc 27: 1124.
- Backman L, Nicar M, Levy M, Distant D, Eisenstein C, et al. (1994) FK506 trough levels in whole blood and plasma in the liver transplant recepi- ents. Transplantation 57(4): 519-525.
- Jain AB, Todo S, Fung JJ, R Venkataramanan, R Day, et al. (1991) Correlation of rejection episodes with FK 506 level and the steroids following primary orthotropic liver transplantation. Transplant Proceedings 23(6): 3023-3025.
- Japanese FK506 Study Group (1991) Japanese study of FK506 on kidney transplantation: The benefit of monitoring the whole blood FK506 concentration. Transplant Proceedings 23: 3023-3025.
- Bottiger Y, Battstrom C, Tyden G, Sawe J, Groth CG (1999) Tacrolimus whole blood concentrations correlate closely to side-effects in renal transplant recipients. British Journal of Clinical Pharmacology 48(3): 445-448.
- Winkler M, Ringe B, Baumann J, Loss M, Wonigiet K (1994) Plasma vs. whole blood for therapeutic drug monitoring of patients receiving FK 506 for immunosuppression. Clinical Chemistry 40(12): 2247-2253.
- Mayer AD, Dmitrewski J, Squifflet JP, Besse T, Grabensee B, et al. (1997) Multicenter randomized trial comparing tacrolimus (FK506) and cyc- losporine in the prevention of renal allograft rejection: a report of the European Tacrolimus Multicenter Renal Study Group. Transplantation 64(3):436-443.
- Pirsch JD, Miller J, Deierhoi MH, Vincevti F, Filo RS, et al. (1997) A comparison of tacrolimus (FK506) and cyclosporine for immunosuppression after cadaveric renal transplantation. FK506 Kidney Transplant Study Group. Transplantation 63(7): 977-983.
- Jensik SC (1998) Factors affecting the pharmacokinetics of tacrolimus in the first year after renal transplantation. European Tacrolimus Multicentre Renal Study Group. Transplantation Proceedings 30(4):1261- 1263.
- Mayer AD (1999) Four year follow up of European tacrolimus multicenter renal study. Transplantation Proceedings 31(7A): 27S-28SC.
- Johnson, Ahsan N, Gonwa T, Halloran P, Stegall M, et al. (2000) Randomized trial of tacrolimus in combination with azathiprine or mycophe- nolate mofetil versus cyclosporine with mycophenolate mofetil after cadaveric renal transplant. Transplantation 69(5): 834-841.
- Schweitzer EJ, Matas AJ, Gillingham KJ, Payne WD, Gores PF, et al. (1991) Causes of renal allograft loss: progress in the 1980s, challenges for the 1990s. Annals of Surgery 214(6): 679-688.
- Massy ZA, Guijarron C, Wiederkehr MR, Ma JZ, Kasiske BL (1996) Chronic renal allograft rejection: Immunologic and non immunologic risk factors. Kidney Interantional 49(2): 518-524.
- Matas AJ, Gillingham KJ, Payne WD, Najarian JS (1994) The impact of acute rejection episode on long-term renal allograft survival (t %). Transplantation 57(6): 857-859.
- Cosio FG, Pelletier RP, Falkenhain ME, Henry ML, Elkhammas EA, et al.(1997) Impact of acute rejection and early allograft function on renal allograft survival. Transplantation 63(11): 1611-1615.
- Opelz G (1997) For the Collaborative transplant study. Critical evaluation of the association of acute with chronic graft rejection in kidney and heart transplant recipients. Transplantation Proceedings 29(1-2): 73-76. Keefe SJ, Tamura J, Kincaid RL, Tocci MJ, O Neill EA (1992) FK- 506-and CsA- sensitive activation of the interleukin-2 promoter by calci- neurin. Nature 357(6380): 692-694.
- Clipstone NA, Crabtree GR (1992) Identification of calcineurin as a key signaling enzyme in T-lymphocyte activation. Nature 357: 695-697.
- Liu J, Farmer JD Jr, Lane WS, Friedman J, Weissman I, et al. (1991) Calcineurin is a common target of cyclophilin-cyclosporin A and fkbp-fk506 complexes. Cell 66(4): 807-815.
- Fruman DA, Klee CB, Biere BE, Burakoff SJ (1992) Calcineurin phos- phatease activity in T lymphocytes is inhibited by FK 506 and cyclosporine A. Proceedings of the National Academy of Sciences of the United States of America 89(9): 3686-3690.
- Schreiber SL (1992) Immunophilin-sensitive protein phosphatase action in cell signaling pathways. Cell 70(3): 1259-1262.
- Cecka JM, Terasaki PI (1993) The UNOS Scientific Renal Transplant Registry in: Terasaki PI, Cecka JM, eds. Clinical transplants 1992, Los Angeles UCLA Tissue Typing Laboratory, USA: 1-16.
- Terasaki PI, Cecka JM, Gjertson DW, Cho Y, Takemoto S, et al. (1993) A ten-year prediction for renal transplant survival. In: Tersaki PI, Cecka JM, eds. Clinical transplants 1992. Los Angeles: UCLA Tissue Typing Laboratory, USA: 501-12.
- Basdonna GP, Matas AJ, Gillingham KJ, Payne WD, Dunn DL, et al. (1993) Relationship between early and late acute rejection and onset of chronic rejection in kidney transplantation. Transplantation Proceedings 25(1 Pt 2): 910-911.
- Almond PS, Matas A, Gillingham K, Dunn DL, Payne WD, et al. (1993) Risk factors for chronic rejection in renal allograft recepients. Transplantation 55(4): 752-756.
- Basdonna GP, Matas AJ, Gillingham KJ, Payne WD, Dunn DL, et al. (1993) Early versus late acute renal allograft rejection: impact on chronic rejection. Transplantation 55(5): 993-995.
- Land W, Schneeberger H, Schleibner S (1991) Long-term results in cadaveric renal transplantation under cyclosporine therapy. Transplantation Proceedings 23: 1244.
- Matas A (1994) Chronic rejection in renal transplant recipients: risk factor and correlates. Clinical Transplantation 8(3 Pt 2): 332-335.
- Vanrenterghem YFC (1995) Acute rejection and renal allograft outcome. Nephrol Dial Transplant 10 (suppl 1):29-31.
- Lindholm A, Ohlman S, Albrechtsen D, Tufveson G, Persson H, et al. (1993) The impact of acute rejection episodes on long term graft function and outcome in 1347 primary renal transplants treated by 3 cyclosporin regimens. Transplantation 56(2): 307-315.
- Cecka JM, Terasaki PI (1991) The UNOS scientific renal transplant registry, 1990. In: Treasaki P,ed. Clinical transplants 1990. Los Angeles: UCLA Tissue typing laboratory, USA: 1.
- Cecka JM, Terasaki PI (1995) The UNOS scientific renal transplant registry. In: Terasaki PI, Cerka JM, eds. Clinical transplants 1994. Los Angeles: UCLA Tissue Typing Laboratory, USA: 1.
- Japanese FK (1991) 506 Study Group. Japanese study of FK 506 on kidney transplantation: results of an early phase 2 study. Transplantation Proceedings 23: 3017.
- Laskow DA, Vincenti F, Neylan J, Mendez R, Matas A (1995) Phase 2 FK 506 multicenter concentration control study: one-year follow up. Transplantation Proceedings 27(1): 809-811.
- Jordan ML, Shapiro R, Vivas CA, Velma P. Scantlebury, Parmjeet Rhand- hawa, et al. (1994) FK506 "rescue” for resistant rejections of renal allografts under primary cyclosporine immunosuppression. Transplantation 57(6): 860-865.
- Japanese FK (1993) 506 Study Group. Japanese study of FK 506 on kidney transplantation: results of an early phase 2 study. Transplantation Proceedings 25: 649.
- Japanese FK (1995) 506 Study Group. FK 506: Long term study in kidney transplantation. Transplantation Proceedings 27: 818.
- Shapiro R, Jordan M, Scantlebury V, Vivas C, Fung JJ, et al. (1995) A prospective randomized trial of FK 506- based immunosuppression after renal transplantation. Transplantation 344: 423.
- Undre NA, Stevenson P, Schafer A (1999) Pharmacokinetics of tacrolimus: clinically relevant aspects. Transplantation Proceedings 31(7): 296298.
- Aweeka FT, Benet LZ, Gambertoglio JG, Peter K, Okudaira N (1993) Comparative pharmacokinetics of orally (PO) and intravenously (IV) administered tacrolimus (FK506) in pre- and post-kidney transplant recipients. Clin Pharmacol Ther 53:151.
- Lee C, Hewitt J, Aweeka F, (1993) Pharmacokinetics of tacrolimus (FK506) prior to kidney transplantation. Clin Pharmacol Ther 53: 238.
- Mekki Q, Lee C, Aweeka F (1993) Pharmacokinetics of tacrolimus (FK506) in kidney transplant patients. Clin Pharmacol Ther 53: 238.
- Beysens AJ, Wijnen RMH, Beuman GH, van der HJ, Koots tra G, et al. (1991) FK506: monitoring in plasma or in whole blood? Transplantation Proceedings 23(6): 2745-2747.
- Karanam BV, Vincent SH, Newton DJ, Wang RW, Chiu SHL (1994) FK506 metabolism in human liver microsomes: investigation of the involvement of cytochrome P450 isozymes other than CYP3A4. Drug Metabolism and Disposition 22(5): 811-814.
- Iwasaki K, Shiraga T, Nagase K, Tozuka Z, Noda K, et al. (1993) Isolation, identification and biological activities of oxidative metabolites of FK506, a potent immuno- suppressive macrolide lactone. Drug Metabolism and Disposition 21(6): 971-977.
- Iwasaki K, Shiraga T, Matsuda K, Nagase K, Tokuma Y, et al. (1995) Further metabolism of FK506 (tacrolimus). Identification and biological activities of the metabolites oxidized at multiple sites of FK506. Drug Metabolism and Disposition 23(1): 28-34.
- Hill HM, Clark SD, Bentley L (1997) Presented at AAPs annual meeting.
- Undre NA, Schäfer A (1998) The European Tacrolimus Multicentre Renal Study Group, Factors Affecting the Pharmacokinetics of Tacrolimus in the First Year after Renal Transplantation. Transplant Proc 30: 12611263.
- Zucker K, Rosen A, Tsaroucha A, de Faria L, Roth D, et al. (1997) Unexpected augmentation of mycophenolic acid pharmacokinetics in renal transplant patients receiving tacrolimus and mycophenolate mofetil in combination therapy, and analogous in vitro findings. Transplant Immunology 5(3): 225-232.
- Undre NA, van Hooff J, Christiaans M, Vanrenterghem Y, Donck J, et al. (1998) Low systemic exposure to tacrolimus correlates with acute rejection. Transplantation Proceedings 30: 1299.
- Bottiger Y, Undre NA, Sawe J, Stevenson PJ, Ericzon BG (2002) Effect of bile flow on the absorption of tacrolimus in the liver allograft transplantation. Transplantation Proceedings 34(5): 1544-1545.
- Morris Stiff G, Ostrowski K, Balaji V, Moore R, Darby C, et al (1998) Prospective randomised study comparing tacrolimus (Prograf) and cyclosporin (Neoral) as primary immunosuppression in cadaveric renal transplants at a single institution: Interim report of the first 80 cases. Transplant International 11[Suppl 1]: S334-S336.
- Busque S, Shoker A, Landsberg D, McAlister V, Halloran P, et al. (2001) Canadian multicentre trial of tacrolimus/azathioprine/steroids versus tacrolimus/mycophenolate mofetil/steroids versus neoral/mycopheno- late mofetil/steroids in renal transplantation. Transplantation Proceedings 33(1-2): 1266-1267.
- Margreiter R (2002) Efficacy and safety of tacrolimus compared with ciclosporin microemulsion in renal transplantation: A randomized multicentre study. Lancet 359(9308): 741-746.
- Dunn CJ, Wagstaff AJ, Perry CM, Plosker GL, Goa KL (2001) Cyclosporin: An updated review of the pharmacokinetic properties, clinical efficacy and tolerability of a microemulsion-based formulation (Neoral) 1 in organ transplantation. Drugs 61(13): 1957-2016.
- Christiaans M, van Duijnhoven E, Beysens T, Undre N, Schafer A, et al.(1998) Effect of breakfast on the oral bioavailability of tacrolimus and changes in pharmacokinetics at different times post transplant in renal transplant recipients. Transplantation Proceedings 30(4): 1271-1273.
- Halloran PF, Helms LM, Kung L, Noujaim J (1999) The temporal profile of calcineurin inhibition by cyclosporine in vivo. Transplantation 68(9): 1356-1361.
- Stein CM, Murray JJ, Wood AJ (1999) Inhibition of stimulated interleukin-2 production in whole blood: A practical measure of cyclosporine effect. Clinical Chemistry 45(9): 1477-1484.
- Hartel C, Fricke L, Schumacher N, Kirchner H, Muller Steinhardt M (2002) Delayed cytokine mRNA expression kinetics after T-lymphocyte co stimulation: A quantitative measure of the efficacy of cyclosporin A-based immunosuppression. Clinical Chemistry 48(12): 2225-2231.
- Sommerer C, Konstandin M, Dengler T, Schmidt J, Meuer S, et al. (2006) Pharmacodynamic monitoring of cyclosporine a in renal allograft recipients shows a quantitative relationship between immunosuppression and the occurrence of recurrent infections and malignancies. Transplantation 82(10): 1280-1285.
- Labrecque G, Belanger PM (1991) Biological rhythms in the absorption, distribution, metabolism and excretion of drugs. Pharmacology and Therapeutics 52(1): 95-107.
- Lemmer B (2000) Relevance for chronopharmacology in practical medicine. Seminars in perinatology 24(4): 280-290.
- Reinberg AE, Soudant E, Koulbanis C, Bazin R, Nicolai A, et al. (1995) Circadian dosing time dependency in the forearm skin penetration of methyl and hexyl nicotinate. Life Sciences 57(16): 1507-1513.
- King DP, Zhao Y, Sangoram AM, Wilsbacher LD, Tanaka M, et al. (1977) Positional cloning of the mouse circadian clock gene. Cell 89(4): 641653.
- Goto T, Kino T, Hatanaka H, Hatanaka H, Nishiyama M, et al. (1987) Discovery of FK506, a novel immunosuppressant isolated from Streptomy- ces tsukubaensis. Transplantation Proceedings 19(5 Suppl 6): 4-8. the propagating velocity of the
- Kumar D, Wingate D, Ruckebusch Y (1986) Circadian variation in the propagation velocity of the migrating motor complex. Gastroenterology 93: 926-930. .
- Belanger PM, Labrecque G, Dore F (1982-1983) Rate limiting steps in the temporal variations of the pharmacokinetics of some selected drugs. International Society for Chronobiology: 359-363.
- Cambar J, Lemoigne F, Toussaint C (1979) Etude des variations nychte- merales de la filtration glomerulaire chez le rat. Experientia 35(12): 1607-1609.
- Born J, Lange T, Hansen K, Molle M, Fehm HL (1997) Effects of sleep and circadian rhythm on human circulating immune cells. Journal of Immunology 158(9): 4454-4464.
- Goldsmith MA, Greene WC (1994) Interleukin-2 and the interleukin-2 receptor, In: Thomson A. (edn.), The Cytokine Handbook, Academic Press, London, p. 57-80.
- Uthgenannt D, Schoolmann D, Pietrowsky R, Fehm, HL, Born J (1995) Effects of Sleep on the Production of Cytokines in Humans. Psychosomatic Medicine 57(2): 97-104.
- Lemmer B (1999) Chronopharmacokinetics: Implications for Drug Treatment. J Pharm Pharmacol 51(8): 887-890.
- Lemmer B, Nold G (1991) Circadian changes in estimated hepatic blood flow in healthy subjects. Br J Clin Pharmacol 32(5): 627-629.
- Goo RH, Moore JG, Greenberg E, Alazraki NP (1987) Circadian Variation in Gastric Emptying of Meals in Humans. Gastroenterology 93(3): 515518.
- Bekersky I, Dressler D, Mekki Q (2001) Effect of time of meal consumption on bioavailability of a single oral 5 mg tacrolimus dose. J Clin Pharmacol 41(3): 289-297.
- Wong SHY (2001) Therapeutic drug monitoring for immunosuppressants. Clinica Chimica Acta
- 313(1-2): 241-253.
- Hawley CM, Wall DR, Johnson DW, Campbell SB, Griffin AD, et al. (1995) Recovery of gastrointestinal function after renal transplantation in a patient with sclerosing peritonitis secondary to continuous ambulatory peritoneal dialysis. Am J Kidney Dis 26(4): 658-661.
- Fujimura A, Ebihara A (1994) Administration time-dependent toxicity of a new imunosuppressive agent, tacrolimus (FK 506). Life Sciences 55(7): 485-490.
- Fujimura A, Shiga T, Ohashi K, Ebihara A (1993) Chronopharmaco- kinetic study of a new immunosuppressive agent, FK 506, in mice. Japanese Jouranl of Pharmacology 61(2): 137-139.
- Uchida H, Kobayashi E, Ogino Y, Mizuta K, To H, et al. (1993) Chro- nopharmacology of tacrolimus in rats: toxicity and efficacy in a mouse- to-rat intestinal transplant model and its pharmacokinetic profile. Transplantation proceedings 31(7): 2751-2753.
- Jorgensen K, Povlsen J, Madsen S, Madsen M, Hansen H, et al. (2002) C2 (2-h) levels are not superior to trough levels as estimates of the area under the curve in tacrolimus-treated renal-transplant patients. Nephrology Dialysis Transplantation 17(8): 1487-1490.
- Iwasaki K, Matsuda H, Nagase K, Shiraga T, Tokuma Y, et al. (1993) Effects of twenty three drugs on the metabolism of FK506 by human liver microsomes. Res Commun Chem Pathol Pharmacol 82(2): 209-216.
- Tada H, Yanagiwara S, Itoh K, Suzuki T (1999) Role of diltiazem on tacrolimus pharmacokinetics in tacrolimus-induced nephrotoxic rats. Pharmacol Toxicol 84(6): 241-246.
- Regazzi MB, Iacona I, Alessiani M, Spada M, Vaccarisi S, et al. (1996) Interaction between FK506 and diltiazem in an animal model. Transplantation Proceedings 28: 1017-1018.
- Hebert MF, Lam AY (1999) Diltiazem increases tacrolimus concentrations. Ann Pharmacother 33(6): 680-682.
- Bailey DG, Spence JD, Munoz C, Arnold JM (1991) Interaction of citrus juices with felodipine and nifedipine. Lancet 337(8736): 268-269.
- Di Marco MP, Edwards DJ, Wainer IW, Ducharme MP (2002) The effect of grapefruit juice and Seville orange juice on the pharmacokinetics of dextromethorphan: the role of gut CYP3A and P-glycoprotein. Life Sciences 71(10): 1149-1160.
- Wong KM, Shek CC, Chau KF, Li CS (2000) Abbreviated tacrolimus area under the curve monitoring for renal transplant recipients. Am J Kidney Dis 35(4): 660-666.
- Ku YM, Min DI (1998) An abbreviated area-under-the-curve monitoring for tacrolimus in patients with liver transplants. Therapeutic Drug Monitoring 20(2): 219-223.
- Knapp MS, Cove Smith Jr, Dugda- le R, Mackenzie N, Pownall R (1979) Possible effect of time on renal allograft rejection. Br Med J 1: 75-77.
- Tada H, Satoh S, Iinuma M, Shimoda N, Murakami M, et al. (2003) Chronopharmacokinetics of tacrolimus in kidney transplant recipients: occurrence of acute rejection. J Clin Pharmacol 43(3): 859-865.
- Kim JS, Aviles DH, Silverstein DM, Leblanc PL, Matti Vehaskari V (2005) Effect of age, ethnicity, and glucocorticoid use on tacrolimus pharmacokinetics in paediatric renal transplant patients. Pediatr Transplant 9(2): 162-169.

Top Editors
-

Mark E Smith
Bio chemistry
University of Texas Medical Branch, USA -

Lawrence A Presley
Department of Criminal Justice
Liberty University, USA -

Thomas W Miller
Department of Psychiatry
University of Kentucky, USA -

Gjumrakch Aliev
Department of Medicine
Gally International Biomedical Research & Consulting LLC, USA -

Christopher Bryant
Department of Urbanisation and Agricultural
Montreal university, USA -

Robert William Frare
Oral & Maxillofacial Pathology
New York University, USA -

Rudolph Modesto Navari
Gastroenterology and Hepatology
University of Alabama, UK -

Andrew Hague
Department of Medicine
Universities of Bradford, UK -

George Gregory Buttigieg
Maltese College of Obstetrics and Gynaecology, Europe -

Chen-Hsiung Yeh
Oncology
Circulogene Theranostics, England -
.png)
Emilio Bucio-Carrillo
Radiation Chemistry
National University of Mexico, USA -
.jpg)
Casey J Grenier
Analytical Chemistry
Wentworth Institute of Technology, USA -
Hany Atalah
Minimally Invasive Surgery
Mercer University school of Medicine, USA -

Abu-Hussein Muhamad
Pediatric Dentistry
University of Athens , Greece

The annual scholar awards from Lupine Publishers honor a selected number Read More...


