


Lupine Publishers Group
Lupine Publishers
ISSN: 2637-4595
Review Article(ISSN: 2637-4595) 
Fundamentals and Applications of Computer-Aided Colour Match Prediction (CCMP) System Volume 2 - Issue 5
Received: September 03, 2018; Published: September 11, 2018
*Corresponding author:Pubalina Samanta, Lecturer (Contractual), Dept of BFAD, Rani Birla Girls’ College, Kolkata, India
DOI: 10.32474/LTTFD.2018.02.000148
Introduction
The analysis of colour in terms of hue, value and chroma has its origin deeply rooted with Ostwald concept of colour quantification, though from the epic age, this colour has played an important role in human life. This inspired us to explore the vast storehouse of the natural’s palette to initially paint ourselves then to dye the apparels. According to Trottman [1] dye stuffs give colour to the material onto which they have been anchored, by selectively retaining some of the wavelengths out of the light falling upon the surface. If a dye absorbs strongly at the red end of the spectrum the light that is reflected will be of a bluish hue. Only a limited number of organic molecules possess this property of absorbing light selectively. Ever since about 1860 intense interest has been displayed in investigations to discover which aspects of molecular structure are responsible for Table 1.
Table 1: Data showing different wavelength of absorbed light/ visible colour.

According to Shah & Gandhi [2] colour is something which makes the object more appearing, attractive & gives the pleasure of observation. The committee on colorimetry of optical society of America defined the colour as visual sensation arising from the stimulation of retina of the eye. Thus, it is defined as psychophysical a psychological response to a physical stimulus. So, in brief, to chemist, it may be a chemical compound, a dye or a pigment, to physicist it is a scattering & absorption of light or reflectance spectra of the object, to physiologist it is a measurable electrical activity of the nerves, to psychologist it is a complex process in brain of interpreting the nerve signal. To artist & others, it is the means to create sensation in the mind of the observes. In order to understand the colour we have to know, how the colour is perceived. The perception of colours involves the interaction of three elements.
a) Source of light
b) An object
c) Human eye
Ordinarily, in a dye house there are many industrial processes where accuracy in colour is important mainly for the human ability to differentiate and identify object and makes it for the task of colour matching and assessment to maintain quality of textile, print ink, plastic, cosmetics, food, leather, sugar, etc. According to vallia [3] in these industries either of the following methods of colour matching or assessment by visual methods is used. Colour grading is the judgment of either equality or difference in colour on surface of objects. Typical products that are colour graded are raw cotton, tobacco, fruit, vegetables and furs. In some instances, such products are accepted or rejected on the basis of visual inspection of colour specifications or standards. In colour matching, samples of a material are matched against the colour of a reference sample or standard is more exact in its requirement than colour grading. Many colours of materials or surfaces may appear to match under one type of light source but not under another. Such a match is known as metameric colour match.
Colour shading is the adjustment of the proportions of the ingredients in a mixture to improve colour conformity to a standard. It is a form of colour matching and require the same type of lighting used for colour matching. The mixing of pigments, dyes are examples in which colour shading is employed. Many misconceptions [2] exist about colour matching and assessment and it is difficult to review all aspects of this complex and fascinating subject Here, essential aspects on practical techniques & precautions to be taken are discussed which should help are to perform industrial colour matching tasks by visual methods. In Textile Industries [1] the desired colour is obtained by mixing by three or four dyes. The most important problem in the industry is how to arrive at the perfect match to customer’s samples using minimum amount of chemicals & colorants. This job is normally attended by professional colour technologists, who by his remarkable ability, the three or four dyes colour recipe to reproduce a given shade.
In Textile Industries, an expert dyeing master maintains the record of his experience in ‘shade bank’ & select one of the colour recipe which may be close to standard. He, then makes necessary changes by trial & error method to obtain the exact match. In past this task was comparatively easy with limited number of natural colours & Fibers. The colour matching has now become more difficult due to increase in manmade fibers, multi blend fibers & almost endless number of dyes available in the market. With all these parameters, the arbitrary selection of colour recipe, which may be most economical & give better quality product is almost impossible.
In last two decades the researches in colour science, advancement in optical technology & computer science have resulted into the instruments which can give number of colour recipe for a given sample. This new technology enable the dyeing master to work out several colour recipes & to select the most appropriate recipe depending on the cost of production & quality of the products required.
This technique is known as computer aided colour matching (CACM), computerized colour matching prediction (CCMP) system or Instrumental Match Prediction (IMP). The introduction of computerized colour match prediction system in any textile industry is aimed to provide a powerful tool in expert colourist’s hands to improve the quality of the products in terms of precission matching of colur at reduced cost of production. In 1958, Davidson & Hemmendinger [4] introduced an analogy computing device which took care for colour recipe formation for paint industry initially & later extended to textile application by them in 1963. At present [5] the world has switched over to a computer age & attempts are being made with the use of sophisticated, to specify & formulate the complicated techniques. Previously colour matching in textile was restricted to the skill of the dyeing masters in the dye house. But to eliminate the problem of getting in exact match of the given shade, now most of the dye house is controlled by computer colour matching technique which not only saves manpower, energy & time but also increases the accuracy.
Colour Matching is the art of reproducing the exact shade. CCMP is the science of predicting the recipe or formula for the exact shade reproduction. Hence, this technique is known by names e.g. computer colourant formulation, computer recipe prediction, Instrumental colour matching & spectrophotometer or instrumental match prediction. A colour Matching computer system involves three basic modules, viz:
a) Colour measuring instrument: Reflectance Spectrophotometer, which expresses the colour in numerical form in terms of X, Y, Z or R or K/S and DE values.
b) Computer hardware: Usually latest PC or Laptop based Computing and data analysis and storing system for data processing and converting and storing and comparing etc.
c) Specific Logic system / Colour Measuring Software to express this data into information relevant to the colourist i.e. Colour measuring and matching Software for analysis.
Keywords: Jute; Vat Dyes; Home Furnishing; Decorative Textiles
Computerized Colour Matching: Theory and Practice
Perfect colour match [6] with minimum dye cost is most important criteria for a dye house which is now computerized. The computerized colour match prediction (CCMP) for textiles are usually based on Kubelka munk equation & park & stearn’s [7] algorithms & Allen’s [8] matrix for recipe formation program. Colour matching with the aid of computer with specialized software development (based on reflectance measurement & conversion to K/S values from dyed solid textile surface) now become wide spread. Multiplication of variability’s [9] for colouration & colour measurement are reduced by various selective modes, approximation, simplification, as colour matching was done by trial & error method, restricted to the skill of dye master & no record of all trial is maintained & also matching in night shift become impossible. The strength of dye & quality of dye requires from batch to batch & on quality check for this recorded in mill. Therefore, by the application of computerized colour matching system the above problems are eliminated along with the dye cost saving, better & perfect match & quicker matching recipe generation.
Principles of Colour Matching
Colour can be measured by its tristimulas values x, y, z or by total reflectance or its derivative formula function like K/S.CIETristimulas value [5, 7] of a coloured substrates may be defined as
X=Σ Pλ xλ Rλ
Y= Σ Pλ yλ Rλ
Z= Σ Pλ zλ Rλ
Where Pλ=Spectral power distribution of standard source, Rλ=Spectral reflectance of substrate and xλ. yλ. zλ=colour factor of standard observer for red, blue and green.
To describe colour in two-dimensional plot. CIE defined following chromatically coordinates (x, y, z).
While
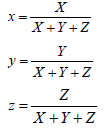
From which the saturation can be determined & from the two, the third one can be determined easily.
A colour match means: colour of produced sample =colour of given standard i.e.
(XSL, YSL, ZSL) Colour = (XSD, YSD, ZSD)
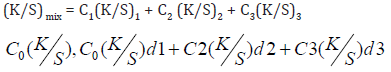
while X, Y & Z are the tristimulus value of Sample (SL) and Standard (SD) or (Reflectance)SL (400 to700 nm) =(Reflectance)SD (400 to 700 nm) or(K/S)SL =(K/S)SD while K/S = α C
For a mixture of colourants, therefore, three equations are to be solved as a function of dye concentrations of the colourants (2,3 or n) and tristimulus values measures through reflectance measurement.
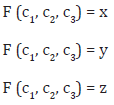
Where x, y, z are values of samples to be matched & c1, c2, c & c3 are concentration of colour required. In practice, the reflectance values at 400 to 700 nm are measured from dyed solid textile surface& those reflectance data are processed for K/S Values generation for ultimate matching. Reflectance value vs. concentration of dye is non-linear & non additive & linear, so this is used as basic data for handling colour match predicting. As per Kubelka Munk Equation.
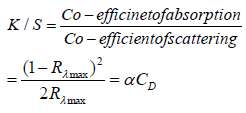
S, the coefficient of scattering; and Rʎmax, is the Reflectance value at maximum absorbance wavelength (λmax) and CD is the dye concentration and α is the constant.
For mixture of colourants,
For dyes on textiles, it is assumed that dyes do not contribute to scattering and K is the sum of dye stuff absorption and substrate absorption (substrate is fixed). Therefore K/S directly varies with concentration of dyes and scattering is independent of dye concentration (which is not the case of pigments in paint). So, in textile it is single constant theory of Colour Matching applicable for textiles. For textiles, for the particular sample (Material, Yarn & fabric construction & surface finish remaining unaltered), scattering remains constant. Thus, higher the K/S value, meant higher absorption value, meant higher absorption value signifying or indicating higher dye uptake.
More over K/S is additive in nature and hence,
Finally, reflectance Vs. dye concentration is not linear & is difficult to interpolate or curve fitting. While K/S Vs. dye concentration is linear can be interpolated thus can be used in CMM software. The total colour difference (ΔE) values are measured by measuring corresponding L*, a*, b* values before and after the treatments/ dyeing using the computer-aided reflectance spectrophotometer along with associated Colour-Lab plus software employing following CIE-Lab equations as per CIE standard-1976, to compare the shade depth of one with other comparative standard samples: -
i. ΔE = [(ΔL Calibration Samples: The dyeing conditions in the laboratory & productions differ in various respects viz, M: L ratio, auxiliaries dyeing machines, exhaustion of dye etc.
ii. Change of Substrate: It is very difficult to maintain the characteristic properties of the substrate as regards the quality of the fibers, yarn structure, fabric construction, colour, heat setting, pretreatments, etc. which in turn changes the dye uptake properties of the fiber. It is particularly impossible to prepare the basic calibration data under all such variation.
iii. Change in Dyestuff: Every incoming batch of the dye stuff requires testing for tonal & strength changes which needs recalculation of the recipe.
iv. Recipe suggested by the computer are based on minimum colour difference within given tolerance & least metamerism in CIELAB scales. But always CIELAB tolerances do not confirms exactly with human perceived colour difference.
v. Light sources used to test the match, are CIE standardized simulated standard illuminant, which are not same in all respect with natural sunlight. Instrumental accuracy may be checked periodically.
vi. The kubelka-munk equation & optical theory of computer colour matching do not apply strictly on extra glossy or fluorescent samples. In K - M equation the air scattering & interaction of air & textile substrate is not considered & therefore the K/S vs. concentration of dyes curves deviates from linearity. For practical purpose, the curve required to modify to make it linear to apply the above theory and therefore the recipe obtained from computer deviates from actual.


Chroma, (psychometric chroma) values in CIELAB color space was calculated as follows: -

Where, C*1(ab) and C*2(ab) are the chroma values for standard and produced sample.
CIE 1976 metric Hue-Difference (ΔH) for CIELAB system was calculated as follows: -

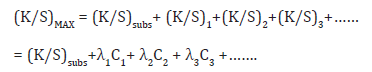
An isomeric match i.e. matches under all illuminant & when two coloured sample show match under one illuminant but do not match under any other illuminant is termed as metameric match. Least metameric match prediction & sorting is based on the calculation of general metamerism index as given below:
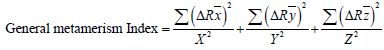
x , y , z = CIE standard observer colour function X, Y, Z = CIE tristimulas value normally taken for illuminant C .It is average of two specimens. Either the metamerism tolerance can be set or after recipe generation it is left to the user for choosing the limit for least metamerism among the number recipe generated as shown in Tables 1 & 2, in case of computerized colour matching prediction with direct dye classes on bleached jute fabric. Among the three / four alternate recipe dyer can choose as per his/her dye stock or as per requirement of Cost minimization or as per least metameric match as per requirement of customer. The match predicted is still on paper and hence dyer need to do lab dyeing with that recipe for confirmation of match obtained. This confirmation is to be done by re-measuring the produced first match dyed sample as compared against standard sample. Usually some differences are observed always, and that correction is to be done by batch correction using reformulation technique available in all computerized colour matching system of any company
Table 2: Data of a Color Match Generated from the Database of Direct Dye.

From above Table 2, it can be seen that formula 3 is the least cost and least metameric, though all of the three recipes satisfy colour tolerances values.
Colour Matching Tolerance setting is another important task for match master in industry. It is generally thumb rule that DE values below or within 1.0 are acceptable match. But in industry, people like to set more stringent tolerance for colour matching like DE value within 0.7 only. One of the major benefits of colour difference system is the ability to relate perceived colour differences between two or more objects to a numerical description of that difference in terms of total colour differences ( DE values) and also in terms of DL( light and dark) , Da ( redness and greenness) and Db ( blueness and yellowness) to help dyers to add or subtract particular colour to get better match by batch correction either manually or instrumentally
The reformulation of batch correction mathematics for computing the incremental value of concentration of dyes by each iteration at each stage are as follows:

Colour difference systems and their utility
Colour difference equations should be designed to give the extent and direction of colour difference between two samples; and do so in units that are visually meaningful. They should also provide the means to quantify sample to standard differences on a repeatable and reproducible basis. In 1976, CIE (Commission International de eclairase, Paris) colorimetry committee defined CIE L* A* B*, in short CIELAB, colour coordinates system (an easy comparative colour difference evaluation coordinates), where redness and greenness are expressed by a single number ‘a’, which is positive if it is red and negative if it is green. Similarly, yellowness or blueness is described by ‘b’. which is positive if it is yellow and negative if it is blue. ‘L’, another coordinate, represents the lightness or darkness of the colour, 0 at black 100 at white. CIELAB provides very useful colour difference space diagram, which is shown in Figure 1.
Figure 1: L*a*, b*or L, a, b colour difference space diagram.

Colour Tolerance set-up and pass/fail system
It is further necessary to develop mutually agreeable pass/fail system which specifies tolerance of these colour difference criteria for diffe¬rent textiles; these may be applicable while considering batch to batch variation. As jute mills have not procured this system so far, and those mills or their dyers are not familiar with these tolerances and computerized match prediction system etc., they may presently send their samples to nearest Centre where it is available, for necessary results, to understand the colour differences from standard sample ordered and colour differences from batch to batch variation of company production ‘level; so that chance of rejection in export level on this ground may be avoided.
To set up these tolerances is a complex phenomenon and different practical approaches are made using different colour mathematics. However, the best scientific approach is as follows:
The tristimulus values of various bulk dyed lots along with their visual assessment may be recorded and corresponding dE total, dL, da .& db and/or dL, dC & dH may be recorded and finally either is a da vs db orda vs dL plot, the visually accepted lot marked by dot and visually rejected lot marked by cross will generate a tolerance ellipse by periphery of dots of maximum distance from centre as shown in Figure 2.
Figure 2: da vs db colour plot.

To set up these tolerances is a complex phenomenon and different practical approaches are made using different colour mathematics. However, the best scientific approach is as follows:
The tristimulus values of various bulk dyed lots along with their visual assessment may be recorded and corresponding dE total, dL, da & db and/or dL, dC & dH may be recorded and finally either is a da vs db orda vs dL plot, the visually accepted lot marked by dot and visually rejected lot marked by cross will generate a tolerance.
These are symmetric and asymmetric sets of colour toler¬ances. In general, for cotton textile, if not unusually presented, the more or less symmetric colour tolerances set are:
dL = 0.7 to 1.2; da = 0.6 to 1.0 db = 0.6 to 1.0; dE = 1.0 to 1.8 For certain shades, these limits could be narrower.
The major factors responsible for batch to batch set variation are
a) Weighing error.
b) Substrate\variation.
c) Pretreatment or heat setting variation.
d) Dyeing condi¬tion change or additive variation.
e) Dye selected and purity of dye.
Steps of Colour Matching
The basic steps [5] involved in the application of the colour matching in practice can be broadly classified as:
i. Determination of optical constants by calibration dyeing and storing dye class wise and company-wise dyestuff database for a particular type of fabric.
ii. Measurement of colour value of standard samples and finding Match Recipe/formulation on computer for particular match selecting stored database for correct class of dye and putting correct/desired tolerances of colour matching to be done.
iii. Batch Correction and Recipe correction to achieve better/ precise match.
Calibration dyeing and preparation of colour data base for different classes of dyes
Optical constants are determined by measuring calibration dyeing prepared by dyeing different dyes at 6-9 different levels (say within 0.1% to 3%) which form a data bank of all the required dyes pertaining to a substance using a particular process is stored on the file of computer. Dan Randall85 explained that the preparation of reliable calibration dyeing is the first & most important step in the successful development of a colour matching program. For optimum performance, the lab dyeing process must be highly controlled & the data accurately evaluated by the colourist. The recipe formulation of the match prediction process requires measurements of shade to be matched with a substrate, the selection of dye inventory & tolerance limits of the colour differences. The tristimulus values of standard are computed for different light sources & by comparing them with optical constants of the dyes stared in the data bank the unknown concentration is determined. If the predicted recipe falls, can be corrected by the batch correction programmers. Materials of shades on the blended fabric is also essentially carried out similarly but the data banks with different dyes applied to both the components of the blend are stored separately [10].
In addition, textile colourists are required to produce a given shade many times, by using a mixture of dyes. Dye manufactures usually supply information on dyeing characteristics of an individual dye, but practically, dyers need to know the behavior of dyes in mixture, for which data are often not available. For satisfactory, uniform, barer-free dyeing with mixture of dyes, the colour should built up on the fiber in such manner that the ratio of the component dyes on the fiber remains throughout the dyeing process i.e. dyes applied in admixture should be compatible, the depth of colour increasing with constant hue. Along with visual assessment, dyeing method, diffusion test & dip test are the methods used to check the compatibility of dyes in mixture, but these methods have limitations. So, by measuring the colour of the dyed samples under commonly used illuminants; the results are recorded in terms of colour co-ordinates i.e. dl*, da*, db* & dE* in CCM technique. The computer calculated the colour differences of the sample from the standard fabric & also the colour components. Thus, this method based on the built up of total amount of dye in terms of K/S values, gives similar information about the compatibility of dyes having closely similar hues, thereby making it a more useful technique for practical dyers.
Spectrophotometer
The reflectance spectrophotometer [2] measures the reflectance of the sample separately at each wave length. For colour measurements, it records the reflectance in visible spectral region from 400-700 nm at an interval of 5nm, 10nm, 20nm as required. For textile samples, the measurements in a spectral range from 400 to 700 nm at 20 nm intervals has been happened.
The spectrophotometer marketed till this day can be classified into four distinct categories. Viz,
a) The First Generation : Prior to 1936
b) The Second Generation : 1936 - 1949
c) The Third Generation : 1949 - 1976
d) The Fourth Generation : 1976 - 2000
e) The Fifth Generation: 2001 to present
The first generation spectrophotometers were developed on the recommendations of the CIE. Despite certain limitations, encouraging results were reported, though each measurement was a lengthy and tedious process. The second generation spectrophotometers, which is considered as a standard instrument even today was developed by Hardy & manufacture by General Electric company, USA but presently manufactured by Diano Corporation, USA.
The Third generation spectrophotometers were mainly the abridged spectrophotometers based on interference filters.
The fourth and fifth generation spectrophotometers totally replaced the conventional curve plotting spectrophotometers. These new instruments are interface to general purpose mini computers which provide speed high degree of reproducibility & long-term repeatability and data storing facility. Some of the option Available in most of the CCMP system are as follows;
Calibration of instrument
The process of calibration is done so as to bring the instrument in working order.
Color (Visible Light - 400nm-700nm) is measured between maximum reflectance (100% White) and maximum absorption (100% Black). In order to set these parameters, the instrument scans a standard White tile and a standard Black tile/trap.
Quality Control
In Quality Control an incoming batch can be compared against your existing standards. Subsequent outputs can be seen in terms of Tone & Strength. A detailed analysis of the samples is done in terms of its Hue, Lightness, Saturation and its overall position in the Color space index. Quality Control will let you make a graphical as well as a statistical analysis of the measured samples.
Outputs
a) Color Difference: To see outputs of Color Difference (Graphical/Tabular).
b) Strength: To see the strength of a Sample.
c) Indices: To see Whiteness, Yellowness, and Brightness of White colored samples.
d) Combined Output: To see measurements of samples in terms of Color Difference, Strength etc.
Data Base Preparation for Textile Colour Matching
a) Selection of dyes [10]: Dye class, no of colourants (covering red, blue, green & others eliminating duplicate or near duplicate colours).
b) Preparation of Textile Sample:
i. Desizing, scouring & bleaching should be done to achieve standard whiteness.
ii. Arrangement of sample at a time from one batch so that no variation arise in basic material.
c) Dye - purity, Dye exhaustion factors etc are important in all cases.
d) Calibration dyeing using selected dyes with different concentration:
All dyeing conditions are to be same for whole set of dyeing. For each dye, 8 - 10 concentration is selected for dyeing after finding maximum shade depth to be used (say it is 3-5%). Then from 0.1- 3% or 4% or 5% shade depth, 8-9 shades are to be produced for preparation of database. Accurate weight is important in each case of dye.
e) Measurement of Reflectance & K/S Value for Samples Dyed Under Calibration Dyeing:
i. A blank sample is to be always taken and No over drying / scratching should occur.
Table 3: Database of Colour Strength and related colour parameters of bleached jute fabrics dyed with three Direct Dye.

ii. Before final entry of calibration dyeing [6] data bases for recipe formation , acceptable colour difference (DE ) tolerance , tightness/darkness tolerance , limit of k/s deviation (CV% ) from number of scan & their (K/S) measurement , limit of degree of degree of acceptable levelness for calibration dyeing , degree of linearity of the concentration of dye vs. K/S curve etc. should be predetermined from large number of samples for particular substrate & dye class separately considering also the customer’s or industries acceptance by human precipitance . An Example of Data base prepared for Direct Dyeing on Bleached jute fabric is shown below in Table 3.
Areas of Application of Computer Colour measuring and Matching System
a) Measurement of tristimulus values, reflectant at maximum absorbance wave length or K/S measurement of transmitants or absorbance from dye liquor.
b) Calculation of colour difference by CIELAB or Hunter Lab
equation 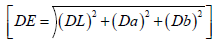 of comparison of colour
strength & colour space diagram co-ordinates etc. The shade
sort represents three-dimensional deviation from a central
point in Redness & Greenness (a), lightness Darkness (b) and
yellowness and Blueness.
of comparison of colour
strength & colour space diagram co-ordinates etc. The shade
sort represents three-dimensional deviation from a central
point in Redness & Greenness (a), lightness Darkness (b) and
yellowness and Blueness.
c) Easier computerized colour matching recipe production with least cost & least metameric recipe with the previously entered set of practical dye information.
d) Batch correction or auto correction of shades.
e) Prediction of colour matching recipe utilizing dye waste liquor.
f) Prediction of quality of incoming dyes with the help of transmittance software.
g) Prediction of whiteness or yellowness of bleached textile in difference standard scales like CIE, Hunter Lab, ASTM-E-313, Stans by etc.
h) Prediction of optical brightening agent’s efficiency utilizing the CCM device with or without UV light.
i) Quantitative prediction colour fading behaviour - instead of conventional grey scale application.
Cost Viability Analysis
[6] The major reason of interest for adopting computerized colour matching technique in mill is dye cost reduction & better & quicker match. But a very small dye house, when total dye consumption per year is very less, the adoption of CCM technique may not be cost viable. Dye cost saving is usually in the range of 10 % to 25 %.
Advantages of CCMP (Computerized Clour Match Prediction) Technique
a) Reduction in dye stuff cost by least cost recipe. (Savings may be 10 - 25 %).
b) Less dye inventory & number of alternate recipes for avoiding unavailable dye.
c) Better match (Least metameric & Least cost) with quantitative colour difference within tolerance & shade sorting as per international market system, especially for exports.
d) Technical analysis of extent of match, degree of metamerism, measurement of colour difference, whiteness & yellowness index, measurement of bleached textiles etc. are possible & also quality of incoming dye can be assured.
e) New shade development & number different light shades on sample fabric are possible to produce only with the instrumental colour matching.
f) Perfect colour matching of blended textiles is also made easier.
g) Even with the change of substrate, a nearly match prediction is possible, knowing some basic data for the substrate.
Limitation of CCMP System
a) Calibration Samples: The dyeing conditions in the laboratory & productions differ in various respects viz, M: L ratio, auxiliaries dyeing machines, exhaustion of dye etc.
b) Change of Substrate: It is very difficult to maintain the characteristic properties of the substrate as regards the quality of the fibers, yarn structure, fabric construction, colour, heat setting, pretreatments, etc. which in turn changes the dye uptake properties of the fiber. It is particularly impossible to prepare the basic calibration data under all such variation.
c) Change in Dyestuff: Every incoming batch of the dye stuff requires testing for tonal & strength changes which needs recalculation of the recipe.
d) Recipe suggested by the computer are based on minimum colour difference within given tolerance & least metamerism in CIELAB scales. But always CIELAB tolerances do not confirms exactly with human perceived colour difference.
e) Light sources used to test the match, are CIE standardized simulated standard illuminant, which are not same in all respect with natural sunlight. Instrumental accuracy may be checked periodically.
f) The kubelka-munk equation & optical theory of computer colour matching do not apply strictly on extra glossy or fluorescent samples. In K - M equation the air scattering & interaction of air & textile substrate is not considered & therefore the K/S vs. concentration of dyes curves deviates from linearity. For practical purpose, the curve required to modify to make it linear to apply the above theory and therefore the recipe obtained from computer deviates from actual.
Other Application of CCMP System in Dye House
a) For quality control of dyed textiles.
b) For Evaluation of Quality of dyes supplied.
c) Role of dyeing additives by measuring colour yield.
d) Efficiency of optical brighteners by UV analysis.
e) Soil removal efficiency of surfactants by measuring Reflectance value.
f) Measurement of whiteness/yellowness/brightness index etc.
Some Practical Consideration During Measurement on CCMP System
The practical aspects of data base generating match generation using a data base, setting up proper DE or multiple colour tolerance & above all accurate spectrophotometer measurement depends on following factors.
a) Level / Un level dyeing (Usually Less than 5% CV of K/S Value is taken as level dyeing for textiles).
b) Back ground opaqueness of the sample (No. of Fold are to be kept Constant.
c) Sample orientation (warp wise or weft wise vertical measurement may differ colour value).
d) Sample surface structure/texture (Any Treatment before dyeing may change surface texture and scattering value and hence may change k/s value also).
e) Two sideness (Colour value in one face of fabric may sometimes differ from other face).
f) Slubbing/Defects in fabric (Any defect of the fabric on surface may cause colour variation).
g) Dull shade / Fluorescent colour & bright shade etc., sometimes behave differently.
Linearity and Non-linearity in Recipe Calculations
The success of computer colour matching depends on the accuracy with which the optical data file is prepared. The theory of computer aided colour matching mainly depends on linearity of K-M function with dye concentration. In fact, this linear relation doesn’t exist. The deviation from linearity of K-M function with dye concentration may be due to inherent deficiency in theory, nonlinear uptake of dye with increase in concentration by the fibre and/or the interaction between dyes during the dyeing process. Saha & Gandhi [2] stated that the function of reflectance which gives approximate linear relation with dye concentration as per Kubelka and Munk function, but practically sometimes all dyes do not exhibit satisfactory linear relation in a plot between K/S value vs dye concentration, Therefore, with the help of number of empirical modifications to the equation of K-M functions (K/S value) this linearization is to be done for effective match prediction.
In many cases of dyed textiles, the deviation from linear relationship between reflectance and concentration is considerably high due to variation in exhaustion of dye at higher percentage of dyeing and also for many other reasons. For such case the absorption co-efficient of dye is calculated at about eight -ten level of dyeing and linearization is to be done either ommitinmg certain concentrations or by repeated dyeing and then to be stored in the computer memory as database for use of determining colour matching recipe /formulations, with prescribed standard tolerances of colour differences (DE, DL, Da, Db values under standard illuminants).
Concluding Remarks
At the end, it may be said that after necessary training and guidance, this Instrument of CCMP system can be used successfully for its versatile use including Computer Aided Colour measuring and Matching purpose which needs to be implemented in all dye houses of either all textile dyeing or jute dyeing to derive the above said benefits of precession matching and customer satisfaction.
References
- Trottman ER (1995) Dyeing and Chemical Technology of Textile fibres Charles Griffin & Co. Ltd, London.
- Shah HS, Gandhi RS (1990) Instrumental Colour Measurements & Computer-r Aided Colour Matching for Textiles, Mahajan Book Distributers, Ahmedabad, India pp. 370.
- Valia A T (1990) Print in India (10): 53-58.
- Davidson H R, Hemmendinger (1963) J Soc Dyers & Color 79: 577-585.
- Patil SM, Shelke V (1990) Thakur Mrinal, Man-made Textiles in India (2): 53-58.
- Samanta AK (1993) Textile Trend (10): 37-47.
- Park RH, Stearns EI (19444) J Opt Soc Amer 34.
- Allen E (1966) J Opt Soc Amer 56:1256-1299
- Patwardhan SS, Wool Res Asson (1977) Thane, India.
- Randall D, Stutts T (1988) Amer Dyestuff Reporter, (8) 44-46.


-

Mark E Smith
Bio chemistry
University of Texas Medical Branch, USA -

Lawrence A Presley
Department of Criminal Justice
Liberty University, USA -

Thomas W Miller
Department of Psychiatry
University of Kentucky, USA -

Gjumrakch Aliev
Department of Medicine
Gally International Biomedical Research & Consulting LLC, USA -

Christopher Bryant
Department of Urbanisation and Agricultural
Montreal university, USA -

Robert William Frare
Oral & Maxillofacial Pathology
New York University, USA -

Rudolph Modesto Navari
Gastroenterology and Hepatology
University of Alabama, UK -

Andrew Hague
Department of Medicine
Universities of Bradford, UK -

George Gregory Buttigieg
Maltese College of Obstetrics and Gynaecology, Europe -

Chen-Hsiung Yeh
Oncology
Circulogene Theranostics, England -
.png)
Emilio Bucio-Carrillo
Radiation Chemistry
National University of Mexico, USA -
.jpg)
Casey J Grenier
Analytical Chemistry
Wentworth Institute of Technology, USA -

Hany Atalah
Minimally Invasive Surgery
Mercer University school of Medicine, USA -

Abu-Hussein Muhamad
Pediatric Dentistry
University of Athens , Greece
