Lupine Publishers Group
Lupine Publishers
Menu
ISSN: 2641-6794
Editorial(ISSN: 2641-6794) 
Selected Methods of Spatial Analysis of Soils of Azerbaijan Volume 1 - Issue 1
RAE Aliyev ZH*
- Institute for soil science and Agrochemistry of the NAS of Azerbaijan, Azerbaijan
Received: July 27, 2018; Published: August 06, 2018
Corresponding author: RAE Aliyev ZH, Institute for soil science and Agrochemistry of the NAS of Azerbaijan, Azerbaijan
DOI: 10.32474/OAJESS.2018.01.000103
Editorial
Spatial analysis in GIS Wednesday is based on complex techniques, the results of which depend on the raw data. One of the fundamentals of spatial analysis techniques based on digital hypsometric model is the development of maps of the angles. She gained widespread use, from morphogenetic and geologicalengineering perspective to the agrarian and territorial planning.
Progress of Research and Discussion of Materials
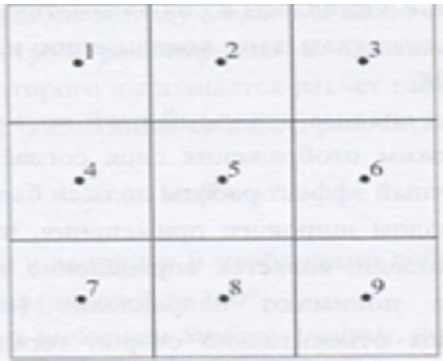
Program Arc Map provides the ability to quickly prepare this type of cards based on raster model hypsometric territory. To calculate the slope of a surface that is specific to a particular screen, used values of absolute height, raised eight surrounding screens (Figure 1). The calculated values of the two parameters (ɑ and (b)), proportional average slant of slope (respectively on the x and y axis) according to the following formulae:
ɑ = (h3+2h6+h9-h1-2h4 - (h)7 )/8L (1)
(b)=(h1+2h2+h3-h7-2h8 - (h)9 )/8L
Where is:
(h)1 = the absolute height of the surface of the territory in (i) -OM image according to (Figure 1).
L = raster measurement.
The angle of the slope, plant in the central point is cal
tan ɑ= √a2 + b2 (2).
a) In the menu Spatial Analyst pick Surfase Analysis, then Slopethat will lead to opening the window method.
b) With list boxes Input surface Choose created a digital model of the hypsometric of Azerbaijan.
c) The main unit can be marked graphs slope measurement slope on the resultant map-in variant degrees ( Degree) or as a percentage (option) Percent
d) Graphs Z Factor and Output cell size perform the same role as in the Hillshade. Leave them automatic size.
e) In the graph Output raster point localization and name of the source file, then- OK.
f) After completion of the analysis of the source layer appears in the map image.
g) Change the layer display mode according to the technique described previously.
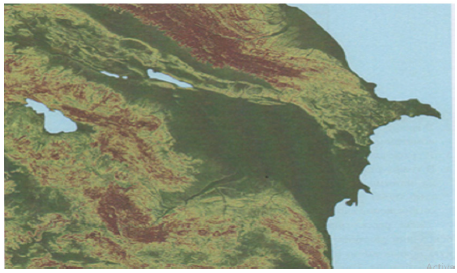
h) The final effect should be similar to (Figure 2).
i) The following method of broad application that is based on digital hypsometric model is the definition of exposure [1].
Under slope Exposition, understand the direction (azimuth) slope steepness of most to the sides of the horizon.
This option is very important for those kinds of analysis that takes into account the difference of thermal balance of the northern and southern slopes.
This is the initial value for aspects such as the time of occurrence of snow cover duration of vegetation period etc. The method of calculation is similar to the method Slope . It also used high-altitude data from screens placed in the immediate vicinity of the Central screen, for which the calculation of parameters (a) and (b) (in accordance with identical formulas) [2].
Exposition of slopeis calculated as:
tan ß=a/b (3)
If (b) positively, the largest Add 180°, that allows to take into account the magnitude of the azimuth from 0 to 360°.
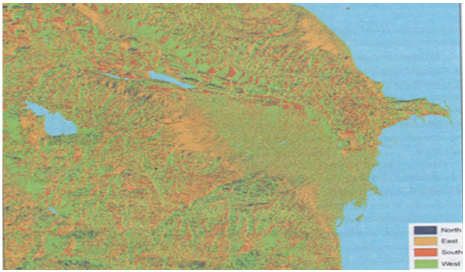
a) In menu Spatial Analyst choose a Surface Analysis, then Aspect-method dialog box appears (Figure 3)
Figure 3: Angular slopes map developed in accordance with method S lope based on a digital model of Azerbaijan hypsometric.
b) In box Input surface traditionally make the filename digitally hypsometric model.
c) In box Output cell size leave unattended.
In box Output raster denote localization and name of the source file, click OK to start following their completion, payments to the image will be added effective map. After you change the display card is similar to (Figure 3). Next, consider the way to an integrated spatial analysis based on raster maps. For example, suppose you want to select a specific localization hypothetical potential investments on the territory of Azerbaijan. Investor demands that the investing territory meets certain conditions. First, the angle of the slopes in the territory’s investment should not exceed 10°. Secondly, the investment should be within the absolute height of surface from 100 to 500 mnm. Using GIS and digital hypsometric model of Azerbaijan (with derived layers), the definition of localizations of this investment takes a few minutes. In menu Spatial Analyst toolbar Select position Raster Calculator. A dialog box appears, represented in the left part of the window, in the Layers highlighted all raster layers project. With right sides are mathematical logical operators that can be used for entering formulas. The formulas are based on arithmetic operators, and the results have a numeric expression. For example, if you want to double increase digital hypsometric model, it is possible to formulate a simple expression: [CGM]. where instead of CGM, you must enter the name of the selected raster layer surface model. As a result of this operation received a raster map, where each point in discrete space is assigned a numerical value, which corresponds to doubling the height of the territory. Such arithmetic operations can be applied to other sectors. For example, having a layer of embossed field precipitation, as well as layer with spatial distribution of filtration coefficient, obtained by multiplying the two layers you can obtain the spatial distribution of effective infiltration of precipitation. Often also used the differencing method. In this way, create a differential maps that document the temporarily-spatial variability of the investigated phenomenon. For example, as a result of the seizure of average precipitation from the actual over the past two years, it is possible to define the territory increases and regression of this phenomenon [4-6].
Use this type of expression to identify the territory within Azerbaijan, which satisfies the conditions of investra. First define the territory where the inclination does not exceed slopes 100.
This requires the formulation of the next task
[Slope] < = 10. (4)
Where on the graph Slope you must submit the name of a bitmap layer with angles of inclination of slopes.
Formulation of issues using Windows Raster Calculator is simple enough:
i. In the graph Layers Select the name of the layer with the angles of inclination of slopes. Note that added layer automatically enclosed in quotation marks.
ii. Of the symbols of the operators choose < =. This results in adding this element to the expression.
Citation: RAE Aliyev ZH. Selected Methods of Spatial Analysis of Soils of Azerbaijan. Open Acc J Envi Soi Sci 1(1)- 2018. OAJESS.MS.ID.000103. 18 iii. Using digital signs in a window or on the keyboard, type 10 in the end of the expression.
iv. The formula is ready, you can go to to do so. Evaluate.
Upon completion of the calculations in the working area of the project will add a new layer using the program Calculation . Layer is only with greatness and 0 1.
Screens marked digital 1, satisfy the conditions of maximum slope slopes up to 10 largest° . Now you must select the area that meets the requirements of investra for its absolute height. To do this, construct the following expression (5) [7-10]:
[CGM] > = 100 and [CGM] < = 500 (5)
On site CGM enter the name of a raster layer with digital hypsometric model territory. For formulating expressions use window Raster Calculator .
a) In Windows Raster Calculator Select layer with digital hypsometric model of Azerbaijani territory in the graph Layers.
b) press the key with the operator > =
c) Enter the value 100
d) Push And
e) Again click on the layer name in the CGM graph Layers.
f) Push the button with the < = operator
g) Enter the value 500
h) Check the correctness of the formula and select Evaluate.
The result of the calculations is a raster layer named program Calculation . 2. similar to the previous layer here showing screens marked cifroj1 that identify the territory, where high-rise relevant criteria. now you must connect both layers to define the territory corresponding to two requirements-surface height and tilt. Use the method the Raster Calculator [11-12].
a) press twice on the layer Calculation in the graph Layers.
b) Select the = operator
c) Enter the value 1.
d) Choose the logical operator And
e) twice click on layer Calculation2.
f) Select the = operator
g) Enter the value 1.
h) The final expression must be of the form:
[Calculation] = 1 & [Calculation2] = 1
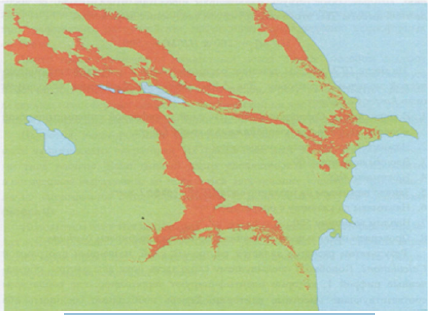
i) Click on Evaluate. In the working area will be added a new layer with the designated (red) territory, which satisfies the requirements of the investor (Figure 4) [13-15].
The resulting image points to a very extensive array, located in the foothill zone of Azerbaijan. It is clear that in such a large territory does not satisfy any investor to potential localization object. In this regard, you can narrow the boundary parameters of each criterion. For example, the choice of the territory where the inclination does not exceed 1 degree. In the analysis process can also take into account additional criteria, such as location, investment plot at a distance of not less than 500 m from the nearest coastline and 1000 m from the urban areas (Figure 5). The possibilities are endless and depend solely on the needs of the user of GIS and spatial information availability [15-18].
Figure 5: Result of the spatial analysis to define the territory of Azerbaijan, the relevant requirements of the investor.
References
- Alekperov k (1980) Pochvoezionnaya map and land protection, Moscow
- Aliyev BH, Aliyev ZH (2000) erosion Problems in Azerbaijan and ways of its solution. IZD-vo Zia-CPI “Naji.
- H Aliev, Aliev ZH (2001) Zoning of the territory of Azerbaijan Republic on choosing advanced irrigation techniques. Baku, pp. 297.
- Bonham Carter GF (1994) Geographic Information Systems for land resources assessment, larendon Press, Oxford, USA.
- Berry K (2006) Mar Ayalesis. Procedures and Application in GIS Modeling, BASIS Press.
- Wang f (2006) Quantitative Methods and Application in GIS, Taylor & Francis, Boca Raton, London, New York, pp.265.
- Webster R Oliver MA (2001) Geostatistics Scientists, John Wiley & Sons.
- Clarke KC (1995) Analytical and Computer Report, Prentice Hall, USA.
- Convis cl Jr (2003) Conversation Geography Case Studies in GIS, Computer Mapping and Activism, ESRI Press.
- D M E Mers N (2002) GIS modeling in raster, JohnWiley & Sons.
- Litwin lg (2005) Myrda Systems Informacji Geograficznej, Helion
- Lisseland TM, Kiefer RW (1994) Remote Sensing and Image Interpretation. John Wiley & Sons, New York.
- Longley PA, Goodchild MF, Maguire D, Rhind DW (2005) Geographical Information Systems: Principles, Techniques, Management and Applications (abridged edition), Hoboken nj Wiley, USA.
- Longley PA, Goodchild MF, Maguire DJ, Rhind DW (2005) Geographic Information Syestems and Science, (2nd edn.), John Wiley & Sons, USA
- Tomlin CD (1990) Geographic Information Systems and by modeling, Prentice Hall, New Jersey, USA
- . Jacek Urbanski (1997) Zrozumiec GIS. Analiza Informacji, Wydawnictwo Naukowe PWN przestrzennej.
- Jacek Urbanski (2001) Modelowanie kartograficzne strefy brzegoej morza, Wydawnictwo Uniwersytetu Gdanskego.
- (2012) J Urban Training Manual-GIS in studies of nature.

Top Editors
-

Mark E Smith
Bio chemistry
University of Texas Medical Branch, USA -

Lawrence A Presley
Department of Criminal Justice
Liberty University, USA -

Thomas W Miller
Department of Psychiatry
University of Kentucky, USA -

Gjumrakch Aliev
Department of Medicine
Gally International Biomedical Research & Consulting LLC, USA -

Christopher Bryant
Department of Urbanisation and Agricultural
Montreal university, USA -

Robert William Frare
Oral & Maxillofacial Pathology
New York University, USA -

Rudolph Modesto Navari
Gastroenterology and Hepatology
University of Alabama, UK -

Andrew Hague
Department of Medicine
Universities of Bradford, UK -

George Gregory Buttigieg
Maltese College of Obstetrics and Gynaecology, Europe -

Chen-Hsiung Yeh
Oncology
Circulogene Theranostics, England -
.png)
Emilio Bucio-Carrillo
Radiation Chemistry
National University of Mexico, USA -
.jpg)
Casey J Grenier
Analytical Chemistry
Wentworth Institute of Technology, USA -
Hany Atalah
Minimally Invasive Surgery
Mercer University school of Medicine, USA -

Abu-Hussein Muhamad
Pediatric Dentistry
University of Athens , Greece

The annual scholar awards from Lupine Publishers honor a selected number Read More...


