Lupine Publishers Group
Lupine Publishers
Menu
ISSN: 2641-6794
Mini Review2641-6794 
Assessing Biodiversity and Carbon Estimation of Tree Outsides of Forest in Parwanipur Rural Municipality of Central Nepal Volume 6 - Issue 1
Divyanshu Pandey1, Yogendra Yadav2*, Jeetendra Gautam3 and Ramesh Kumar Pandey4
- 1Principal Author: Divyanshu Pandey, Faculty of Forestry, Agriculture and Forestry University, Nepal
- 2Assistant Professor, Institute of Forestry Hetauda, Tribhuvan University, Nepal
- 3Assistant Professor, Faculty of Forestry, Agriculture and Forestry University, Nepal
- 4Professor, Faculty of Forestry, Agriculture and Forestry University, Nepal
Received: April 4, 2021 Published: April 30, 2021
Corresponding author:Yogendra Yadav, Institute of Forestry Hetauda, Tribhuvan University, Nepal
DOI: 10.32474/OAJESS.2021.06.000231
Abstract
Trees outside forests (TOFs) are important natural resources that contribute substantially to national biomass and carbon stocks in many regions of the world. This paper assesses and quantify the status of distribution, tree diversity, carbon estimation in TOFs of Parwanipur rural municipality. The data was collected by stratified random sampling with sampling intensity 0.45% and strata was laid randomly in accordance with the TOFs present in the area with circular plot of radius 17.84m. Firstly, tree measurement was done of Gbh>15cm and then soil samples were collected from each sample plot of depth 0-10cm, 10-20cm and 20-30cm, respectively. The higher distribution of carbon biomass is found in Eucalyptus camaldulensis(97.39tha-1), lowest in Azadirachta indica (0.36tha-1) within TOF. According to land use, TOFs in agriculture and urban has occupied 89.37ha and 198.83ha, respectively. The total average carbon stock of TOFs was found to be higher in urban (70.21 tha-1) than that in agricultural land use (84.31tha-1). A decreasing trend in soil organic carbon was seen for both the land uses with increase in soil depths, but on contrary, an increasing trend was observed in terms of bulk density with increase in soil depths. The total SOC stock within TOF present in urban and agriculture followed the order as Urban>Agriculture with the total SOC stock of each land use being 39.22t ha-1and 36.17 t ha-1respectively. A linear relationship was found between SOC stock and organic carbon percentage for both the types of land use where TOF is present but in terms of bulk density and total SOC content no linear relationship was found. Shannon-Weiner and Simpson biodiversity index of TOFs was found higher in urban (H=1.91, D=0.83) than that in agriculture land use (H=1.44, D= 0.68) respectively. ANOVA test (P=0.05) shows that means stocks of soil organic carbon do differ significantly at soil depths 0-10, 10-20 and 20-30 cm respectively in TOFs in Urban. The results, thus, indicate that TOFs in urban land have greater distribution in terms of area occupied, average carbon stock, and tree species diversity than that of TOFs in agricultural land so proper agro-forestry scheme should be promoted in study area to improve those all-in agricultural land too.
Keywords: Biomass; Growing stock; Soil carbon; Tree outside forest; Tree diversity
Introduction
According to definitions of ‘forests and other wooded land’ of Food and Agriculture Organization FAO [12], in the world there are billions of trees that are not included in the Forest Resources Assessment 2000.As defined by FAO [12], Tree outsides forests (TOFs) are the trees resources that occurs in all land use categories outsides the recorded forest area. Trees outside forest (TOF) generally includes tress on farmlands, in cities and human settlement, orchards, sides of roads, pastures, riverbanks, streams and canal and as shelterbelts which are less than 20m wide and 0.5 ha area and are usually found in lands do not characterize as forest and other wooded land FAO [12]. According to FAO [13], there are mainly three topologies of TOFs i.e TOF-Agriculture (TOF-AGRI), TOF-Urban (TOF-Urb) and TOF-Non-Agriculture/Urban (TOF-NONA/ U). TOF-AGRI encompasses all lands with trees and/or shrubs whatever their spatial pattern (in line, in stands, scattered) with the area ≥ 0.05 ha, the canopy cover is ≥ 5% if trees are present, or ≥ 10% if combined trees, bushes and shrubs, the width ≥ 3 m and the length ≥ 25 m and are present predominantly under an agricultural use FAO [13]. Similarly, TOF-URB encompassed all lands with trees and/or shrubs whatever their spatial pattern (in line, in stands, scattered), with the area ≥ 0.05 ha, the canopy cover is ≥ 5% if trees are present, or ≥ 10% if combined trees, bushes and shrubs, the width ≥ 3 m and the length ≥ 25 m and are present predominantly under an urban use FAO [13].Private gardens for fruit production are managed by people with fewer restraint on space in urban peripheries Eriksen-Hamel Danso et al. [11]; Lovell, 2010).In rural and urban settings, TOF covers a wide array of formations and species growing in various consolidation Acharya [1].
According to FAO [13], more than 10 percent tree cover is covered by approximately 10 million km² of agriculture area which is 46 percent of the total agriculture land of world. In other words, if the land-use were not agriculture, these 10 million km² would have been included in Forest FAO [13]. More often, the private plantation is considered as TOF as there is no clear record of TOF in context of Nepal Yadav et al. [30]. In Nepal, 10,240 ha is the estimated record area of TOF DoF [9]. These forests are ignored in forest assessments, but they also play a significant role in enhancement of carbon stock, biodiversity conservation, carbon sequestration and livelihood support throughout the world. Since TOF are mostly absent from forest inventories very less is recognize about the drivers of TOF spatial distribution either in urbanized or in agricultural landscapes (Rossi et al. 2016). In mid-hills of Nepal, TOF offer multiple benefits, great opportunities by decreasing negative effects of climate change and increasing farm income (increasing the contribution) from agroforestry Pandit et al. [26].
Many ecological functions like conservation of biodiversity and carbon sequestration are embrace by TOF Schroeder [27]; Rawat et al., 2004; FAO [13]. It is stated that that, TOF stored substantial amounts of carbon is in live biomass which also cause a local increase in soil organic carbon (Follain et al., 2007). TOF plays an important role for storing the valuable vegetation carbon and plant biodiversity conservation (Mandal et al. [24]. In rural and urban areas TOF is consider as a great capital for carbon sequestration, biodiversity conservation, climatic stabilization, and livelihood support Acharya [1]; Pandey [25]. It reduces pressure exerting on national forest as these forests occur outside of defined forest and made important positive contributions on conservation of biodiversity NBSAP [17]. Through improved growth of trees and shrubs (TOF) in agroforestry setup which implies removing and retaining atmospheric carbon, it has gain significant importance in context of climate change Pandey [25]. Vital economic services are ensured by farmers in agroforestry system by planting diverse tree species assemblages such as rubber or damar agroforest etc. FAO [13]. In relation to the capacity of carbon stock and biodiversity, forest and TOF are considered as two faces of a same coin Kleinn [19]. Contrary to the other treed land uses, many forest animal and plant species gets their habitat which ensures significant biodiversity conservation Michon et al. [18] de Foresta et al. [18]; Beukema et al., 2007; Bhagwat et al., 2008; Idol et al., 2011). Similarly, the benefit of TOF enhancement is that it reduces pressure on natural forest in one way thereby enhancing carbon stock and species diversity in other way Singh et al. [28]; Thompson, et al. 2009). This meets the global goal of the Reducing Emission from Deforestation and Forest Degradation (REDD +) mechanism. The objective of this research was to document status of distribution of TOFs, estimate carbon stocks of above and below ground and to identify tree species diversity of trees outside forest in study site.
Materials and methods
Study Area
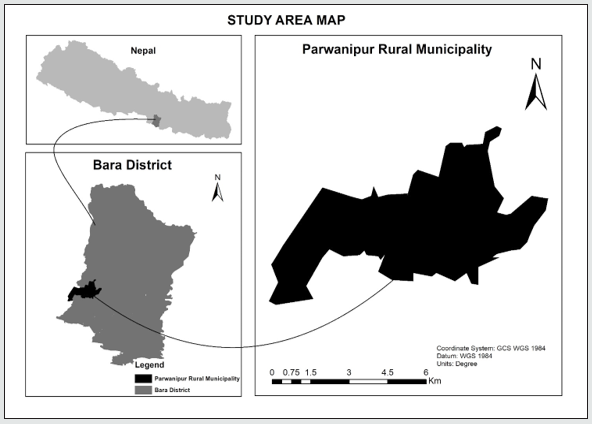
The Research work was carried out in the existing Trees Outside Forests of Parwanipur Rural Municipality in Bara district. Bara district lies in central region of Nepal. It lies in 260 51’ north to 2702’ longitude and 840 51’ to 850 16’ east latitude. The area of Bara district is 1190 sq. Km. Parwanipur is one of the municipalities of Bara District with total area of 15.5 km² and total population with 22,787 of which 11,914 are male and 10,873 are females CBS [5]. The different castes residing in this municipality are Muslims, Yadav, Teli, Kurmi, Dhanuk, Dusadh/Pasawan/Pasi, Brahman-Tarai, MallahaKalwar, Hajjam/Thakur, Kaun, Dhobi, Nuniya, Kumhar, Haluwai, Mali, Dom, and others. The people speak mainly Bhojpuri, Maithili, Nepali language. Mostly farmers of this municipality are growing fruit trees in their own land such as Mangifera indica, Agelemarmelous, etc and growing Eucalyptus camaldulensis, Dalbergia sissoo, Albizzia lee back, Tectona grandis, Bombax ceiba etc for timber purpose.
Sampling Design and Site Selection Criteria:
Site Selection Criteria: The followings are two major criteria set for site selection:
a) Area covers different land use patterns, and the study area was quite far from forest area, so it was best site for research in Trees outside the Forest (TOF).
b) Local people are active to participate in managing TOF’s and cooperate in this study with interest.
Sampling Design
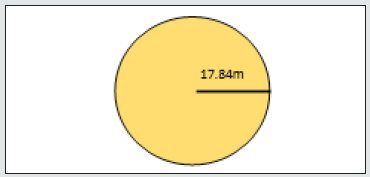
Stratified random sampling with 0.45% sampling intensity was applied to layout the sample plots in the study area. The strata were laid accordance to the TOF present in the study area according to air interpretation guideline of TOFs given by FAO [13]. Then, the plot size of 1,000 m2 (0.1 ha) in a circular shape having radius of 17.84 m as shown in (Figure 1 and Figure 2) with sampling intensity 0.45% was laid out into strata of TOF present in the study area ITTO [20]. Sample plot Allocation: The sample plots was distributed in stratified random manner using ArcGIS. Then the coordinates of sample plots were recorded and uploaded in GPS receiver (Table 1).
Sample Plot Alignment
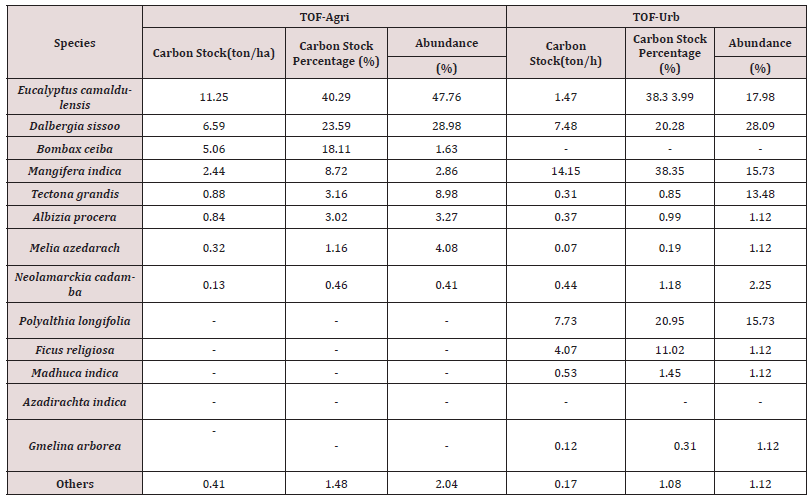
Table 2: Distribution of Avg. above ground Carbon stock, Carbon stock percentage and abundance (%) by species in TOF-Urb (Urban)& TOF-Agri (Agriculture).
GPS receiver was used to find the center point coordinates of sample plot in the field (Table 2).
Data Collection
Height and diameter at breast height of tree attributes of GBH greater than or equal to 15 cm, will be measured and recorded in tally sheet IITO [20]. Sunto-clinometer was used for height measurement of tree whereas metric tape is used to measure its Gbh. Sample plot for soil analysis will be laid on centre of plot on the ground. Then, soil samples were collected from 0-10, 11-20 and 21-30cm depth using the known volume of soil corer ANSAB [4] and fresh weight of these samples was taken, label and packed in plastic bag for lab analysis. Information regarding name of species and number of individuals was gathered from 100 m2 areas from allocated sample plots to show the variation in biodiversity within TOFs (Table 3).
Biomass and carbon calculation:
To estimate above ground biomass and carbon stock of the TOF:
Above ground tree biomass in kg (AGTB) =0.0509´rD2h Chave et al. [6].
where, r is Dry wood Density (g/m3), D is diameter at breast height in centimeter, h is height of tree in meter Then 47.5% carbon (IPCC default value) in woody biomass will be considered for carbon content estimation (Table 4).
Above ground carbon content = 0.475×AGTB (ANSAB, 2010)
Below ground biomass and carbon
Root carbon: it will be calculated by multiplying the above ground carbon with 20% ANSAB [4].
Soil carbon obtained by lab test. Firstly, bulk density will be calculated and carbon % will be calculated.
Bulk Density (BD g/cc) = (oven dry weight of soil)/ (volume of soil in the core).
SOC= Organic Carbon Content % * Soil Bulk Density (g/cc) * thickens of horizon
Total carbon= above ground carbon+ below ground carbon (where, below ground Carbon = SOC + Root Carbon)
Biodiversity calculation:
Mainly the Shannon Weinner and Simpson Index will be used to calculate the forest biodiversity. The formulae are given below.
Shannon-Weiner Biodiversity Index:
“H” represents the symbol for diversity in an ecosystem.
Simpson Biodiversity Index:
Where D= Simpson Biodiversity Index, N= total number of individuals n=number of individuals of ith species as shown in (Table 5).
Results
Current Status of distribution of TOF:
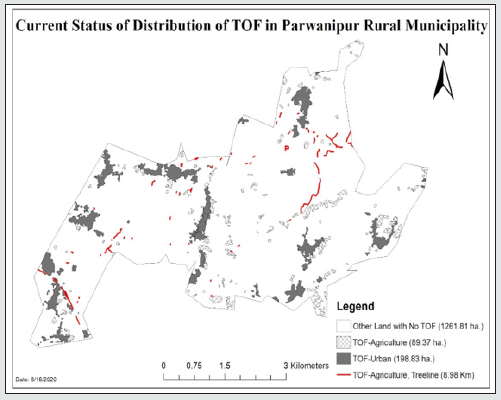
Total area of Parwanipur Rural Municiality is 1550 ha out of which TOF- Agri and TOF- Urb were found to be 89.37 ha and 198.83 ha, respectively. Similarly, TOF- Agri, Tree line was found to be 8.98km and other land with no TOF was 1261.81 ha as shown in (Figure 3 and Figure 4).
Figure 3: Final Digitalize Map of study area in accordance with TOFs present with reference to guideline. FAO, 2013.
Relative Abundance AGTB And Carbon Stock Distribution by Species
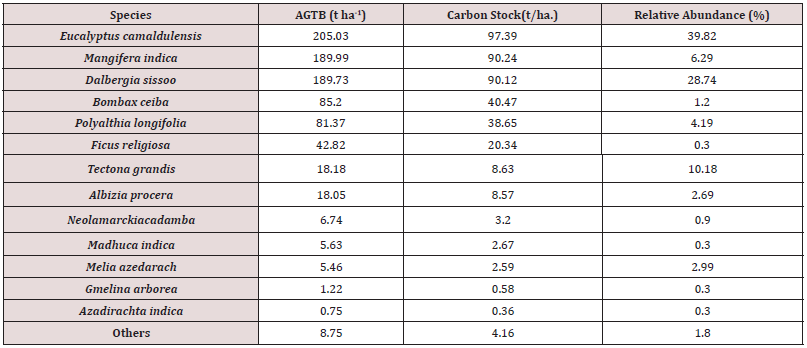
Eucalyptus camaldulensis (39%), Dalbergia sissoo (28.74%), Tectona grandis (10.18%) and Mangifera indica (6.29%) were the most four abundant species of TOFs found in the study area with Eucalyptus camaldulensis having highest AGTB (205.03 t ha-1) and carbon stock (97.39 t ha-1) share respectively (Table 1). Being the lower abundant in number Mangifera indica (6.29%) with respect to Dalbergia sissoo (28.74%) and Tectona grandis (10.18%), Mangifera indica occupies the second highest position in carbon stock storage. The main reason behind it can be their presence with bigger girth and mature trees in the study area. Similarly, Azadirachta indica represents the lowest AGTB (0.75 t ha-1) and carbon stock (0.36 t ha-1) share, respectively as show in (Table 6).
Relation between BD SOC percentage and Total SOC
The study concluded there is a linear relationship (adjusted R2 value 0.91 and 0.94 for Agriculture and Urban respectively) between SOC stock and organic carbon percentage for these two types of land use where TOF is present (Figures 5 and Figure 6). However, there was no linear relationship (adjusted R2 value 0.11, and 0.01 for Agriculture and Urban respectively) between bulk density and total SOC content. This justified that the quantity of organic carbon stored in the soil is driven by SOC percentage and BD. Thus, improvement of SOC percentage and soil quality maintenance is an important intervention to increase SOC storage capacity.
Figure 5: (a) SOC content (t ha -1) and BD (g cm), (b) SOC Content (t ha-1) with organic carbon content percentage of TOFAgriculture.
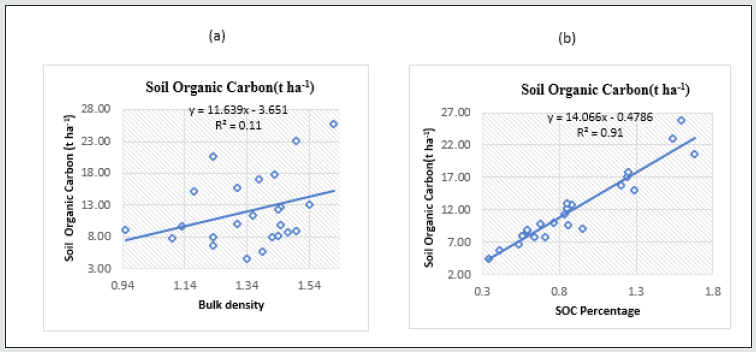
Figure 6: (a) SOC content (t ha -1) and BD (g cm), (b) SOC Content (t ha-1) with organic carbon content percentage of TOFUrban.

Distribution of Average above ground Biomass, Average above ground carbon, below ground carbon and Total Average Carbon (ton ha-1) with respect to land use (LU)
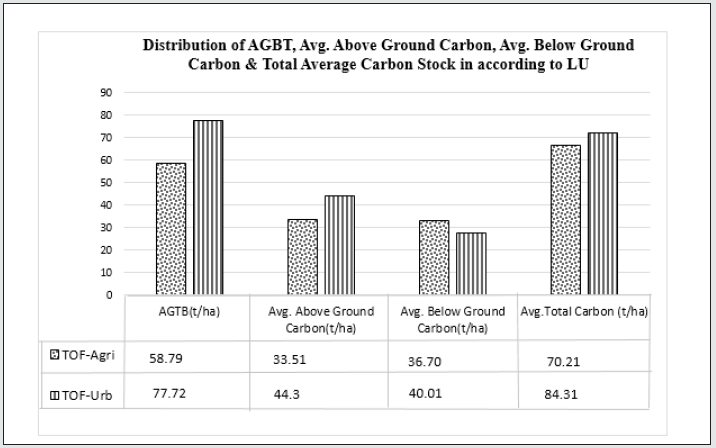
Comparison of average carbon stock in urban and agricultural land gives some insight into the management effect on total carbon stock in study area. It indicates that land use practices have made significant impact on total carbon stock. Total average carbon stock was found to be higher in TOF-Urban (84.31t ha-1) than that in TOF-Agriculture (70.21 t ha-1) as shown in (figure 7). There a son behind the highest average carbon stock in TOF-Urban was the presence of TOF in good numbers along with good AGTB, above ground carbon and below ground carbon as compared to agricultural land as shown in (figure 7).
Figure 7: Distribution of AGBT, Avg. Above Ground Carbon, Avg. Below Ground Carbon & Total Average Carbon Stock in according to LU.
Biodiversity Index of TOFs by Land Use
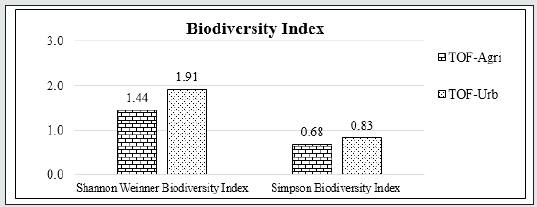
As shown in (figure 8), Shannon Weinner index and Simpson biodiversity index of TOF-Urb (H=1.91, D=0.83) is higher than that of TOF-Agri (H=1.44, D= 0.68) i.e biodiversity and abundance within tree species of TOFs species in TOF-Urb is higher than TOFAgri, respectively as shown in (Table 7).
Discussion
According to Amatya et al. (2002), in Terai Mangifera indica was the major tree species planted by famers in farm where as Eucalyptus camaldulensis and Dalbergia sissoo were the major forest tree species. This research also found that in urban use farmland Mangifera indica and Eucalyptus camaldulensis are major planted tree species whereas in Agricultural use farmland Eucalyptus camaldulensis, Dalbergia sissoo and Tectona grandis is major tree species planted. In farm garden of terai region of Nepal, it was found that 10.255 tha-1is the total mean biomass carbon stock Kafle [12]. This research found the result which is greater i.e 31.38 tha-1 respectively and it might be due to presence of higher diameter and height class tree in the study area.
Soil organic carbon stock up to 30cm soil depth in agriculture land occupied by trees on farms was found to be 55.044 tha-1 in Kanchanpur District DoF [9]. This research found the result which is smaller i.e 36.17 tha-1 in TOF-Agriculture. The main reason behind it can be difference in management intervention introduced to manage SOC as study area is different. Dalbergia sissoo was the species having highest relative abundance in Pipara VDC of Mahottari district in terai region within TOFs Jha [12]. The result of present research is contrary to studies done by Jha [12]. The carbon stock in terai region by tree component and soil organic carbon is found to be 104.47 t ha-1 and 33.66 tha-1 respectively DFRS [8]. This study also shows nearly similar results in terms of soil organic carbon which is quite greateri. e36.17 tha-1in TOF-Agriculture and 39.22 tha-1in TOF-Urban with respect to result concluded by DFRS [8]. The main reason behind it can be it include the results of agricultural and urban land of whole terai where tree components (TOFs) are present, not the results of where tree components are not present. Similarly, in terms of tree component carbon stock was found to be lesser in comparison to result conducted by DFRS [8] as it includes the results of TOFs component only. The soil bulk density to be 1.38 gcm-3of Terai in the home garden with tree Kafle [12]. This study also found close to similar result i.e in TOF-Urban 1.33 gcm-3 and in TOF-Agriculture 1.35 gcm-3. Chaudhari et al. [7] reported that with increasing soil depth the organic matter content of soil decreases, and which leads to decrease in porosity of soil and to the compaction of soil. This study results figures supports it. Similarly, asreported by Lal et al. [23], most of the soils contained between 0.3 and 11.5% Soil Organic Matter (SOM) in the surface 20 cm of mineral soil. According to this study, Bulk density of the soil was negatively correlated with SOC (R1 = 0.11 & R2=0.01 in TOF-Agriculture & TOF-Urban respectively). Negative correlation between SOC and bulk density of soil was also reported by Ali et al. [3] and Ghimire et al. [16] respectively.
Shannon’s index and Simpson’s index in home garden with tree of Terai was found to be 1.247 and 0.0915 respectively Kafle [12]. This research shows, Shannon Weinner index and Simpson biodiversity index of TOF-Urban (H=1.91, D=0.83) is higher than that of TOF-Agriculture (H=1.44, D= 0.68). It was found that higher percentage of carbon and biomass is found in Mangifera indica (32.17%) & in Eucalyptus camaldulensis (24.39%) whereas lower carbon and biomass is found in Melia azadarch (0.03%) in Pipara VDC of Mahottari district of terai region within TOFs Jha [12]. This research shows that in the study area Eucalyptus camaldulensis have the highest and Mangifera indica have the second highest major two species having higher distribution of carbon and biomass in the study area where as Azadirachta indica having the lower carbon and biomass respectively in the study area.
Conclusion
Major species of the study area was Eucalyptus camaldulensis, Dalbergia sissoo, Tectona grandis, Mangifera indica which were found as TOFs. The higher distribution of above ground carbon was found in Eucalyptus camaldulensis, lowest in Azadirachta indica. According to land use, TOF- Agriculture and TOF-Urban have occupied 89.37 ha and 198.83ha respectively in the study area. Higher distribution of average above ground carbon stock was found in Eucalyptus camaldulensis in TOF-Agriculture where as in TOF-Urban it was found in Mangifera indica. Furthermore, the total average carbon stock distribution was higher in TOF-Urban (84.31 tha-1) than in TOF-Agriculture (70.21 t ha-1.). TOF-Urban has higher average below ground carbon stock than that in TOF-Agriculture. Similarly, A decreasing trend in soil organic carbon was seen for both the land uses with increase in soil depths, which ranged from 14.7±6.08 t ha -1 to 9.40±2.71t ha-1 for TOF-Agriculture whereas for TOF-Urban it ranges from 19.45±5.87 to 8.13±5.41t ha-1. On contrary, an increasing trend was observed in bulk density for both the land uses with increase in soil depths. The total SOC stock within TOF present in urban and agriculture followed the order as Urban>Agriculture with the total SOC stock of each land use being 39.22t ha-1and 36.17 t ha-1respectively. Similarly, the result of oneway ANOVA test (P=0.05) shows that means stocks of soil organic carbon do differ significantly by soil depths 0-10, 10-20 and 20- 30 cm respectively in TOF-Urban at 95% confidence interval with P-value 0.0386(< 0.05). Form TUKEY HSD Multiple Test, since P-adj. value of pair’s 3rd-1st of layers is less than 0.05, so there is significant difference in this pair among three pair in their mean stocks of soil organic carbon at soil depths 0-10cm, 10-20cm, and 20-30 cm respectively in TOF-Agriculture. The study concluded that there is a linear relationship between SOC stock and organic carbon percentage for both types of land use with TOF, but no linear relationship was found between bulk density and total SOC content. Shannon Weinner index and Simpson biodiversity index of TOFUrban was higher than that of TOF-Agriculture i.e., biodiversity and abundance within tree species of TOFs species in TOF-Urban was seen higher than TOF-Agriculture. From this study, total average carbon stock and biodiversity was deeming to be more in urban land than that of agriculture land so proper agro-forestry scheme should be promoted in study area to improve those in agricultural land too.
Acknowledgments
The authors are grateful to Hariyo Ban Program, WWF Nepal for providing financial support to conduct this research and the anonymous reviewer for his/her constructive feedbacks in the preliminary version of the manuscript.
References
- Acharya KP (2006) Linking trees on farms with biodiversity conservation in subsistence farming systems in Nepal. Biodiversity & Conservation 15(2), 631-646.
- Amatya SM, Shresth KR (2002) Nepal Forestry Handbook. Forestry Research Programme for Asia and the Pacific. Food and Agriculture Organization of the United Nations, Bangkok publication 32(2002): pp. 476.
- Ali S, Begum F, Hayat R, Bohannan BJ (2017) Variation in soil organic carbon stock in different land uses and altitudes in Bagrot Valley, Northern Karakoram. Acta Agriculture Scandinavica, Section B-Soil & Plant Science 67(6): 551-561.
- ANSAB (2010) Forest Carbon Stock Measurement: Guidelines for measuring carbon stocks in community-managed forests. Asia Network for Sustainable Agriculture and Bio-resources (ANSAB), Federation of Community Forest User Groups and International Centre for Integrated Mountain Development, Kathmandu, Nepal.
- Central Bureau of Statistics. (2011) National Population and Housing Census 2011: Bara District (Vol.06). Retrieved from http://old.cbs.gov.np/image/data/Population/VDCMunicipality%20in%20detail/33%20Bara_VDCLevelReport.pdf
- Chave J, Andalo C, Brown S, Cairns MA, Chambers JQ (2005) Tree allometry and improved estimation of carbon stocks and balance in tropical forests. Oecologia 145(1): 87-99.
- Chaudhari PR, Ahire DV, Ahire VD, Chkravarty M, Maity S (2013) Soil bulk density as related to soil texture, organic matter content and available total nutrients of Coimbatore soil. International Journal of Scientific and Research Publications 3(2): 1-8.
- DFRS (2015) State of Nepal's Forests. Forest Resource Assessment (FRA) Nepal, Department of Forest Research and Survey (DFRS). Kathmandu, Nepal
- DoF (2005) Forest Cover Change Analysis of the Tarai Districts. Department of Forests, Kathmandu, Nepal.
- DoF (2015) Banko Janakari. Banko Jankari 28(2018), 50.
- Eriksen-Hamel N, Danso G (2010) Agronomic considerations for urban agricsouthern cities. International Journal of Agricultural Sustainability 8(1-2): 86-93.
- FAO (2000) Trees outside forests. Global Forest Resource Assessment 2000. Main Report.39-44pp. Food and Agriculture Organizations, Rome, Italy.
- FAO (2013) Towards the assessment of the trees outside forests. A thematic report prepared in the framework of the global forest resource assessment 1-335.
- Follain S, Walter C, Legout A, Lemercier B, Dutin G, et al. (2007) Induced effects of hedgerow networks on soil organic carbon storage within an agricultural landscape. Geoderma 142(1-2): 80-95.
- FSI (2001) Proceedings of the Training Workshop on Assessment of Trees Outside Forests (TOF). Dehradun, India. Forest Survey of India, Dehradun, in collaboration with FAO Pp 9.
- Ghimire P, Bhatta B, Pokhrel B, Kafle G, Paudel P, et al. (2018) Soil organic carbon stocks under different land uses in Chure region of Makawanpur district, Nepal. SAARC Journal of Agriculture 16(2): 13-23.
- NBSAP (2014) National Biodiversity Strategy and Action Plan, Ministry of Forests and Soil Conservation, Singhadurbar, Kathmandu, Nepal
- Michon G, De Foresta H (1992) Complex agroforestry systems and the conservation of biological diversity: Agroforests in Indonesia: the link between two worlds. Malayan Nature Journal 45(1-4): 457-473.
- Kleinn C (2000) on large-area inventory and assessment of trees outside forests. UNASYLVA-FAO-51(200): 3-10.
- ITTO (2012) The Inventory and Monitoring of Tree Resource Outside Forest in Thailand: Guidebook
- Jha SK (2012) Species Diversity and Carbon Estimation in Trees outside Forests.Bachelor’s Thesis, Kathmandu Forestry College, Kathmandu,Nepal
- Kafle S (2015) Agroforestry System and their Carbon Stock in Terai and Mid-Hill Regions of Central Nepal. Central Department of Botany Tribhuvan University Kirtipur, Kathmandu, Nepal 1-68.
- Lal HS, Bajracharya RM, Sitaula BK (2012) Forest and Soil Carbon Stocks, Pools and Dynamics and Potential Climate Change Mitigation in Nepal. J Environ Sci Eng 1: 800-811.
- Mandal RA, Yadav BK, Jha SK, Giri RK (2014) Evaluating Carbon Stocks and Plant Biodiversity Relationship in Tree outside Forests of Terai, Nepal. In Conference Organizing Committee 181-193.
- Pandey DN (2002) Carbon sequestration in agroforestry systems. Climate policy 2(4): 367-377.
- Pandit BH, Shrestha KK, Bhattarai SS (2014) Sustainable local livelihoods through enhancing agroforestry systems in Nepal. Journal of forest and Livelihood 12(1): 47-63.
- Schroeder P (1994) Carbon storage benefits of agroforestry systems. Agroforestry systems 27(1): 89-97.
- Singh P, Lodhiyal LS (2009) Biomass and carbon allocation in 8-year-old poplar (Populus deltoides Marsh) plantation in Tarai Agroforestry Systems of Central Himalaya, India. New York Science Journal 2(6): 49-53.
- Team RC (2018) R: A language and environment for statistical computing. R Foundation for Statistical Computing, Vienna, Austria. 2012. URL http://www. R-project. org.
- Yadav Y, Bahadur B, Chhetri K, Raymajhi S, Rajtiwari K, et al. (2017) Importance of trees outside forest (tof) in Nepal: a review. Octa Journal of Environmental Research 5(2): 70-81.

Top Editors
-

Mark E Smith
Bio chemistry
University of Texas Medical Branch, USA -

Lawrence A Presley
Department of Criminal Justice
Liberty University, USA -

Thomas W Miller
Department of Psychiatry
University of Kentucky, USA -

Gjumrakch Aliev
Department of Medicine
Gally International Biomedical Research & Consulting LLC, USA -

Christopher Bryant
Department of Urbanisation and Agricultural
Montreal university, USA -

Robert William Frare
Oral & Maxillofacial Pathology
New York University, USA -

Rudolph Modesto Navari
Gastroenterology and Hepatology
University of Alabama, UK -

Andrew Hague
Department of Medicine
Universities of Bradford, UK -

George Gregory Buttigieg
Maltese College of Obstetrics and Gynaecology, Europe -

Chen-Hsiung Yeh
Oncology
Circulogene Theranostics, England -
.png)
Emilio Bucio-Carrillo
Radiation Chemistry
National University of Mexico, USA -
.jpg)
Casey J Grenier
Analytical Chemistry
Wentworth Institute of Technology, USA -
Hany Atalah
Minimally Invasive Surgery
Mercer University school of Medicine, USA -

Abu-Hussein Muhamad
Pediatric Dentistry
University of Athens , Greece

The annual scholar awards from Lupine Publishers honor a selected number Read More...


