Lupine Publishers Group
Lupine Publishers
Menu
ISSN: 2638-5910
Research Article(ISSN: 2638-5910) 
The Diabetes Epidemic in the South Pacific: A Pilot Study Utilising Hand Grip Strength in Tonga Volume 2 - Issue 1
Maria-Eleni Zioupos1*, Joseph Takai2,3, Mehtab Ahmad4 and Peter Zioupos5
- 1 Russells Hall Hospital, General Surgery, West Midlands Deanery, UK
- 2 Prince Wellington Ngu Hospital, Vavau, Tonga
- 3 Fiji School of Medicine, Fiji National University, Fiji
- 4 Specialist Registrar General Surgery, West Midlands Deanery, UK
- 5 Cranfield Forensic Institute, Cranfield University, Defence Academy of the UK, Shrivenham, UK
Received:February 12, 2019 Published: February 19, 2019
Corresponding author:M-E Zioupos, Russells Hall Hospital, General Surgery, UK
DOI: 10.32474/ADO.2019.02.000129
Abstract
Background: Hand-grip strength (HGS) has been shown recently to help in predicting disease outcomes and assessing health risk, particularly in cardiovascular and metabolic disease. Studies confirming its link to diabetes (T2DM) suggest there is potential for its use as simple screening tool. This study examined this possibility in a developing-world population, in a cohort of Tongan diabetics.
Methods: HGS was measured in a randomly selected cohort of patients, comprising in total 149 patients, of which 91 with and 58 without T2DM. Other measurements recorded included patient demographics, blood pressure and date of diabetes diagnosis.
Results: HGS was found to reduce significantly with age in all groups and it also related to BMI in males. Binary logistics regression models were produced using ‘HGS,’ ‘Age’ and ‘BMI’ which had a sensitivity of 82-84% (M/F) and specificity of 50-57%.
Conclusion: This study uses one of the well-known effects and complications of T2DM, affected hand grip strength of sufferers, as a parameter in a ‘tool’ to predict the presence of the disease showing very good sensitivity. Further research is needed into the more general utility of the tool, while further work may help identify among the diagnosed those who would benefit from specialist treatment.
Keywords:Type 2 diabetes; Grip strength; Neuropathy; Diagnosis; Developing countries
Introduction
Type 2 diabetes mellitus (T2DM) is an important target for medical research. Its deadly but silent nature means that by the time of diagnosis, 50% of sufferers have already developed serious complications. [1] These can be classified as macro or micro vascular and affect a vast array of organ systems [2]. The complications are confounded and related to impaired microcirculation, altered blood rheology, neuropathy and its concomitant other conditions [3,4]. Musculoskeletal effects include reduced upper-limb strength and poorer muscle quality, which combined with nerve damage, can lead to severe disability [5-7] As a result, appropriate screening and early and accurate diagnosis of T2DM is extremely important.
Hand-grip strength (HGS) testing is being increasingly studied as a potential tool for monitoring and predicting cardiovascular and metabolic disease. [8-16] Given the aforementioned musculoskeletal consequences of T2DM, various studies have made observations on the relationship between HGS and T2DM [13-15] and it is now broadly accepted that HGS is affected in diabetics when compared with the general population [16]. Not only this, but further work demonstrated that HGS is actually negatively correlated with HBA1c and with the duration of diabetes. [17-18] The numerous potential reasons for this effect include reduced mitochondria in muscle cells, reduced glycogen synthesis and increased inflammatory cytokines at a molecular level, and muscle wasting, stiffer joints, connective tissue damage and neuropathy resulting in reduced mobility [14].
It is hypothesized that monitoring this physiological damage trajectory in T2DM might add to our knowledge of the disease process and even give rise to opportunity for screening. This is because research published in the American Journal of Preventative Medicine in 2015 suggested that, even among healthy weight adults, HGS was reduced both in diagnosed and undiagnosed diabetics and that this was reduced in comparison with normal population. [19] Indeed, HGS has been found to be inversely associated with incident type 2 diabetes [20] and 2010 research from the University of Washington suggested having a greater grip strength meant you were less likely to be at risk for developing the disease in the future [21]. Since the publication of these observations, Eckman et al. [9] developed and presented a model comprising: ‘HGS,’ ‘age,’ ‘blood pressure’ and ‘BMI’ as a potentially viable method for detecting early T2DM risk, in a Kenyan population. Although the researchers did not show how well this model performs in their patient population, they suggested that a tool based on HGS tool can be widely available, inexpensive, easy to use and easy to transport [22].
These advantages make such a tool particularly useful in third world countries, or for health systems which lack resources. The extent to which their model would work in another population or continent, is questionable, however, given the variance in HGS in different ethnic groups that has been observed as part of the HELIUS study in 2015 [23] and its association with body weight and age [6]. The Kingdom of Tonga, like many of the Pacific nations, is a country experiencing a T2DM epidemic [24], where prevalence of the disease has doubled since 1973, but 80% of sufferers remain undiagnosed [25]. Primary care is under strain and Tongan hospitals (such as the Prince Wellington hospital on Northern island set Vavau used here) are under-resourced for provision of effective T2DM prevention, screening and care [26].
The present study explores the potential for using a simple mechanical device, used to produce HGS values, in medical diagnosis and prevention care clinical routines. It employs HGS testing in cohort of people that presented themselves to clinics in Tonga to screen for those among them at high risk of T2DM. The study aims to combine HGS to some other basic patient metrics similarly to some very recent previous studies [9, 13-16], but now applied for a completely different and challenging demographic cohort of a south east Asian population. The topic concerns one of the most important public health challenges in modern medicine and relates musculoskeletal complications with metabolic medicine. Greater accuracy in knowledge of diabetic complications and their effects on the body, could mean more accurate diagnosis and management of a silent and destructive disease. Recent studies confirm, hand-grip strength testing has ever-widening prospects for its application to various medical fields. Moreover, the work offers an opportunity to gather original data on a little-studied population so as to explore the utilization of such a tool in an under-resourced developing world diabetes epidemic.
Patients and Methods
The research was performed in the outpatient clinics of Prince Wellington NGU District Hospital, Neiafu, Vavau, in the Kingdom of Tonga in the South Pacific. A total of 149 participants were recruited at the outpatient clinic at Prince Wellington hospital and at one outreach clinic, set up at a nearby island location. Patients were opportunistically selected after being identified on the basis of a T2DM diagnosis, or the absence of a diagnosis of T2DM over the course of 1 month of clinics. The clinic for diabetes took place twice a week, hypertension clinic once a week and all other clinics examined mixed cases. Participants included were consenting Tongans with diagnosis of T2DM, or not diagnosed with diabetes (NDD). Participants excluded were those completely unable to perform grip dynamometry because of hand/upper-limb loss. A total of 4 acutely unwell patients were excluded from the research on their being admitted to the hospital. All participants were consented by means of a written consent form outlining that other than hand-grip strength; they would receive no immediate result following the assessment.
Consent was obtained following reading an information sheet. Health care professionals gave an explanation of the research to the group as a whole prior to every clinic, when the patients gathered in the waiting room. Patients were explained the research in their clinic appointment by means of a translated information sheet and gave written consent via consent form. Each patient was allocated a non-identifiable code. Data was electronically recorded under that code. Consent forms were signed and kept by the researcher. Measurements to be taken were to be determined by the availability of hospital time and resources. In order to produce a model comparable to [9] at least Age, BMI, BP and HGS measurements would have to be recorded. Ultimately patient measurements of Age, Sex (M/F), Comorbidities, Medications, Smoking habit (Y/N) were collected by the doctor seeing the patient in clinic. Diabetics were also asked the additional questions as to whether they had a Diagnosis of T2DM (Y/N), Date of diagnosis, Family history of diabetes (if known). BP, Height, Weight and therefore (BMI) were measurements obtained by the hospital nurses prior to the patients’ clinic appointments.
Handedness (R/L/U) and 3 test values on grip strength were measured by one and the same researcher. Hand-grip strength measurements were taken to be the maximum force measured by a Takei digital grip-strength dynamometer (TKK5401 Grip-D, Takei Sci. Instr. Co. Ltd. Niigata, JP) in a ‘best-of-three’ test. Testing was standardized by determining patient dominance of hand and ensuring a standing, or seated posture with the tested arm hanging. Three measurements were recorded per hand each preceded by a 30s pause for rest in-between. All participants received a full demonstration with the hand dynamometer prior to testing. Data and statistical analysis were performed in the UK with use of the computer package Minitab® version 17.3.1 and with the help of Cranfield University statisticians.
Results
Patient Sample Demographics
Data was collected on a total of 149 patients, including 91 patients with a diagnosis of T2DM and 58 without a diagnosis of T2DM. The sample size was determined by the time and resources available and was planned to be comparable to other such bespoke studies globally. Anthropometric values and the matching between groups are shown in Table 1.
Table 1: Patient demographics for age, height, weight, BMI, systolic and diastolic blood pressure, duration of disease and HGS.
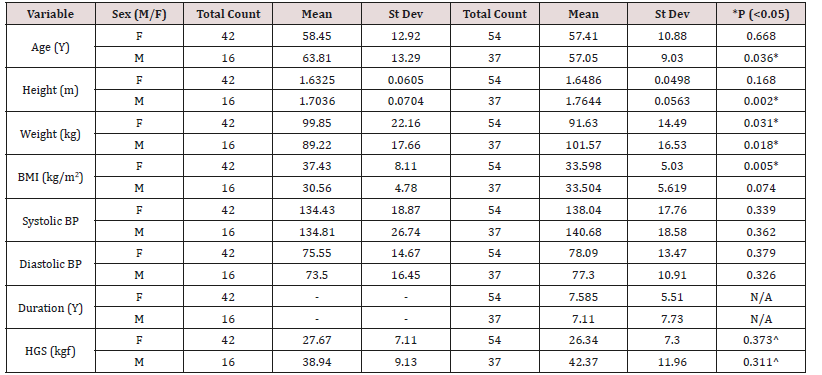
*indicates statistically significant difference between control and diabetic population. ^ HGS was not found to be significantly different between controls and diabetics in this population. Duration (Y) since diagnosis for T2DM patients only.
Relationship Between HGS and Other Patient Variables
Muscle performance and strength has been linked to body weight and age in the absence and presence of T2DM [6]. We looked for the presence of a pattern separately for males and females (Table 2).
Table 2: Correlations between: Age, systolic BP, diastolic BP, BMI, HGS in Males.

Cell Contents: top value is the Pearson correlation; Underneath is the P-Value where *indicates statistical significant correlation between these variables.
The last row in Table 2 shows that HGS correlates significantly with Age and BMI, as shown in Figure 1 below (Diabetics in red; Controls in blue). Systolic BP, BMI and HGS also showed a significant effect with Age. HGS rose faster as function of BMI and declined slower as a function of Age in controls (Table 3) (Figure 1).
Figure 1: (a) HGS vs. Age in Males; (b) HGS vs. BMI in Males. (Controls – blue symbols; T2DM – red symbols) .
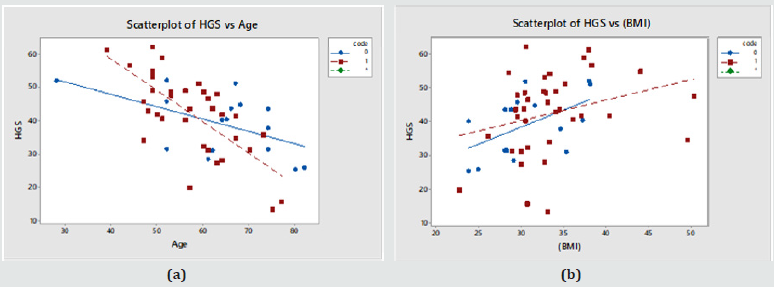
Table 3: Correlations between: Age, systolic BP, diastolic BP, BMI, HGS in Females.

Cell Contents: top value is the Pearson correlation; Underneath is the P-Value where *indicates statistical significant correlation between these variables.
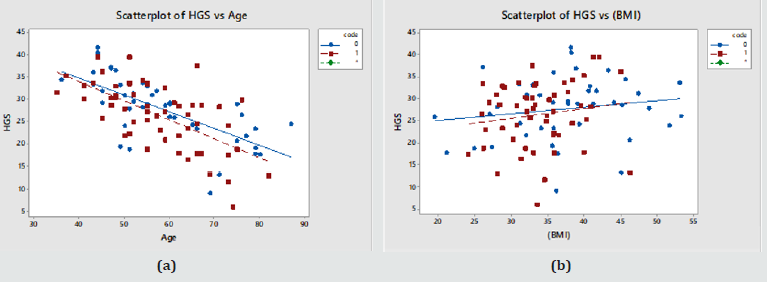
In Table 3, HGS is shown to correlate significantly with Age and no other variable. This is shown in Figure 2. There were cross correlations of BMI with Age and systolic BP. The rate of change of HGS with Age and of HGS vs. BMI was identical in diabetics and controls (Diabetics in red; Controls in blue) (Figure 2).
Figure 2: (a) HGS vs. Age in Females; (b) HGS vs. BMI in Females. (Controls – blue symbols; T2DM – red symbols).
Effects on ‘HGS’ of: Age – Systolic Bp – Diastolic Bp – BMI - ‘Duration Of Disease’ Within The Diseased Population for Males and Females
Duration is the only other factor not considered thus far as it applies only to the diseased group. This was explored via a multifactorial regression relationship using the ‘stepwise regression’ routine in Minitab®. All available variables were considered by the programme and the level to enter or exit the regression was a=0.15. Eventually only those variables, which have a statistically significant effect on HGS were retained within this generalized linear model (Table 4).
Table 4: Stepwise regression output for Males.

Equation 1 = HGS = 92.90 - 0.881 Age (62.06kgf for a 35yr old male adult).
HGS correlated with both Age and BMI in males (Table 2), but in the generalised linear model the cross correlation between Age and BMI was such that only one of them stayed as the more dominant one, Age (Table 5).
Table 5: Stepwise regression output for Females.

Equation 2 = HGS = 50.36 - 0.4039 Age (36.22kgf for a 35yr old female adult).
In both males and females, the regression shows that still only ‘Age’ can be used to predict ‘HGS’ in the sufferers, even when ‘duration’ is considered. Unlike other studies the ‘duration’ is not a significant reliable factor. However, ‘duration’ is essentially the time since diagnosis, and this then may reflect in fact the performance of the local health care system in diagnosing sufferers late or reporting them accurately.
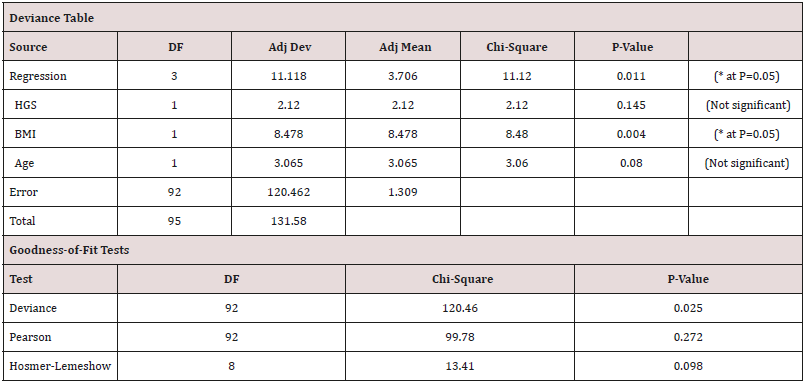
Binary Logistics Regressions: A Model to Predict Likelihood of Suffering with T2DM based on ‘HGS’, ‘BMI’ and ‘Age’ values
A predictive model can be produced by using binary logistics regression where the output is not a continuous variable but in binary form (0 for controls and 1 for diabetics) (Table 6).
Model-1: Binary Logistics Regression Equation for Males
P (1) = exp(Y ') / (1 + exp(Y ')) (Probability of having the disease)
Equation 3:
Y ' = 2.98 − 0.0272 HGS + 0.0959 BMI − 0.0681 Age (Figure 3) (Table 6)
Figure 3: (a) Individual probability of disease values in the whole Male cohort against true disease status (0 – normal, 1- diseased) (b) Cumulative probability function for the same. Based on the above model, normals were given on average lower probability values than the diseased cohort. This was statistically significant as shown by a T-test, P value = 0.005, with a 95% Confidence interval for the mean for Normals [0.53-0.68] and Diabetics [0.69-0.79].
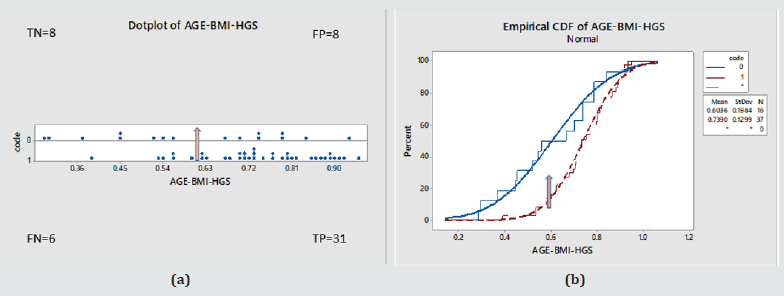
Diagnostic Test Evaluation: For the purposes of screening and to demonstrate the performance of the model, at an arbitrary probability threshold of 0.6, the model would have correctly identified 31 as true positive (TP), misdiagnosed 6 as false negative (FN), and also given for the controls a random 50/50 split, that is 8 true negative (TN) and 8 false positive (FP).
As a result
a. Sensitivity = 84% [95%CI=68-94%]
b. Specificity = 50% [95%CI=25-75%]
c. Disease prevalence = 70% [95%CI=56-82%]
d. Positive predictive value= 80% [95%CI=70-87%]
e. Negative predictive value = 57% [95%CI=36-76%].
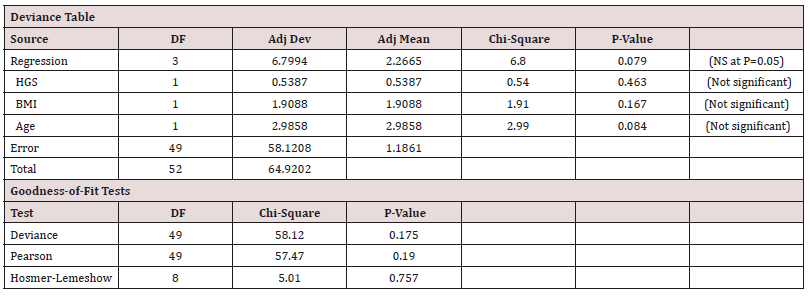
Model- 2: Binary Logistics Regression Equation for Females
P (1) = exp(Y ') / (1 + exp (Y ')) (Probability of having the disease)
Equation 4:
Y ' = 7.73 − 0.0578 HGS − 0.0968 BMI − 0.0429 Age (Figure 4) (Table 7)
Figure 4: (a) Individual probability of disease values in the whole Female cohort against true disease status (0 – normal, 1- diseased) (b) Cumulative probability function for the same. Based on the above model, normals were given on average lower probability values than the diseased cohort. This was statistically significant as shown by a T-test, P value < 0.000, with a 95% Confidence interval for the mean for normals [0.45-0.54] and Diabetics [0.57-0.66].
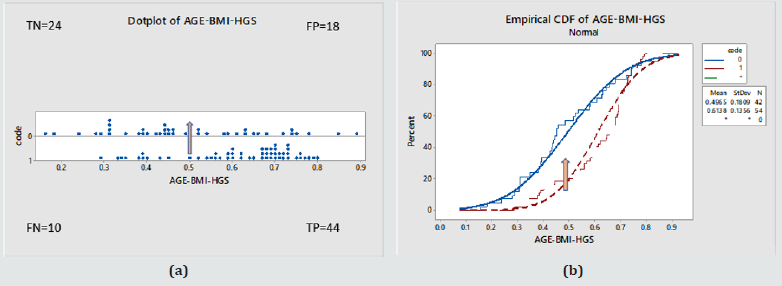
Diagnostic Test evaluation: For the purposes of screening and to demonstrate the performance of the model, at an arbitrary probability threshold of 0.5, the model would have correctly identified 44 (TP), misdiagnosed 10 (FN), and also given us for the controls 24 (TN) and 18 (FP).
As a result:
a. Sensitivity = 82% [95%CI=69-91%]
b. Specificity = 57% [95%CI=41-72%]
c. Disease prevalence = 56% [95%CI=46-66%]
d. Positive predictive value= 71% [95%CI=63-78%]
e. Negative predictive value = 71% [95%CI=56-82%]
Binary Logistics Regression: A Model for Predicting Likelihood of Suffering with T2DM based on ‘HGS’, ‘BMI’, ‘Age’, ‘Systolic’ and ‘Diastolic’ Blood Pressure Values (Table 8)
Table 8: For Males as a function of HGS, BMI, Age and the systolic and diastolic blood pressure values.
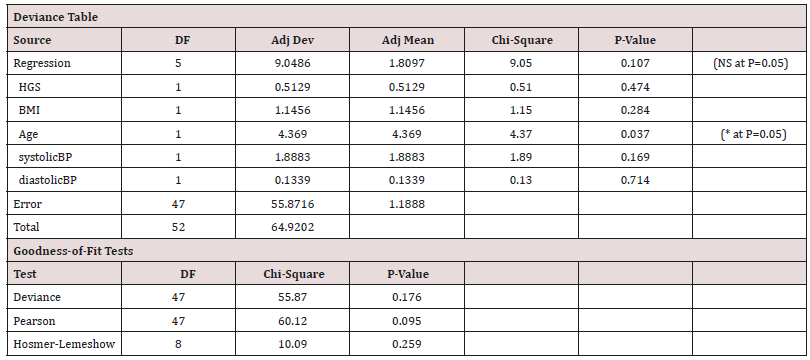
Model-3: Binary Logistics Regression Equation for Males
P (1) = exp(Y ') / (1 + exp(Y '))
Equation 5:
Y ' = 2.30 − 0.0271 HGS + 0.0708 BMI − 0.0932 Age + 0.0284 systolic BP − 0.0123 diastolic BP
(Figure 5) (Table 8)
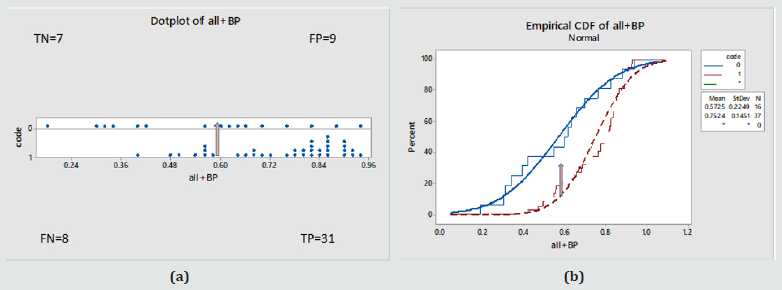
Figure 5: (a) Individual probability of disease values in the whole Female cohort against true disease status (0 – normal, 1- diseased) (b) Cumulative probability function for the same. Statistically different behaviours, ANOVA: P value = 0.001, 95% Confidence interval for the mean = Normals [0.49-0.66], Diabetics [0.70-0.81] . For a cut off probability value of 0.6 / the performance was: 78% (TP), 22% (FN), 44% (TN), 56%(FP) .
Model-4: Binary Logistics Regression Equation for Females
P (1) = exp(Y ') / (1 + exp(Y '))
Equation 6:
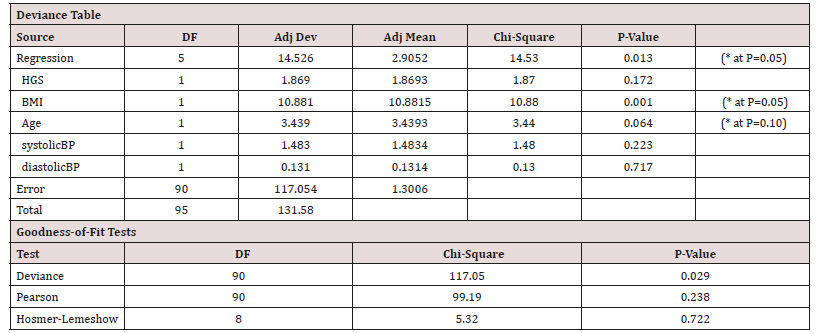
Y ' = 5.29 − 0.0560 HGS − 0.1157 BMI − 0.0476 Age + 0.0203 systolic BP + 0.0076 diastolic BP
(Figure 6) (Table 9).
Figure 6: (a) Individual probability of disease values in the whole Female cohort against true disease status (0 – normal, 1- diseased) (b) Cumulative probability function for the same. Statistically different behaviours, ANOVA: P value < 0.000, 95% Confidence interval for the mean = Normals [0.42-0.53], Diabetics [0.58-0.67]. For a cut off probability value of 0.48 / the performance was: 82% (TP), 18% (FN), 57% (TN), 43%(FP) .
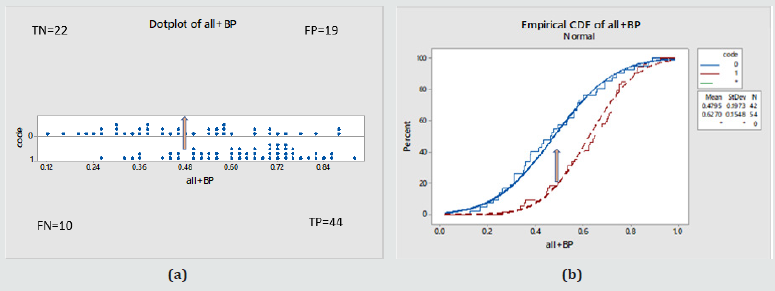
Table 9: For Females as a function of HGS, BMI, Age and the systolic and diastolic blood pressure values.
Discussion
The aim of this study, which was carried on diabetic patients in a third world country, was to examine whether, after collecting a set number of physiological measurements including HGS, it is possible to ascertain the likelihood of being at high risk of suffering with T2DM. This is against a background of research suggesting that HGS, a musculoskeletal measurement which is affected in T2DM, appears to carry additional diagnostic value for screening in musculoskeletal and neuronal diseases.
The method was taken to the Kingdom of Tonga where it would be challenged because of the very different ethnic, continental and lifestyle background. Consequently, the results of this work do not mirror results demonstrated in some other previous studies as in this patient sample we found no statistically significant difference in HGS between controls and diabetics (Table 1). As shown in Relationship Between HGS and Other Patient Variables’ HGS relates to Age and BMI; high BMI for high HGS and thus increased BMI which also would be a factor for T2DM was already linked to HGS skewing the data. HGS, on the whole, correlated significantly with age in both men and women in this population and this is regardless of diabetic status (Figure 1a & 2a). This relationship was stronger in diabetics, both male and female. The relationship between HGS and BMI was statistically significant in males but not in females (Figure 1b & 2b).
As shown in section where the relationship between HGS and ‘duration’ of disease is examined and in conjunction with other variables, this was not significant. That may have been due to a limitation in accuracy of defining ‘duration’. It is not possible to be confident that the duration of the disease which was assessed from the date they were diagnosed locally was accurate because the locals, compared to other populations, do not attend hospitals, they do not have any primary care physicians to be seen to, knowledge about diabetes and its impact is very poor and the urgency to deal with a suspected condition is lacking. This is further compounded by the possibility that even within the ‘controls’ there may have been sufferers who were undiagnosed T2DM.
The best results were produced by use of the binary logistics models -1 to -4. These were able to apportion probability values above 0.5 (>50% chance of having T2DM) to the vast majority of the sufferers, while apportioning random values of diabetes likelihood to the controls (probability values spreading across the whole range from 0 (0%) to 1 (100%)). As a result, on ‘evaluation of the models as a diagnostic test’ model -1 and -2 for instance for a cutoff value of probability of 50% it would have given true positive (TP) for 82-84% of diabetics (good sensitivity) but would also have false positively (FP) identified 50-57% of the controls (lacking in specificity) in males (model-1) and females (model-2) respectively. The model input and output variables were similar to those used in a previous study that of Eckman et al. [9]. However, it is not clear if the model in the Eckman et al. study performed well because the authors did not show proof of fit, or performed the statistics tests shown here. They also did not show specificity and sensitivity values (diagnostic test evaluation).
The present study performed less well than other research probably because of the different context and/or various limitations, particularly the choice and characteristics of the patient sample. HGS has been shown to depend on BMI and the Tongans show by global standards uncharacteristically high BMI values for both males and females. Perhaps, as shown in Table 1, the difference in variations such as gender, age and BMI between the cohorts meant that the populations were not ideally matched. There is an extremely high prevalence of diabetes in Tonga and so finding patients without a diagnosis of diabetes is a challenge. In addition, the recruited ‘control’ volunteers were from other outpatient clinics and therefore, it cannot be dismissed that they were suffering from other conditions, such as obesity, hypertension or dyslipidemia, which may have equally well affected the physiological measurements values and HGS. Notably, the average BMI of the female control group was higher than that of the female diabetic group (see Table 1) and the opposite was true for the males; and in both sexes HGS followed the same patterns as BMI. It should also be noted that four acute cases were not included in T2DM because they were managed on an urgency basis and thus were not part of the study which searches for a diagnostic method for T2DM.
The HGS values produced may be affected by some other musculoskeletal dysfunctions and are not diabetes specific. It is also possible, for instance, that patients may have been suffering from undiagnosed conditions, e.g. arthritis, which made use of the dynamometer difficult. There is also no standardized method for choice of size of hand-grip dynamometer because there are no known guidelines. It would be good to produce such rules in a future study. HGS data collection and performance was not blinded and was visible to the researcher and the participant so as to encourage maximum grip strength. There were sex differences, women tended to approach the dynamometer with some timidity, and it may be the case that culturally the Tongan women find it difficult to exert themselves in public.
The choice of variables used in this study was limited by the resources on offer locally. HbA1c recording might have been useful, but not all patients had these available. HbA1c measurements would apportion an objective severity of diabetes score rather than depend on the qualitative status allocated by local doctors. Smoking is another variable which is known to have an effect on hand-grip strength. Our data obtained on smoking (including date stopped, number a week prior to stopping etc.) was of limited use and could have been more accurately obtained. Because of cultural pressure the answer to this question may have been inaccurate since patients may have not reported to the doctor truthfully. The outcome to the question of previous family history of diabetes was similarly troublesome as many of the locals could not recall or did not know for certain.
Conclusion
In the present study we have used a simple mechanical device, used to produce HGS measurements, to ascertain its utility value in medical diagnosis and prevention care clinical routines. We have exploited the very presence and occurrence of a musculoskeletal and neuronal complication brought about by the presence of type 2 Diabetes, in a statistics tool, to predict the presence of the disease itself. We have gathered physiological variables such as BMI, BP, Age and HGS in a cohort of T2DM sufferers and for a sex/aged matched control of non-diabetics to explore the hypothesis that HGS can contribute towards a model for screening and predicting for this condition. The significance of the present methodology is that it is the second study of its kind to be performed in a third world setting.
The means and methodology are quite simple and HGS may be a useful measure within a predictive tool by which health risk may be assessed in a developing country such as Tonga though more research is needed. The use of HGS in combination with Age and BMI led to a binary logistic model which apportioned a probability of having T2DM more than 0.5 (>50%) for the majority of sufferers and can be used to at least highlight those who should be referred for further investigation. The overall impressions for use of the dynamometer were positive in general due to its novelty and men in particular enjoy taking part. The HGS tool offers an easy health test which could be used by non-medically trained professionals in order to screen a population such as that in Tonga where doctors are rare and there is much reliance on aid from other countries. Tongan health care struggles with the burden of screening for T2DM, in which case monitoring and treating diabetes, through perhaps early diagnosis and prevention, may in fact be the best cure in this context.
Acknowledgements
Ethical approval was issued by the National Health Ethics and Research Committee at the Tongan Ministry of Health (NHERC / REF#100217; MOH#MH53:02; 05/05/2017), secretary Mr. Va’inga jr Tone and following permission granted by the Chief Medical Officer Dr John Lee Taione. Funding in the form of ‘in kind’ contribution was offered by all three institutions involved (Birmingham Univ, Cranfield Univ and NHS Hospitals in Tonga), the test kit was on loan from the MMR group of Cranfield University. We are indebted to the statisticians of Cranfield University for their input in analysing the dataset.
References
- Diabetes UK (2016) Number of people with diabetes reaches over 4 million.
- Almdal T, Scharling H, Jensen JS, Vestergaard H (2004) The independent effect of type 2 diabetes mellitus on ischemic heart disease, stroke, and death: a population-based study of 13,000 men and women with 20 years of follow-up. Arch Intern Med 164(13): 1422-1426.
- Ijzerman TH, Schaper NC, Melai T, Meijer K, Willems PJB, et al. (2012) Lower extremity muscle strength is reduced in people with type 2 diabetes, with and without polyneuropathy, and is associated with impaired mobility and reduced quality of life. Diabetes Res Clin Pract 95(3): 345-351.
- Zioupos P, Barbenel JC, Lowe GDO, MacRury S (1993) Foot microcirculation and blood rheology in diabetes. J Biomed Eng 15(2): 155-158.
- Wyatt LH, Ferrance RJ (2006) The musculoskeletal effects of diabetes mellitus. J Can Chiropr Assoc 50(1): 43-50.
- Guerrero N, Bunout D, Hirsch S, Barrera G, Leiva L, et al. (2016) Premature loss of muscle mass and function in type 2 diabetes. Diabetes Res Clin Pract 117: 32-38.
- Timpka S, Petersson I, Zhou C, Englund M (2014) Muscle strength in adolescent men and risk of cardiovascular disease events and mortality in middle age: a prospective cohort study. BMC Med 12: 62.
- Meng G, Wu H, Fang L, Li C, Yu F, et al. (2016) Relationship between grip strength and newly diagnosed non-alcoholic fatty liver disease in a large-scale adult population. Scientific Reports. 6: 33255.
- Eckman M, Gigliotti C, Sutermaster S, Butler PJ, Mehta K (2016) Using handgrip strength to screen for diabetes in developing countries. J Med Eng Technol 40(1): 8-14.
- Sunderland A, Tinson D, Bradley L, Hewer R (1989) Arm function after stroke. An evaluation of grip strength as a measure of recovery and a prognostic indicator. J Neurol Neurosurg Psychiatry 52(11): 1267-1272.
- Webb A, Newman L, Taylor M, Keogh J (1989) Hand grip dynamometry as a predictor of postoperative complications reappraisal using age standardized grip strengths. JPEN J Parenter Enteral Nutr 13(1): 30-33.
- Bohannon R W (2008) Hand-grip dynamometry predicts future outcomes in aging adults. J Geriatr Phys Ther 31(1): 3-10.
- Gill P K S, Sandhu R, Dimple, Dhillon S K, Arora AK (2016) Handgrip strength in patients with Type 2 Diabetes Mellitus. Pak J Physiol 12(2):19-21.
- Khallaf ME, Fayed EE, Al Rashidi (2014) Effect of Longstanding Diabetes Mellitus Type II on Hand Grip Strength and Pinch Power of Females in the City of Hail-KSA. IOSR Journal of Nursing and Health Science 3(1): 41-44.
- Ezema C I, Iwelu E V, Abaraogu U O, Olawale O A (2012) Handgrip Strength in Individuals with Long- Standing Type 2 Diabetes Mellitus: A preliminary report. Afr J Physio Reh Sci 4(1): 67-71.
- Cetinus E, Buyukbese MA, Uzel M, Ekerbicer H, Karaoguz A (2005) Handgrip strength in patients with type 2 diabetes mellitus. Diabetes Res and Clin Pr 70(3): 278-286.
- Leenders M, Verdijk LB, Van der Hoeven L, Adam JJ, van Kranenburg J, et al. (2013) Patients with Type 2 diabetes show a greater decline in muscle mass, muscle strength and functional capacity with aging. J Am Med Dir Assoc 14(8): 585-592.
- Loprinzi PD, Loenneke JP (2015) Evidence of a Link between Grip Strength and Type 2 Diabetes Prevalence and Severity among a National Sample of U.S. Adults. J Phys Act Health 13(5): 558-561.
- Mainous III, AG, Tanner, RJ, Anton, SD, Jo A (2015) Grip strength as a marker of hypertension and diabetes in healthy weight adults. Am J Prev Med 49(6): 850-858.
- Li JJ, Wittert GA, Vincent A, Atlantis E, Shi Z, et al. (2016) Muscle grip strength predicts incident type 2 diabetes: population-based cohort study. Metabolism 65(6): 883-892.
- Wander PL, Boyko EJ, Leonetti DL, McNeely MJ, Kahn SE, et al. (2011) Greater hand-grip strength predicts a lower risk of developing type 2 diabetes over 10 years in leaner Japanese Americans. Diabetes Res Clin Pract 92(2): 261-264.
- Eckman M, Gigliotti C, Sutermaster S, Mehta K (2014) Get a Grip! Handgrip Strength as a Health Screening Tool. Proceedings of the 4th IEEE Global Humanitarian Technology Conference, GHTC. 242-248.
- Van der Kooi ALLF, Snijder MB, Peters RJG, Van Valkengoed IGM (2015) The Association of Handgrip Strength and Type 2 Diabetes Mellitus in Six Ethnic Groups: An Analysis of the HELIUS Study. PLOS ONE 10(9): e0137739.
- Katy Watson, Sarah Treanor (2016) How mutton flaps are killing Tonga. BBC News.
- Colagiuri S, Colagiuri R, Naati S, Muimuiheata S, Hussain Z, et al. (2002) The Prevalence of Diabetes in the Kingdom of Tonga. Diabetes Care 25(8): 1378-1383.
- World Health Organisation (2016) Global Report on Diabetes.

Top Editors
-

Mark E Smith
Bio chemistry
University of Texas Medical Branch, USA -

Lawrence A Presley
Department of Criminal Justice
Liberty University, USA -

Thomas W Miller
Department of Psychiatry
University of Kentucky, USA -

Gjumrakch Aliev
Department of Medicine
Gally International Biomedical Research & Consulting LLC, USA -

Christopher Bryant
Department of Urbanisation and Agricultural
Montreal university, USA -

Robert William Frare
Oral & Maxillofacial Pathology
New York University, USA -

Rudolph Modesto Navari
Gastroenterology and Hepatology
University of Alabama, UK -

Andrew Hague
Department of Medicine
Universities of Bradford, UK -

George Gregory Buttigieg
Maltese College of Obstetrics and Gynaecology, Europe -

Chen-Hsiung Yeh
Oncology
Circulogene Theranostics, England -
.png)
Emilio Bucio-Carrillo
Radiation Chemistry
National University of Mexico, USA -
.jpg)
Casey J Grenier
Analytical Chemistry
Wentworth Institute of Technology, USA -
Hany Atalah
Minimally Invasive Surgery
Mercer University school of Medicine, USA -

Abu-Hussein Muhamad
Pediatric Dentistry
University of Athens , Greece

The annual scholar awards from Lupine Publishers honor a selected number Read More...


