Lupine Publishers Group
Lupine Publishers
Menu
ISSN: 2637-4749
Review Article(ISSN: 2637-4749) 
The Surplus Value of HS-SPME/GC on the Rapid Quality Assessment of Dairy Products, Particularly Cheese, by The Volatile Components Profile Volume 5 - Issue 3
Lisete Paiva1,2 and José Baptista1,2*
- 1Department of Science of Physics, Chemistry and Engineering (DCFQE) and Institute of Agricultural and Environmental Research and Technology (IITAA), University of Azores, 9500-321 Ponta Delgada, Azores, Portugal
- 2Faculty of Science and Technology, University of Azores, 9500-321 Ponta Delgada, Azores, Portugal
Received: August 04, 2023; Published: August 11, 2023
Corresponding author: José Baptista, Faculty of Science and Technology, University of Azores, 9500-321 Ponta Delgada, Azores, Portugal
DOI: 10.32474/CDVS.2023.05.000218
Abstract
Food aroma is a sensory property produced by the interaction between chemical compounds and sensory receptors and, particularly, cheese aroma consumer perception is one of the foremost criteria for its preference and acceptance. Head-space solid phase microextraction gas chromatography (HS-SPME/GC) is commonly used for qualitative and quantitative analysis of volatile compounds in various food products, in which analytes are adsorbed directly on the stationary phase coated on the outer surface of fuse-silica, eliminates the needs for solvent-extraction and/or sophisticated apparatus, requires much less sample preparation and manipulation time per sample. Bearing all this in mind, the aim of the present study was to determine and to compare cheese aroma profiles, particularly from Azorean Region, influenced by climate, soil composition, seasons, different management, and feed practices, genetic modified cows, and probably different cheese-making technologies using HS-SPME/GC methodology. Significant differences were observed in levels of individual head-space volatiles in different cheese aroma samples.
Introduction
The Cheddared samples had greater levels of butanoic, hexanoic and octanoic acids. This can be attributed to the relatively high extent of lipolysis that is commonly desirable during cheese ripening. The Cheddar (medium cheese) and Parmesan cheese samples showed appreciable amounts of 2-methylpropanol, whereas the Mozzarella cheese sample contained relatively lower amounts of this branched alcohol, which was not detected in Edman cheese sample. 2-Heptanone amounts increased during ripening and were detected in all cheese samples except Parmesan, whereas 2-pentanone and 2-nonanone were only observed in some of the samples. Edam cheese sample showed the highest levels of ethanol and 2-octanone, whereas Mozzarella cheese presented the highest content of 1-heptanol, and Parmesan showed relatively high levels of 2-nonanone and 2-ethyl-1-hexanol, as compared with the other tested cheese samples.
Results
Cheese aroma is a balanced number of volatile compounds, such as fatty acids, esters, carbonyl compounds and alcohols, originated mainly from the metabolism of different microorganisms and activities of milk enzymes. The aroma equilibrium between vapor and aqueous phases is expected to be influenced by non-volatile molecules, such as saccharides, enzymes and proteins that appear as potential partners for aroma-macromolecules interactions [1]. The matrix effect in which the extraction takes place, particularly temperature, pH, salt concentration content, has great influence on the extraction rate. On the other hand, cheese aroma components belong to different classes of compounds with different polarities [2]. The efficiency of SPME-fibers on the extraction yield must be compared to decide which one is the most appropriate for the study of the aroma profile comparison of different cheese samples. Furthermore, the effect of heating temperature and extraction time of the sample vial on the analysis of headspace aroma components was also determined by measuring the GC peak area of total volatile compounds versus at different heating temperatures [3]. No sample extraction steps were used, except the addition of NaCl and eventually internal standard.
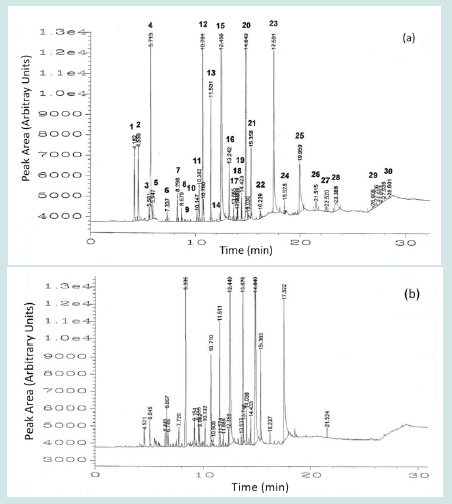
As the temperature of the sample vial increased, more molecules of cheese volatile components obtained energy from heating and moved to the headspace. The effect of temperature on gaseous sampling is complex. Temperature could affect the rate of diffusion, through the gas and distribution constants. At lower temperature, a slower diffusion rate would increase equilibrium times, and could cause an apparently low result as the equilibrium value would not have been reached within the normal sampling time [4]. In general terms, only compounds or groups of compounds with extremely strong odors have much influence on the cheese aroma. However, the effect of mixing odorous compounds is usually additive, but synergism and antagonism are known to occur. (Figure 1) illustrates the aroma grams (HS-SPME) of different cheese samples extracted with SPME-fiber (CW/DVB-65).
Figure 2: Identified aroma cheese compounds: 1. Ethyl acetate, 2. Ethanol, 3. Dimethyl sulfide, 4. 2-Propanone, 5. Diacyl, 6. Ethyl butanoate, 7. 2-Heptanone, 8. Ethyl hexanoate, 9. 3-Methyl-1-butanol, 10. 2-Octanone, 11. 2-Methylpropanol, 12. Isoamyl acetate, 13. 2-Nonanone, 14. Ethyl octanone, 15. Acetic acid, 16. Acetoin, 17. 2- Ethyl -1-hexanol, 18. 1-Heptanol, 19. 2,3-Butanediol, 20. Butanoic acid, 21. 2-Undecanone, 22. Ethyl decanoate, 23. Hexanoic acid, 24. 3-Methylbutyloctanone, 25. Octanoic acid, 26. 3-Methylbutyl decanoate, 27. Delta-decanoate, 28. Decanoic acid, 29. Dodecanoic acid, 30. Dodecanolactone.

The GC column (HP-FFAP fused capillary column, 25 m x 0.32 mm id with 0.52 μm film thickness) was programmed from a low temperature, and consequently the desorbed analytes condensed at the head of the column and slowly eluted as the temperature is increased. The analytical conditions were as follows: injector 250 °C and detector 300 °C were held constant during analysis; oven temperature was maintained at 40 °C for 5 min, followed by a linear programmed temperature from 40 to 200 °C at a rate of 5 °C.min-1. The carrier gas was helium, 28 cm.sec-1 at 40 °C. (Figure 1) shows the most representative cheese aroma components of different types of cheese: (a) Cheddar (medium cheese); (b) Parmesan; (e) Edman and (d) Mozzarella.
Conclusion
The combination of HS sampling with SPME allowed us to achieve a typical aromatic profile and a relative composition of the volatile cheese components, including the free fatty acids up to dodecanoic acid in a single-step technique. The HS-SPME/GC methodology, used in this study for aroma profile determination, was easy, and under consistent sampling conditions volatiles can be extracted with good precision over a wide range of concentrations. Compared with traditional techniques, this methodology shows enormous advantages: solvent-free extraction (environment-friendly), low cost, and no need for previous sample preparation. The technique is a suitable method for characterizing and comparing cheese volatile profiles both among- and within-varieties and may provide means to monitor changes in levels of specific cheese volatile components during ripening time.
References
- Baptista JAB, Tavares JFP, Carvalho RCB (2000) Investigation of cheese aroma by HS-SPME/GC as a potential screening tool for Quality Assessment. Açoreana 9(2): 179-192.
- Arthur CL, Pawliszin J (1999) Solid phase microextraction with termal desorption using fused silica fibers. Anal Chem 62: 2145-2148.
- Aston JW, Creamer LK (1986) Contribution of the components of the water-soluble fraction to the flavor of Cheddar cheese. New Zeland J Dairy Sci Tech 21: 229-248.
- Bouzas J, Kantt CA, Bodyfelt FW, Torres JÁ (1993) Time and temperature influence on chemical aging indicators for commercial Cheddar cheese. J Food Sci 58(6): 1307-1313.

Top Editors
-

Mark E Smith
Bio chemistry
University of Texas Medical Branch, USA -

Lawrence A Presley
Department of Criminal Justice
Liberty University, USA -

Thomas W Miller
Department of Psychiatry
University of Kentucky, USA -

Gjumrakch Aliev
Department of Medicine
Gally International Biomedical Research & Consulting LLC, USA -

Christopher Bryant
Department of Urbanisation and Agricultural
Montreal university, USA -

Robert William Frare
Oral & Maxillofacial Pathology
New York University, USA -

Rudolph Modesto Navari
Gastroenterology and Hepatology
University of Alabama, UK -

Andrew Hague
Department of Medicine
Universities of Bradford, UK -

George Gregory Buttigieg
Maltese College of Obstetrics and Gynaecology, Europe -

Chen-Hsiung Yeh
Oncology
Circulogene Theranostics, England -
.png)
Emilio Bucio-Carrillo
Radiation Chemistry
National University of Mexico, USA -
.jpg)
Casey J Grenier
Analytical Chemistry
Wentworth Institute of Technology, USA -
Hany Atalah
Minimally Invasive Surgery
Mercer University school of Medicine, USA -

Abu-Hussein Muhamad
Pediatric Dentistry
University of Athens , Greece

The annual scholar awards from Lupine Publishers honor a selected number Read More...


