Lupine Publishers Group
Lupine Publishers
Menu
ISSN: 2637-4749
Research Article(ISSN: 2637-4749) 
Horse Activity Responses to an Elevated Temperature Humidity Index in the Arid Southwest Volume 5 - Issue 4
Duarte E Diaz1, Colt W Knight2, Ashley D Wright1, Pablo C Grijalva1 and Elizabeth A Greene1*
- *1Cooperative Extension, University of Arizona, Tucson, USA
- 2Cooperative Extension, University of Maine, Orono, USA
Received: June 26, 2023; Published: June 30, 2023
Corresponding author: Elizabeth A. Greene, University of Arizona, Shantz Bldg (#38), Room 239, P.O. Box 210090, Tucson, AZ 85721, USA
DOI: 10.32474/CDVS.2023.05.000217
Abstract
In Arizona, where high temperatures (>32°C) are typical, there are limited data on horse behavior, activity, and voluntary use of shade structures to block solar radiation as temperatures rise. This study aimed to examine if increasing Temperature Humidity Index (THI) affected the amount of time horses spent near a shade structure during daylight hours and/or decreased overall activity. From June through August 2017, four paddocks with existing small shade structures at the UArizona Equine Center were utilized to determine equine voluntary shade usage. Two groups of horses were fitted with global positioning system tracking collars, and animals’ locations were recorded daily for 15 hours at 5-second intervals (0500-2000). Each group spent one collection period (two days adaptation, five days data collection) in each paddock. Variations in heat and humidity were normalized by calculating THI for each hour of the collection period, ranging from 62.7 to 85.5 (averaging 78.3). Horses were considered near the shade when they were within 15m of the center of the shadow cast by shade. Overall, horses spent little time near the shade (average 8%) during data collection hours, and shade use behavior was not correlated with hourly THI changes, or distance traveled (activity). Horses elected to spend more time close to supplemental feeding areas than shade structures. In conclusion, horse activity to seek shade was not affected by increasing THI at levels observed in this study; however, paddock orientation, water trough location, and supplemental feeding location played significant roles in overall shade usage.
Keywords:Horse; Shade; Heat Stress; Activity; Temperature Humidity Index; GPS
Introduction
Limited information is available on the behavioral responses of Equidae in high-temperature environments. Elevated ambient temperatures can cause animals to adjust using several behavioral and physiological mechanisms to prevent physiological dysfunction and allow for environmental adaptation [1]. Christopherson and Young [2] defined the Thermoneutral Zone (TNZ) as the range of temperatures in which an animal can maintain a consistent body temperature in the short term with little or no additional energy expenditure. The TNZ for horses has been estimated to be 5-25°C [3]. Other studies have proposed different upper critical temperatures ranging from 20°C to 25°C and up to 30°C, based on metabolic rate, evaporative heat loss, and when maximal peripheral vasodilation occurs, respectively [4,5]. Most homeotherms have a much narrower thermoneutral zone, however, due to their high level of insulative properties, horses have a wider range in their TNZ [3]. The TNZ can vary significantly depending upon an animal’s age, body condition, breed, and hide color, as well as the relative humidity of the environment, wind velocity, ambient temperature, and the degree of solar radiation [6]. When a combination of environmental factors results in conditions that exceed the TNZ of the animal, an imbalance in the heat exchange between the animal and its surrounding environment may result in increasing amounts of heat storage [7]. The basic thermoregulatory strategy of mammals is to maintain a body core temperature higher than ambient temperature, thus al- lowing heat to flow out from the core and be dissipated into the environment. This heat flow exchange is done through conduction, convection, radiation, and evaporation [8]. with all but evaporation relying on an ambient temperature that is lower than the core body temperature. When environmental temperatures approach the body temperature, evaporation is the only remaining viable route of heat loss. Evaporative cooling, particularly the evaporation of sweat from the skin and, to a lesser extent, evaporation from the respiratory tract, provide a primary means for heat loss during heat exposure [9]. As a result of these physiological adaptations, horses have a remarkable ability for heat dispersal.
The simplest and most practical way to alleviate heat stress is by providing the animals with access to shade. Trees are a common source, and the leaves provide shade and evaporative cooling [10]. However, animal crowding, rubbing on, and/or chewing of the trees can permanently damage the tree and/or its root system, resulting in the eventual loss of the tree. More importantly, some trees can provide a source of dietary toxicity through the consumption of secondary plant metabolites or insect residues [11]. Man-made shade structures are another viable option for providing shade (if well-constructed and designed) without the potential issues associated with trees. Using a shade structure alone has been shown in cattle to decrease heat load by 30 to 50% [8]. Traditionally, ambient temperature has been used to estimate animal heat tolerance and to establish TNZs. The Temperature-Humidity Index (THI) has been suggested to be a more complete method since it considers both ambient air temperature and relative humidity. Temperature and humidity index can be calculated using the following formula:

Where: Tdb represents dry bulb temperature °C, and RH represents relative humidity percentage. This standard THI equation has a weighted contribution of relative humidity. One advantage of using this index is that it would allow for more accurate comparisons between heat stress studies. For example, a study conducted in a tropical region with a relative humidity of 85% and a temperature of 30°C would yield the same THI as a 38°C plus 25% relative humidity dry environment (83 THI). In this same line, a more accurate tool would be using an equation that uses the wet bulb variable (measures temperature, humidity, wind, and solar radiation). However, since solar radiation specifically is a much more difficult data point to obtain, we propose THI is a more valuable marker.
Studies have evaluated equine responses in relation to heat stress using several observations (shade use, standing near or away from water, activity level, and foraging behavior) [6,12-14]. However, in Arizona, there is limited data on responses of horses as temperature, or more importantly as THI, rises. The objective of this study was to examine if increasing THI resulted in increased time spent by horses near a shade structure and/or water source during daylight hours or decreased the overall activity of horses.
Figure 3: Time by shade for horses in the three daytime periods. Periods were defined as AM (0500-0959), Noon (1000-1459), and PM (1500-2000).

Figure 4: Time by shade in differently oriented paddocks (changes in meters per day %). Paddocks one and two (North to South orientation) were 4895 and 4852 m2, respectively, and paddocks three and four (East to West orientation) were 2060 and 3328 m2, respectively.

Figure 5: Time by water for horses in the three daytime periods. Time periods were defined as AM (0500-0959), Noon (1000- 1459), and PM (1500-2000).
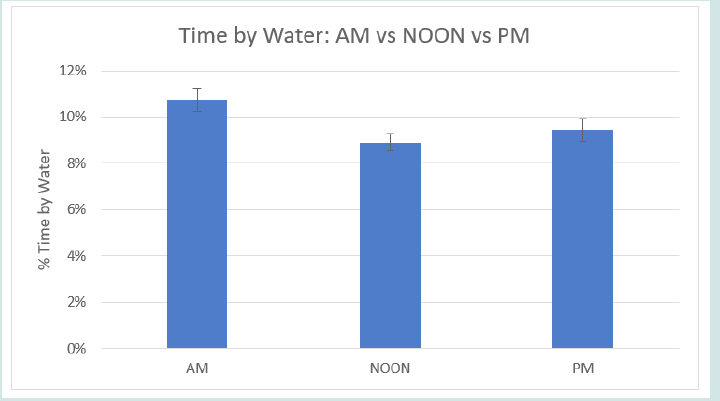
Figure 6: Heat signature map image example for all paddocks for one day (0500-2000) of the experimental period. Black circle represents the location of the shade structure, blue triangle, the location of the supplemental feeding area, and the white rectangle, the location of the water troughs.

Figure 7: Time by water in differentially oriented paddocks (changes in meters per day %). Paddock one and two (North to South orientation) were 4895 and 4852 m2 respectively and paddocks three and four (East to West orientation) were 2060 and 3328 m2 respectively.

Materials and Methods
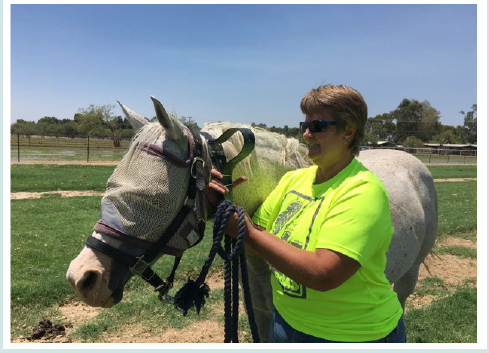
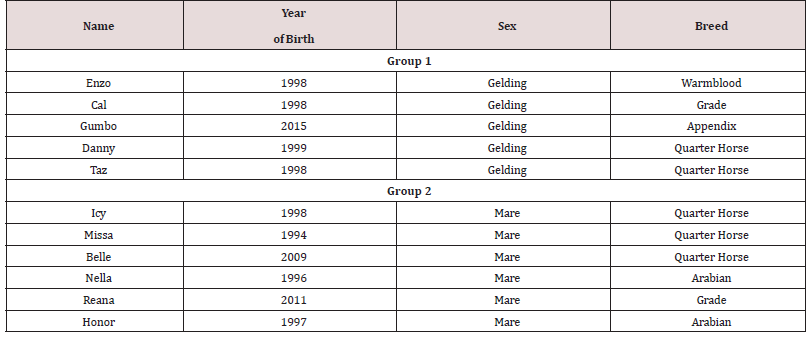
The experiment was conducted during the summer of 2017 (June-August) at the University of Arizona Campus Agricultural Center and Experiment Station (Tucson, Arizona, USA). Approval for this study was obtained from the University of Arizona Institutional Animal Care and Use Committee (Protocol 18332). Procedures and care of the animals adhered to the Guide for the Care and Use of Agricultural Animals in Agricultural Research and Teaching (FASS, 2010). Mature horses (n=11) consisting of groups of 5 geldings (Group 1) and 6 mares (Group 2) were fitted with Knight GPS Tracking Collars [15] (Figures 1 and 2) and rotated through 4 paddocks. The groups were pre-existing with an established social structure. The estimated mean age of group 1 was 15.4±7.5 years, and group 2 averaged 15.6±7.25 years (Table 1). All horses in the study were in good health and received a regular health check before the experiment. All groups were rotated through each of the four experimental paddocks, and the groups of horses were never in adjacent paddocks throughout the experiment. Two paddocks were oriented (rectangular shape) North to South, while the other two were oriented East to West. Paddocks one and two (North to South orientations) were 4895 and 4852 m2, respectively, and paddocks three and four (East to West orientations) were 2060 and 3328 m2, respectively. Each paddock contained a shade structure with dimensions of 3.81 m by 7.82 m in diameter, 3.35 m in height at the high end, with a 0.10m decrease in incline to the low end. The roof material was aluminum, and all sides were open. Paddocks were pre-existing structures on the Experiment Station, and we had no control over their dimensions or size. Environmental conditions were monitored by an on-site weather station (AZMet 1 km Northwest of the intersection of Campbell Ave. & Roger Rd, Tucson, AZ). Environmental data were collected hourly from 0500 to 2000 each day, and each data point included year, day of year, hour of day, air temperature, relative humidity, solar radiation and precipitation. The average temperature and relative humidity obtained from the weather station were used to calculate the THI values. Temperature humidity index [16].

Where: Tdb represents dry bulb temperature °C, and RH represents relative humidity percentage. Under shade temperature and relative humidity were monitored by Easy Log data loggers (Lascar Electronic Inc. Erie, PA) placed at the Northwest corner of every shade structure and 6 meters to the west of each shade structure at a height of 0.6 m to evaluate under shade temperature in comparison to that of the environment.
Individual activity data were gathered on horses using GPS fixed every 5 seconds, averaged hourly, and then analyzed across the three time periods, AM (0500-0959), NOON (1000-1459), and PM (1500-2000). The overall data collection period was chosen based upon the typical hours of sunrise (0515) and sunset (1930) at that time of year in Tucson, AZ. Researchers utilized Universal Transverse Mercator (UTM) coordinates to record animal location and distance between points to estimate distance traveled which served as an activity indicator. Euclidean distance tools in ArcGIS (v. 10.2.2, Esri) were utilized to calculate distance from water. Shadows cast by shade structure were calculated and averaged into three time periods, AM (0500-0959), NOON (1000-1459), and PM (1500-2000), using a Google Earth (Google LLC, Mountain View CA, USA) and structure shadow calculator (http://shadowcalculator. eu). Horses were near shade if their GPS coordinate fell within a 15 m radius of the center of shade cast by the shade structure. After a 2-day adaptation period in each paddock, data was collected for each horse for an additional five days. The groups were then switched to another experimental paddock. This protocol was repeated for a total of 4 consecutive trials so that each group spent one data collection period in each of the experimental paddocks.
Statistical Analysis
Data were analyzed using the PROC GLM procedure of SAS (v. 9.4, SAS Institute Inc., Cary, NC) as a 2 x 2 factorial design with the LSMEANS and PDIFF options. The horse served as the experimental unit. Time (AM, Noon, PM), paddock orientation and the interactions between time and paddock orientation were tested by the PDIFF option and were declared significant at P <0.05.
Results/Discussion
Data gathered by Knight GPS collars in this study had an Estimated Horizontal Position Error (EHPE) of 867 cm (Table 2). The EHPE represents the estimated resolution of GPS fixes calculated by the GPS unit based on the number of satellites and the strength of the satellite signal. Overall, horses spent little time near the shade (average 8%) during data collection hours (Figure 3), and shade use activity was not correlated with hourly THI changes (r2(9) =0.0042). Additionally, THI was not correlated (r2(9) =0.0017) with distance traveled (activity). No differences were detected between mares and geldings in activity (P=0.773), time spent by water (P=0.669), or time spent near shade (P=0.160). Groups 1 and 2 were then combined for further data analysis. As expected, the temperature under the shade structure was significantly lower in each of the three time periods (P<0.001) with a peak of 30C difference in peak temperature hours (Noon and PM). We can, therefore, also conclude that this group of horses did not avoid the shade structures due to increased temperature under the shade due to the materials used in construction, as has been proposed as a potential issue with some types of shade structures. Time periods AM (0500-0959), Noon (1000-1459), and PM (1500-2000) had a significant effect on several of the parameters evaluated. During the experimental period, THI rapidly increased between morning (avg. 74.2), and the Noon (avg. 80.5) and afternoon (avg. 79.9) periods, with peaking values at around 1500 hours. Interestingly, horses in our experimental groups had a slight but significant (P<0.001) increase in activity (distance traveled) during the Noon period (10 m more per hour across the entire five h period), with the AM and PM activity levels remaining similar. Time by paddock orientation interactions showed that the effect was only detected when horses were in the North to South (NS) oriented paddocks (Table 2, Figure 4). These differences may be due to the placement of the shade structures in relation to the water trough and supplemental feeding (hay) There was no significant difference in time spent by water between AM, NOON, and PM time periods (Figure 5). Water troughs in the East to West (EW) oriented paddocks were located at the opposite end of the paddocks from the supplemental feeding areas, with horses having to pass by the shade structure to get water. In the NS oriented paddocks, the water trough and supplemental feeding areas were located next to each other (Figure 6). Therefore, horses possibly moved more in the EW paddocks due to the different locations of the water trough (Figure 4) and supplemental feed area. Horses in the NS paddock orientation had no need to move near the shade structure to get either water or supplemental feed.
Table 2: Least square means and tests of significance for Distance Traveled (meters by period), Time by Shade (%), Time by Water (%), and EHPE (meters).
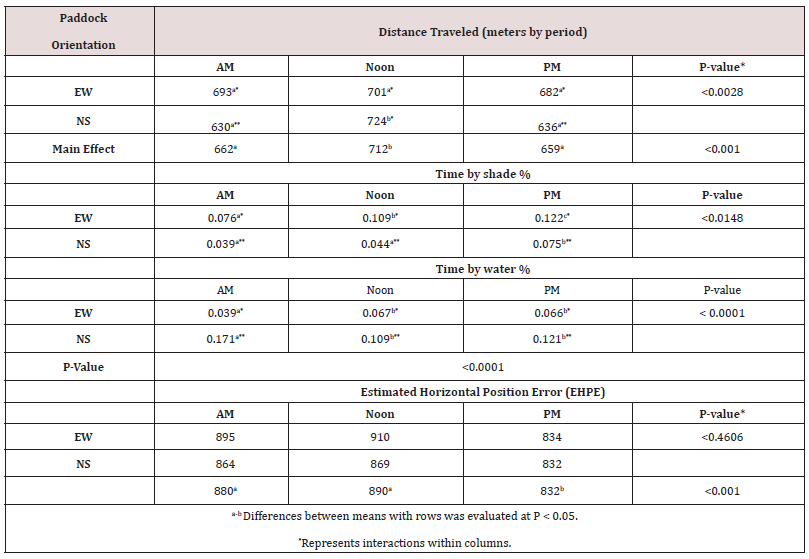
Regardless of paddock orientation or the location of water and feed relative to shade structures, horses in this study preferentially chose to be near supplemental feed more than shade, even in highest of THI. Interactions were observed between time spent by water and paddock orientation (P=0.0148) and time spent by shade by paddock orientation (P<0.0001) and are reported in Table 2. Horses in the NS paddocks spent more time (Figure 7) by water (13%) than in the EW paddocks (6%). Inversely, horses in the NS paddocks spent less time (Figure 4) by shade (5%) than when on the EW paddocks (10%). Again, these results support the original observation that the location of feed and water strongly influenced horse activity. The EW oriented paddocks had feed and water located in such a way that horses had to traverse near the shade structure when traveling between the two. In contrast, the NS oriented paddocks had feed and water located near each other on the same side of the shade structure (Figure 6). The limited activity impact of extreme environmental conditions in this study is in stark contrast with most of the other studies previously found in the literature.
Snoeks et al. [12] found that at temperatures higher than 30°C, horses spent more than 70% of their total time under shade. Although authors reported obtaining RH from the weather station, they did not present these events as correlated to temperature. Therefore, we were unable to calculate THI and make more thorough comparisons. Several other studies have shown significant increases in under-shade time during increasing temperatures associated with summer [12-14]. In their experiment, however, Holcomb et al. [17], found significant increases in artificial shelter use. Based on calculations of the reported temperature and RH data, THI during peak temperature hours (0900 to 1800 h) would be peaking at 74-75 THI. In our experimental conditions, 74 THI represented the mean of morning THI, the coolest daytime THI (peaking at 80 at midday).
Several reasons could justify our different results. Of note is that in their experiment, Holcomb et al. [17] utilized small paddock structures compared to the larger paddocks in this experiment. These smaller enclosed areas do not allow for natural airflow and cooling compared to open paddocks. Another important factor we should consider in comparison is that the average age of the horses in this study was 15 years for both mares and geldings, with most of their lifetimes spent in the Southern Arizona climate. Horses in our study are most likely adapted to high temperatures, and as a result, their behavior in response to elevated THI would be influenced by their level of adaptation. Heat acclimatization is the ability to adapt physiologically and biochemically to new environmental conditions [18]. In homeotherms, the signs of acclimatization include lower core temperature, reduced heart rate, decreased metabolic rate, and increased rate of evaporative cooling [19]. The main adaptations that reflect heat acclimation are those that enhance the dissipation of heat from the body’s surface, including increased convection of heat from contracting muscles to the skin, improved cutaneous blood circulation, increased sweating rate, and lowered sweating threshold, and improved heat dissipation through the respiratory tract [20]. All data points in our study supported that horses were not heat-stressed enough to trigger shade-seeking activity, especially in relation to feeding activity (even supplemental feeding). In endothermic species, the regulation of core body temperature is a priority over other physiological functions [21], and feed intake is negatively impacted early in the stages of heat stress development [8].
Even though the environmental conditions in this study would be considered extreme in many other regions, horses preferred to spend time near supplemental feed areas over seeking shade (Figure 6). Therefore, this preference to be near feeding areas over shade indicates that horses in this study had very well-adapted thermoregulation mechanisms to cope with high temperature environments. The differences with other previous studies also highlighted the need to include relative humidity in these types of experiments to enable standardized comparisons.
Conclusions
Domestic horses in this study spent about 8% of their time near shade structures during the peak environmental THI conditions. These horses spent most of the daytime hours in temperatures well above previously described thermoneutral zones with minimal impacts on activity. Based on this study, it is worth considering using a broader set of parameters, including the influence of longterm adaptation when establishing TNZs in horses. In that general sense, recommendations about heat stress control should have a regional focus. Shade should, however, be provided for all horses kept in hot environments, but its use should not be expected. We also suggest that the utilization of THI, or minimally the inclusion of both temperature and RH be standardized in future heat stress studies to make comparisons between experiments more relevant.
This research did not receive any specific grant from funding agencies in the public, commercial, or not-for-profit sectors.
References
- Kadzere CT (2002) Heat stress in lactating dairy cows: a review. Livestock production science 77(1): 59-91.
- Christopherson R, Young B (1986) Effects of cold environments on domestic animals. NATO advanced science institutes series: Series A: Life Sciences, USA.
- Morgan K (1998) Thermoneutral zone and critical temperatures of horses. Journal of Thermal Biology 23(1): p. 59-61.
- Morgan K (1997) Effects of short-term changes in ambient air temperature or altered insulation in horses. Journal of Thermal Biology 3(22): 187-194.
- Collier RJ (2008) Invited review: genes involved in the bovine heat stress response. Journal of dairy science 91(2): 445-454.
- Cymbaluk NF, Christison GI (1990) Environmental effects on thermoregulation and nutrition of horses. Veterinary Clinics of North America: Equine Practice 6(2): 355-372.
- St-Pierre N, Cobanov B, Schnitkey G (2003) Economic losses from heat stress by US livestock industries. Journal of dairy science 86(5): E52-E77.
- Collier RJ, Dahl G, VanBaale M (2006) Major advances associated with environmental effects on dairy cattle. Journal of dairy science 89(4): 1244-1253.
- Hodgson DR, Davis F (1994) McConaghy, Thermoregulation in the horse in response to exercise. British Veterinary Journal 150(3): 219-235.
- Armstrong D (1994) Heat stress interaction with shade and cooling. Journal of dairy science. 77(7): 2044-2050.
- Webb BA (2004) Eastern tent caterpillars (Malacosoma americanum) cause mare reproductive loss syndrome. Journal of insect physiology 50(2-3): 185-193.
- Snoeks MG (2015) Behavior of horses on pasture in relation to weather and shelter-A field study in a temperate climate. Journal of veterinary behavior 10(6): 561- 568.
- Heleski CR, Murtazashvili I (2010) Daytime shelter-seeking behavior in domestic horses. Journal of Veterinary Behavior 5(5): 276-282.
- Crowell-Davis SL (1994) Daytime rest behavior of the Welsh pony (Equus caballus) mare and foal. Applied Animal Behaviour Science 40(3-4): 197-210.
- Knight C, Bailey D, Faulkner D (2018) Low-cost global positioning system tracking collars for use on cattle. Rangeland Ecology & Management 71(4): 506-508.
- Moran J (2005) Tropical dairy farming: Feeding management of small holder farms in the humid tropics. Landlinks Press pp. 312.
- Holcomb K, Tucker C, Stull C (2014) Preference of domestic horses for shade in a hot, sunny environment. Journal of animal science 92(4): 1708-1717.
- Horowitz M (2011) Heat acclimation, epigenetics, and cytoprotection memory. Comprehensive Physiology 4(1): 199-230.
- Horowitz M (2003) Matching the heart to heat-induced circulatory load: heat-acclimatory responses. Physiology 18(6): 215-221.
- Gisolfi C (1987) Influence of acclimatization and training on heat tolerance and physical endurance. Heat Stress: physical exertion and environment pp. 355-366.
- Hansen PJ (2009) Effects of heat stress on mammalian reproduction. Philos Trans R Soc Lond B Biol Sci 364(1534): 3341-3350.

Top Editors
-

Mark E Smith
Bio chemistry
University of Texas Medical Branch, USA -

Lawrence A Presley
Department of Criminal Justice
Liberty University, USA -

Thomas W Miller
Department of Psychiatry
University of Kentucky, USA -

Gjumrakch Aliev
Department of Medicine
Gally International Biomedical Research & Consulting LLC, USA -

Christopher Bryant
Department of Urbanisation and Agricultural
Montreal university, USA -

Robert William Frare
Oral & Maxillofacial Pathology
New York University, USA -

Rudolph Modesto Navari
Gastroenterology and Hepatology
University of Alabama, UK -

Andrew Hague
Department of Medicine
Universities of Bradford, UK -

George Gregory Buttigieg
Maltese College of Obstetrics and Gynaecology, Europe -

Chen-Hsiung Yeh
Oncology
Circulogene Theranostics, England -
.png)
Emilio Bucio-Carrillo
Radiation Chemistry
National University of Mexico, USA -
.jpg)
Casey J Grenier
Analytical Chemistry
Wentworth Institute of Technology, USA -
Hany Atalah
Minimally Invasive Surgery
Mercer University school of Medicine, USA -

Abu-Hussein Muhamad
Pediatric Dentistry
University of Athens , Greece

The annual scholar awards from Lupine Publishers honor a selected number Read More...


