Lupine Publishers Group
Lupine Publishers
Menu
ISSN: 2637-4749
Research Article(ISSN: 2637-4749) 
Evaluation of Terminal Sire Breed on Carcass and Muscle Composition in Pasture-Finished Lambs Volume 4 - Issue 5
Maggie Justice1*, Maslyn A Greene1, Megan Dennis2, Kathryn Hart1, Lauren Humphrey1 and Susan K Duckett1
- 1Department of Animal and Veterinary Sciences, Clemson University, USA
- 2Department of Food, Nutrition, and Packaging Sciences, Clemson University, USA
Received: January 18, 2022; Published: January 31, 2022
Corresponding author: S Maggie Justice, Department of Animal and Veterinary Sciences, Clemson University, USA
DOI: 10.32474/CDVS.2022.04.000198
Abstract
A Texel ram was mated to Suffolk ewes to evaluate how using a terminal sire breed would alter carcass and muscle composition compared to traditional breeds, Suffolk and Southdown. Southdown (SD), Suffolk (SU) or SU x Texel (TX) lambs (n = 21) were weaned and finished on mixed annual pastures to a final live weight of 59 kg. Lambs were slaughtered at a similar body weight and evaluated for differences in performance, carcass composition, fatty acid composition, myostatin, and tenderness. Lamb performance was similar between breeds during post-weaning phase but lower (P < 0.05) for TX than SD or SU during the preweaning phase. Texelsired lambs had carcasses with a higher (P < 0.05) dressing percentage, hot carcass weight, ribeye area and quality grade. Southdown lambs had carcasses with higher (P < 0.05) yield grade number and fat thickness. Individual muscle weights were altered for TX carcasses with gluteus medius, biceps femoris, semitendinosus, and adductor being heavier (P < 0.05) than SD or SU. Saturated fatty acid concentration was lower (P < 0.05) and n-3 polyunsaturated fatty acids higher (P < 0.05) in TX muscles compared to SD or SU. Expression and protein levels of myostatin in longissimus muscle were similar between breeds. Shear force values were greater (P < 0.05) in TX longissimus muscle at d 4 and 6 of postmortem aging and in the gluteus medius at 6 d of postmortem aging. Shear force values of the leg muscles examined did not differ by sire breed. The use of a Texel ram as a terminal sire in this study produced carcasses with greater dressing percentage and muscle mass in lambs finished on pasture. In addition, muscle n-3 PUFA concentration was greater, but loin and sirloin muscles were tougher for TX compared to SD and SU.
Keywords:Texel; carcass; fatty acid; tenderness
Introduction
Texel sheep have increased muscularity due to a single nucleotide polymorphism (SNP; c. *1232 G > A) in the myostatin (MSTN) gene (1, 2). This SNP in MSTN creates a binding site for microRNAs (miRNAs) to bind to the seed sequence in MSTN 3’ UTR (ACATTCCA) and inhibit translation into functional protein [1,2]. Serum myostatin concentrations are reported to be reduced by one-third that of wild type in Texel sheep (1). Double muscled cattle also have reduced myostatin due to mutations in the MSTN gene which results in loss of functional myostatin and increases muscle mass by 20 to 25% [3]. Myostatin is a negative regulator of muscle growth and reduces paired box 7 (PAX7) expression in skeletal muscle [4]. Loss of myostatin increases PAX7 expression which stimulates satellite cell self-renewal and postnatal skeletal muscle hypertrophy. Comparisons between Texel and Scottish Blackface sheep found larger ribeye area, increased muscle fiber number, and lower intramuscular fat content in Texel lambs [5].
In mice, myostatin has been shown to have a role in adipose tissue deposition where it regulates adipogenesis [6,7]. Research in pigs with a knock-out of MSTN reported lower intramuscular fat content, altered fatty acid desaturation and increased carcass leanness [8]. In a comparison of sire breeds, Texel-cross lambs had leaner carcasses with lower fat thickness measures at the 12th rib and carcass fat percentage when finished on concentrates [9]. Finishing system utilized can alter fat deposition in Texel lambs. Supplementation at increasing levels on Brachiaria pasture increased external fat deposition and fat thickness in carcasses from Texel lambs supplemented at 1.6% and 2.4% of body weight similar to feedlot finished; whereas carcass fat thickness was lower in lambs supplemented at 0 and 0.8% of body weight. The objective of this study was to examine differences in growth, carcass composition, fatty acid composition, shear force and myostatin in Texel-cross lambs compared to Suffolk and Southdown lambs finished on pasture.
Materials and Methods
All animal experimental procedures were reviewed and approved by the Clemson University Institutional Animal Care and Use Committee (AUP 2018-037).
Lambs
A Texel ram (TX; Texel muscled, Geneseek) was mated to Suffolk ewes (n = 15) to evaluate the use of this breed as a terminal sire in comparison to our traditional breeds of Suffolk and Southdown. All lambs were produced under similar conditions at the Small Ruminant Facility at Clemson University. At weaning, lambs (n = 7/breed type) from the SU x TX matings were obtained as well as purebred Southdown (SD) and Suffolk (SU) lambs to use as a comparison. Weaning weights were adjusted based on dam age, sex, type of birth and rearing according to the Sheep Production Handbook (2015, American Sheep Industry Association). Lambs were finished on mixed annual pastures (Ray’s Crazy Summer and Fall Mixes, Southeast AgriSeeds, Rome GA) until they reached 59 kg live weight. Lambs were fasted overnight and transported (14.3 km) to the Clemson University Meat Lab. Hot carcass weight (HCW) was obtained for each carcass at the end of the slaughter process.
DXA Analysis
Fat mass and carcass fat percentage were estimated using Dual X-Ray Absorptiometry (DXA) on a Hologic Discovery QDR Series (Hologic, Inc., Bedford, MA, USA) densitometer. The right side was scanned whole. The left side was cut into wholesale cuts and each cut scanned separately. Additional information on validation of DXA scans and prediction equations are available in [10]
Carcass Dissection
Carcasses were cooled in a standard meat cooler (2.2°C) for 24 hours. At 24h postmortem, the carcass was then split in half. The right half of the carcass was kept intact and used for DXA scanning. After scanning, the right half was ribbed at the 12/13th rib and standard carcass variables were measured (ribeye area, REA; fat thickness, FT; body wall thickness, BW; flank streaking, FS; conformation, CON; quality grade, QG; yield grade, YG; USDA, 1992). The left half was cut into four primal cuts: shoulder (IMPS 207), rack (IMPS 204), loin (IMPS 242) and leg (IMPS 233; USDA, 2014). Weights of each primal were recorded and DXA scans taken for compositional analyses. After DXA scans were completed, the left side was used for individual muscle dissection, weighing and grinding. The major muscles were dissected and weighed from each primal: shoulder (longissimus muscle), rack (longissimus muscle), loin (longissimus muscle, LM; psoas major and minor [PM]), and leg (gluteus medius [GM], biceps femoris [BF]; semitendinosus [ST]; semimembranosus [SM]; adductor [AD]; and quadriceps femoris [QF]. Then all remaining muscles and fat from each primal cut were then removed and ground twice. Ground samples from each primal cut were thoroughly mixed by hand and subsamples taken for total lipid analyses.
Total Lipid
A total lipid analysis was performed on the individual primal from the left half. In brief, an aliquot of the ground sample for each primal cut were sampled for moisture content by weight loss after drying at 95°C for 24 hr. A second aliquot was then taken from each primal, chopped and mixed using a Blixer (Blixer3 Series D, Robot Coupe Inc., Ridgeland, MS) and lyophilized (VirTis, SP Scientific, Warminster, PA). Total fat content from each primal was then determined by using Ankom XT-15 Extractor (Ankom Technology Macedon, NY) and hexane solvent [11].
Fatty acid
Muscle samples were frozen, lyophilized, and ground in a food processor. Freeze-dried samples were transmethylated according to the method of Park and Goins [12]. Fatty acid methyl esters (FAME) were analyzed using an Agilent 6850 (Agilent, SantaClara, CA) gas chromatograph equipped with an Agilent 7673A (Agilent) automatic sampler. Separations were accomplished using a TR-FAME capillary column (0.25 mm i.d., 0.20μm film thickness, 120 m). Column oven temperature increased from 150 to 160°C at 1°C per minute, from 160 to 167°C at 0.2°C per min, from 167 to 225°C at 1.5°C per minute, and then held at 225°C for 16 min. The injector and detector were maintained at 250°C. Sample injection volume was 1μL. Hydrogen was the carrier gas at a flow rate of 1 mL per minute. Samples were run twice with a split ratio of 100:1 for trans C18:1 and long-chain fatty acids, and again at split ratio of 10:1 for CLA and omega-3 fatty acids. Individual fatty acids were identified by comparison of retention times with standards (Matreya, Pleasant Gap, PA). Fatty acids were quantified by incorporating an internal standard, methyl tricosanoic (C23:0) acid, into each sample during methylation and expressed as a weight percentage of total fatty acids.
Shear force
From the LM and SM, chops (2.5 cm thick) were cut, vacuum packaged and randomly assigned to 4 or 6 d of postmortem aging at 4°C. Chops were also obtained from ST and GM and aged to 6 d postmortem. At the end of the aging period, all chops were frozen for approximately 30 d at -20°C. Chops were thawed for 24 h at 4°C and broiled on BBQ Guys (Baton Rouge, LA) electric grills to an internal temperature of 71°C. Chops were allowed to cool to room temperature before three 1.27-cm-diameter cores per chop were removed parallel to the longitudinal orientation of the muscle fibers. All cores were sheared perpendicular to the long axis of the core using a Warner-Bratzler shear machine (G-R Manufacturing, Manhattan, KS).
qPCR
Total RNA was isolated from the muscle samples using the TriZol procedure (Invitrogen; Thermo-Fisher, Waltham, MA, USA), which included an additional purification step (Pure Link columns, Invitrogen, Thermo Scientific, Waltham, MA). Total RNA was quantified using a Nano Drop spectrophotometer (Invitrogen) and quality assessed using an Agilent Bioanalyzer (Agilent, Santa Clara, CA, USA). The RNA integrity number (RIN) for all samples was 7 or greater. The RNA (1 ug) was reverse transcribed using QuantaBio qScript (VWR) and used for quantitative PCR. Several housekeeping genes (glyceraldehyde 3-phosphate dehydrogenase [GAPDH], β-actin [ACTB], cyclophilin [CYCLOPHILINB], ribosomal subunit 9 [RPS9], and tubulin [TUB]) were evaluated to normalize the data using Ref Finder [13]. The most stable housekeeping gene for both tissue types was GAPDH, which was used for data normalization. Normalized CT values (ΔC T = CT Gene−CTGAPDH) were calculated for each sample. The relative quantification was the ratio of the target gene to housekeeping gene using the ΔΔCT method.
Western Blot
Proteins were extracted from longissimus muscle of each lamb using T-PER tissue protein extraction reagent (Thermo Fisher). Total protein content was determined using Coomassie-plus protein Assay (Thermo Fisher). Protein samples were denatured in loading buffer (LiCor) with ß--mercaptoethanol and heated for 4 min at 95ºC. Samples (40 ug) were separated on TGX Tris-Glycine PAGE Any kDa gels (BioRad) using a Mini Protean Tetra Cell (BioRad) at 200 volts for 30 min. Kaleidoscope pre-stained standard (BioRad) and Chameleon Duo pre-stained protein ladders (LiCor) to run on each gel to visualize transfer efficiency and identify protein mass on imaging blot. Gels were transferred to Immobilon-FL transfer membrane using the Mini Protein Tetra Cell at 100 volts for 1 hr at 4ºC and blocked overnight in Intercept blocking buffer at 4ºC (LiCor). Blots were incubated with primary antibodies (1/10,000 dilution; mouse monoclonal to MSTN, ab201954, 43 kDa, AbCam; rabbit polyclonal to SCD1, ARP32797_t100, 41 kDa, Aviva Systems Biology, San Diego, CA; rabbit monoclonal to troponin-T for normalization, JLT12, 29 kDa, Developmental Studies Hybridoma Bank, Iowa City, IA) overnight, washed and then incubated with secondary antibodies (IRDye 680 RD goat anti-mouse for MSTN and IRDye 800CW goat anti-rabbit for SCD1 and TNT; 1/10,000 dilution, LiCor) for 1 h. Blots were imaged using FC Odyssey (LiCor) and analyzed using Empiria Studio software to quantify muscle protein levels.
Statistical Analyses
Data were analyzed as a completely randomized design using the mixed procedure of SAS. The model for growth, carcass traits, gene expression, shear force and protein levels included sire breed (SU, TX, SD). The model for carcass composition and DXA carcass fat prediction included sire breed, primal cut (shoulder, rack, loin, leg) and two-way interaction. The model for fatty acid composition included sire breed, muscle (adductor, gluteus medius, longissimus, semimembranosus, semitendinosus) and two-way interaction. Least square means were generated and separated using the protected least significant difference test.
Results
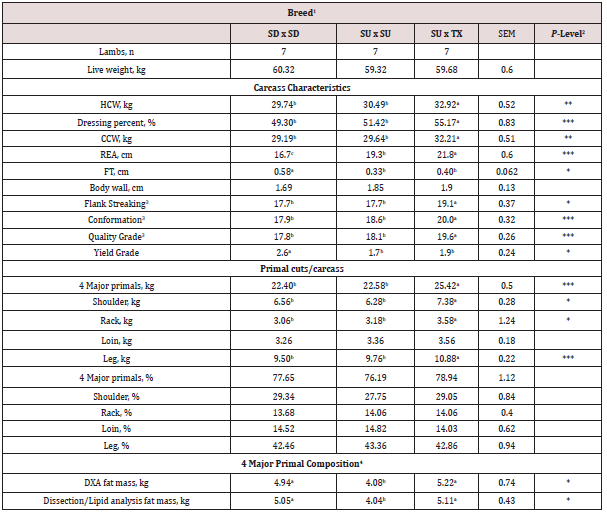
Birth weight of the lambs did not differ (P = 0.070) by breed type (Table 1). Adjusted weaning weight and average daily gain was greater (P < 0.001) for SD and SU than TX lambs. Final live weight at slaughter did not differ (P = 0.50) between the breeds; however, hot carcass weight was greater (P < 0.001) for TX compared to SD or SU (Table 2). This was due to a greater (P < 0.0004) dressing percentage for the TX (55.2%) compared to SD or SU (50.4%). Chilled carcass weight was greater (P < 0.0011) for TX than SD or SU. Ribeye area was greatest (P < 0.0001) for TX and lowest for SD. Fat thickness and yield grade number were greater (P = 0.028) for SD than SU or TX. Flank streaking, conformation and quality grade scores were greater (P < 0.01) for TX than SU or SD. Texel-sired lambs had heavier (P = 0.0007) weight of all four major primals, shoulder, rack and leg compared to SU or SD. The weight of the loin was not altered (P =0.47) by sire breed. On a percentage of carcass weight, the primals did not differ (P > 0.20) between the breeds. The four major primals (shoulder, rack, loin, and leg) represented over 77% of carcass weight. The fat mass of the four major primals as predicted by equations developed for DXA or physical dissection and total lipid analyses both found that SD and TX carcasses had greater (P < 0.05) fat mass compared to SU.
1Breed: SD = Southdown, SU = Suffolk, and TX = Texel.
2P-Level: * = P < 0.05, ** = P < 0.01, and *** = P < 0.001.
abMeans in the same row with uncommon superscripts differ (P < 0.05).
1Breed: SD = Southdown, SU = Suffolk, and TX = Texel.
2P-Level: * = P < 0.05, ** = P < 0.01, and *** = P < 0.001.
3Flank streaking, conformation and quality grade code: 16 = Good+, 17 = Choice-, 18 = Choice°, 19 = Choice+, 20 = Prime-, 21 = Prime°.
4Total fat mass in te four major primals on the carcass was predicted based on DXA scans or physical dissection and lipid analyses and equations developed in Justice et al. (9).
abcMeans with uncommon superscripts in the same row differ (P < 0.05) by breed.
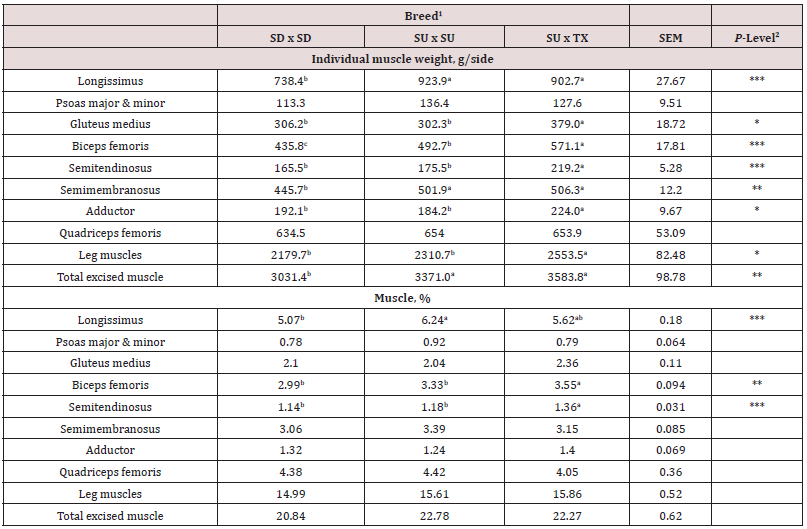
Weights of the major muscles in the lamb carcass are shown in Table 3. Carcasses from lambs sired by TX and SU had greater longissimus muscle (P < 0.001) and semimembranosus muscle (P < 0.05) weights compared to SD. Gluteus, semitendinosus, biceps femoris and adductor muscles were heavier (P < 0.05) for TX than SD or SU. Weights of the PM and QF did not differ (P > 0.05) by breed. Total muscle weight in the leg was greater (P < 0.05) for TX than SD or SU. Total excised muscle was greater (P < 0.01) for TX and SU compared to SD. When calculated on a percentage basis of side weight, most muscles (PM, GM, SM, AS, QF, leg and total excised) were similar (P > 0.05) in percentages. However, the BF and ST percentages were greater for TX than SD or SU. The percentage of LM per side was greater (P < 0.0001) for SU than for SD with TX being intermediate.
1Breed type: SD = Southdown, SU = Suffolk, and TX = Texel.
2P-Level: * = P < 0.05, ** = P < 0.01, and *** = P < 0.001.
Composition (lean, fat and bone) of each primal is shown by breed in Table 4. There were no interactions (P > 0.05) between breed and primal for percentage of fat, lean or bone in the primal cuts. These results indicate that compositional differences by breed were similar across primals. For fat percentage, SD had higher (P < 0.001) fat percent in all primals compared to SU with TX being intermediate. The total lean percentage was greater (P < 0.001) for SU and TX compared to SD. For bone percentage, TX had lower (P < 0.01) percent than SD and SU. For the primals, the percentage of fat was greatest (P < 0.001) in loin and rack and lowest in the leg. Total lean percentage was greatest (P < 0.001) in leg and lowest in the rack. Bone percentage was highest (P < 0.0001) for rack and lowest for loin. Total moisture and lipid content of eight individual muscles are shown in Table 5. Moisture content of the quadriceps femoris muscle was the highest (P < 0.05) and lowest (P < 0.05) for the longissimus muscle. Total lipid content was greater (P < 0.05) for longissimus and semitendinosus muscles compared to all others. Semimembranosus muscle had the lowest (P < 0.05) total lipid content. There were no differences in total moisture or lipid content by sire breeds. All total lipid values were below 3.7% and would be considered lean in this study. Long chain fatty acid composition of five muscles (AD, GM, LM, SM, ST) by breed (SD, SU, TX) were examined. The interactions between muscle and breed were non-significant and main effects of breed (Table 5) and muscle (Table 6) are presented. Muscles from TX lambs had greater (P < 0.05) concentrations of biohydrogentation intermediates (trans-9, -10, and -11 octadecenoic acid, conjugated linoleic acid cis-9 trans-11 isomer) and lower (P < 0.001) percentages of stearic (C18:0) acid and total saturated fatty acids (SFA). Muscles from TX lambs had higher (P < 0.01) concentrations of linolenic (C18:3) acid, eicosapentaenoic (EPA) acid, and total polyunsaturated fatty acids (PUFA) n-3 compared to SU or SD. This lowered the ratio of n-6 to n-3 PUFA and elevated the ratio of PUFA to SFA and unsaturated fatty acids (USFA) to SFA for TX compared to other breeds. Muscles from SD had greater concentrations of pentadecyclic (C15:0) acid, palmitic (C16:0) acid, and total odd chain fatty acids (OCFA). In contrast, SD muscles had the lowest (P < 0.05) levels of linoleic (C18:2), docosapentaeonic (DPA) acid, PUFA n-6 and total PFA concentrations. Margaric (C17:0) acid concentration was lower (P < 0.001) for SU compared to TX and SD. Total fatty acid content did not differ (P > 0.05) by breed. There were many differences among the muscles examined in this study (Table 7). Saturated fatty acid percentage was greatest (P < 0.05) for longissimus and lowest (P < 0.05) for the semimembranosus muscle that corresponded with similar differences in palmitic and stearic acids. Monounsaturated fatty acid and oleic acid percentages were highest (P < 0.05) for semitendinosus and lowest (P < 0.05) for adductor muscles. Semimembranosus had the highest (P < 0.05) PUFA n-6, linoleic acid and arachidonic acid percentage. Semimembranosus and adductor muscles had the greatest (P < 0.05) percentage of PUFA n-3. The muscle with the lowest (P < 0.05) total fatty acids was the adductor and the longissimus had the highest (P < 0.05) fat content. The n-6 to n-3 PUFA ratio was lowest (P < 0.05) for semitendinosus muscle compared to all other muscles.
Table 4: Individual primal lean, fat and bone composition of market lambs by breed. The interaction between breed and primal was not significant.
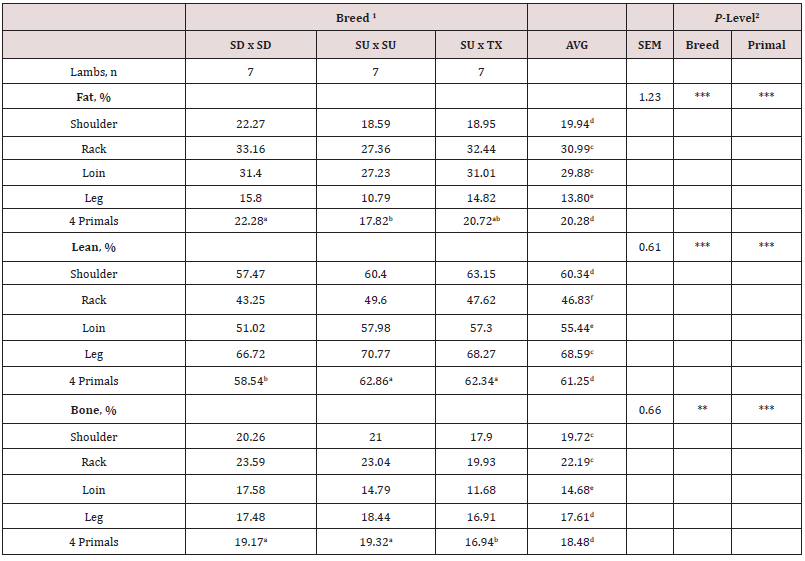
1Breed type: SD = Southdown, SU = Suffolk, and TX = Texel.
2P-Level: * = P < 0.05, ** = P < 0.01, and *** = P < 0.001.
abcMeans with uncommon superscripts in the same row differ (P < 0.05) by breed.
Table 5: Moisture and total lipid content of 8 major muscles in the lamb carcass. Moisture and total lipid content did not differ (P > 0.05) between breed types or two-way interaction. Data are presented averaged across breed type for each individual muscle.

1Muscle abbreviations: AD = adductor, BF = biceps femoris, GM = gluteus medius, LM = longissimus muscle, PM = psoas major and minor, QF = quadriceps femoris, SM = semimembranosus, and ST = semitendinosus.
2P-Level: * = P < 0.05, ** = P < 0.01, and *** = P < 0.001.
abcMeans with uncommon superscripts in the same row differ (P < 0.05) by breed.
Table 6: Long-chain fatty acid composition of muscles from the rack, loin and leg by breed type. The interaction between breed type and muscle was non-significant and the main effects of breed type are shown here.
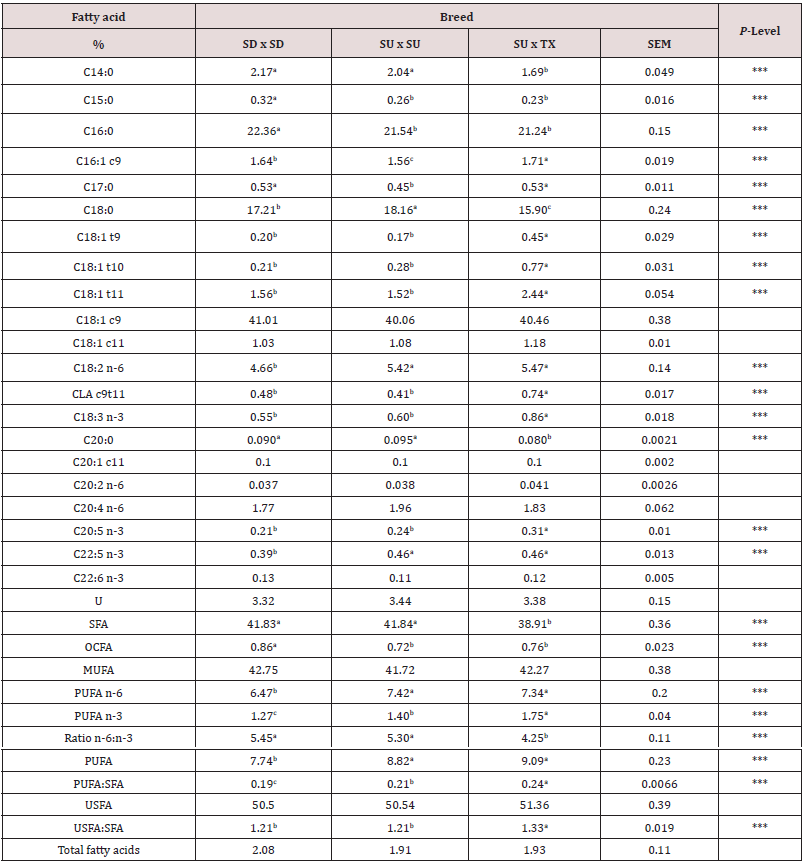
1Breed: SD = Southdown, SU = Suffolk, and TX = Texel.
2P-Level: * = P < 0.05, ** = P < 0.01, and *** = P < 0.001.
abcMeans with uncommon superscripts in the same row differ (P < 0.05) by breed.
Table 7: Fatty acid composition of five muscles from the rack, loin, and leg in three breed types. The interaction between breed type and muscle was non-significant and the main effects of muscle are shown here.
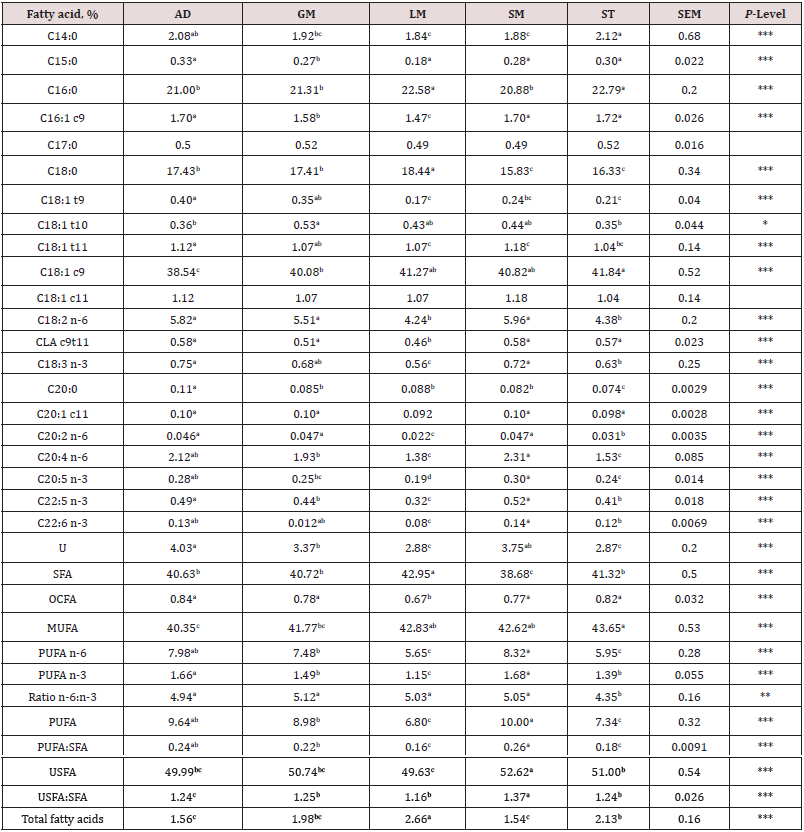
1Muscle: AD = adductor (leg), GM = gluteus medius (sirloin), LM = longissimus dorsi (rack and loin), SM = semimembranosus (leg), and ST = semitendinosus (leg).
2P-Level: * = P < 0.05, ** = P < 0.01, and *** = P < 0.001.
abcMeans with uncommon superscripts in the same row differ (P < 0.05) by breed.
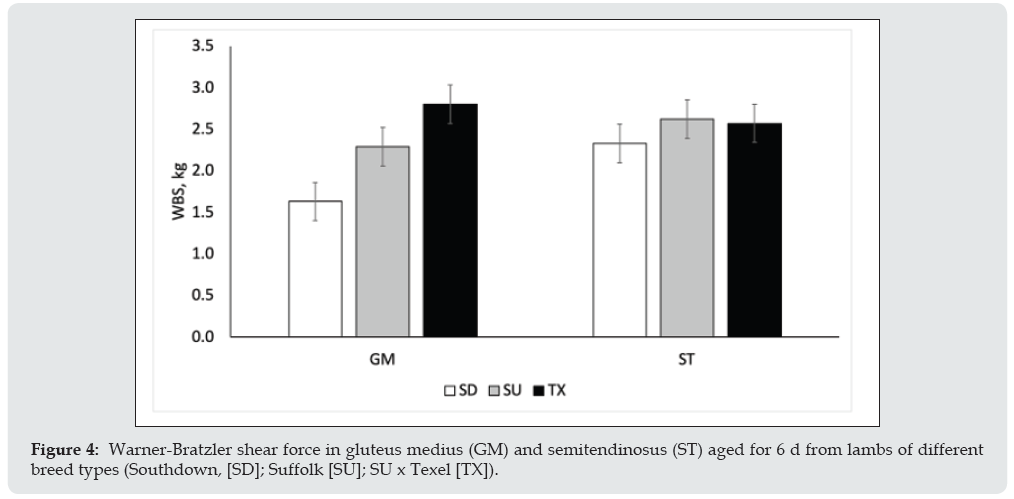
Relative gene expression in longissimus muscle for key genes involved in lipogenesis and myogenesis is shown in Figure 1. Myostatin mRNA expression did not differ (P = 0.38) between breed types. Transforming growth factor beta 1 receptor (TGFB1R) and fatty acid synthase (FASN) were up-regulated (P < 0.01) for SD compared to SU. Mothers against decapentaplegic homolog 4 (SMAD4), mechanistic target of rapamycin kinase (mTOR), and paired box 7 (PAX7) mRNA expression were up-regulated (P < 0.01) in SD and TX relative to SU. The mitogen activated protein kinase (TAK1) was up-regulated (P < 0.05) for TX compared to SU. Acetyl-CoA carboxylase (ACC) mRNA expression did not differ by breed type. Stearoyl-CoA desaturase 1 (SCD1) mRNA expression was up-regulated (P < 0.001) in TX and SD relative to SU. Protein levels of myostatin and stearoyl-CoA were evaluated by western blotting (Figure 2). There were no differences in the protein levels by sire breed. Warner-Bratzler shear force (WBSF) in the longissimus and semimembranosus muscles by postmortem aging time is shown in Figure 3. In the longissimus, WBSF values were greater (P < 0.05) for SU and TX at d 4 compared to SD; however, by d 6 of aging, only the TX had greater (P < 0.05) WBSF values than SU and SD. For the semimembranosus, there were no breed differences at d 4 or d 6 of postmortem aging. At d 6 of postmortem aging, the gluteus muscles of the TX were higher (P < 0.05) than SU, which was higher (P < 0.05) than SD (Figure 4).
Figure 1: Relative gene expression of key genes involved in lipogenesis (ACC, FASN, SCD1) and myogenesis (MSTN, TGFB1R, SMAD, MTOR, PAX7, TAK1) of longissimus muscle by breed type (Southdown, [SD]; Suffolk [SU]; SU x Texel [TX]).
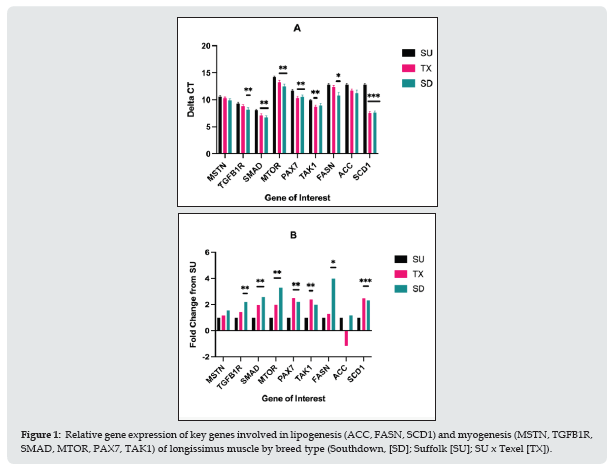
Figure 2: Protein levels for myostatin and stearoyl-CoA desaturase in longissimus muscle by breed type (Southdown, [SD]; Suffolk [SU]; SU x Texel [TX]). A: Western blot images for myostatin (MSTN; green, 43 kDa), stearoyl-CoA desaturase (SCD1; red, 43 kDa), and troponin-T (for normalization; red 29 kDa). B: Normalized signal intensity values for MSTN and SCD1 by breed type.
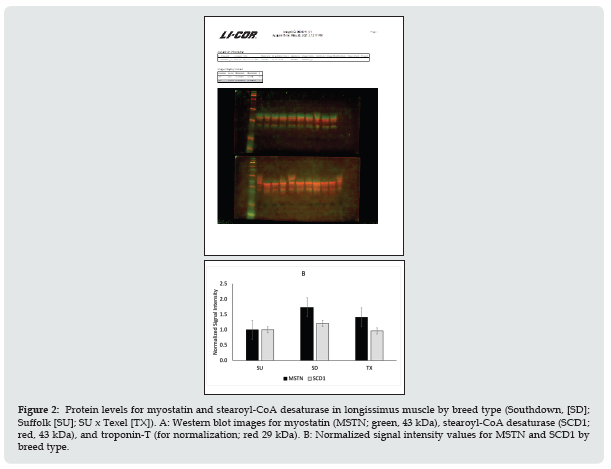
Figure 3: Warner-Bratzler shear force by postmortem age (d 4 or 6) and muscle (longissimus [LM] and semimembranosus [SM]) in lambs of different breed types (Southdown, [SD]; Suffolk [SU]; SU x Texel [TX]).
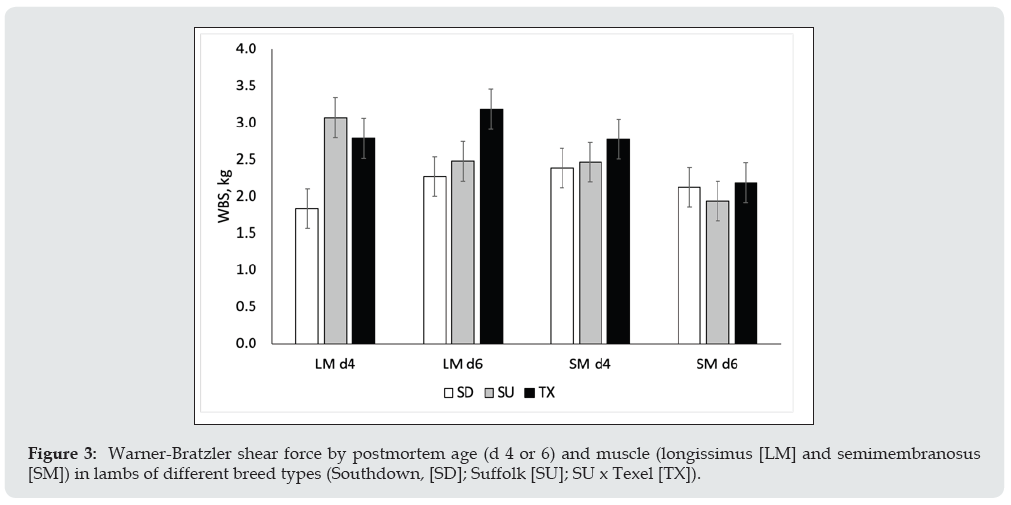
Figure 4: Warner-Bratzler shear force in gluteus medius (GM) and semitendinosus (ST) aged for 6 d from lambs of different breed types (Southdown, [SD]; Suffolk [SU]; SU x Texel [TX]).
Discussion
There is interest in using Texel rams as terminal sires to increase muscle mass in pasture finished lambs. Only a few studies in the US have examined how using Texel sires alters carcass composition, fat deposition and tenderness compared to traditional meat sheep breeds in pasture finished systems [9]. Our study found that growth performance of TX sired lambs was similar to SD and SU during post-weaning phase, but differences existed during pre-weaning phase. Adjusted weaning weight and gains to weaning were greater for SD and SU compared to TX. Others [14] have shown similar results with heaviest weaning weights for SU than all other breeds and TX having lighter weaning weights than Columbia or Composite-sired lambs. One of the main differences in carcass traits was the higher dressing percentage for TX sired lambs, which translated to greater carcass and primal cut (shoulder, rack and leg) weights. For producers who direct market grass-fed lamb, dressing percentage is very important in determining profitability as a higher dressing percentage and greater carcass yield dilutes the fixed rate slaughter and processing cost that most packing plants now utilize for sheep [15]. In an evaluation of ten sire breeds, Shackelford and co-workers [9] found that Texel sired lambs had dressing percentage similar to Suffolk sired and lower than Dorper sired in concentrate finished lambs. Quality grade was higher for TX carcasses due to greater flank streaking and conformation scores. In contrast, yield grade number was higher for SD than SU or TX due to greater fat thickness measures when finished to the same live weight. Ribeye area and weight of four major carcass primals as well as shoulder, rack and leg primal weights were greater for TX than SD or SU. Individual muscle dissection found that muscles from the sirloin (gluteus medius) and leg (biceps femoris, semitendinosus, adductor) were greater for TX carcasses than SD or SU. Longissimus and semimembranosus muscle weights were greater for both SU and TX than SD. On a percentage basis, the biceps femoris and semitendinosus muscles were greater for TX than SD and SU, whereas longissimus percentage was greater for SU than SD. Notter and co-workers [16]. reported differences in carcass shape in Texel sired lambs that were related to carcass yield and value. Carcass composition (lean, fat and bone) was altered by sire breed. Using the TX sire reduced bone and increased lean percentage in all 4 primal cuts compared to SD. Others have reported that carrier Texel lambs had higher carcass lean meat yield dur to greater density in the loin region as measured by computed tomography [17].
Gene expression was altered in TX and SD longissimus muscle compared to SU. However, myostatin mRNA expression and protein levels did not differ for TX compared to SU or SD. Texel sheep have increased muscularity due to a single nucleotide polymorphism (SNP; c. *1232 G > A) in the myostatin (MSTN) gene [1,2]. This SNP in MSTN creates a binding site for the seed sequence of specific miRNAs that inhibit translation and reduce myostatin protein levels [1]. Myostatin is a negative regulator of muscle growth and reductions in myostatin protein level leads to increases in muscle mass. In this study, the samples were obtained after finishing the lambs to 59 kg and at this stage of growth muscle hypertrophy may have been lower as the animals reached market weight. The lack of change in MSTN may be related to the time point when samples were collected. The increased muscle mass in Texel sheep is related to an increase in muscle fiber number which occurs during fetal development [18]. Expression of other genes involved in muscle growth (PAX7, TGFBR1, MTOR, TAK1, and SMAD) was up-regulated in TX compared to SD or SU. Others have shown that myostatin inhibition is associated with increased expression of PAX7, MTOR, SMAD and TGFBR1 in vitro [17,19]. Loss of myostatin increases PAX7 expression which stimulates satellite cell self-renewal and postnatal skeletal muscle hypertrophy [17]. More research is needed to examine how muscle growth is altered during early postnatal growth when phenotypic differences between the breeds start to develop.
Longissimus muscle from TX and SD also had up-regulation of key lipogenic genes involved in de novo fatty acid synthesis (FASN) and desaturation (SCD1). Others have also observed up-regulation of desaturases (SCD5) in pigs with MSTN knock out [8] In Texel sheep, a SNP in SCD5 was identified that was associated with ribeye area [20] Examination of five muscles showed that many differences existed between breed types and muscles but these differences were consistent across muscles. Muscles from TX lambs had greater concentrations of biohydrogenation intermediates including trans-11 vaccenic and conjugated linoleic acid (CLA) and omega-3 PUFA. These changes corresponded to lower moega-6 to omega-3 ratio and higher PUFA to saturated fatty acid ratio. Muscles from SD lambs had greater concentrations of odd chain fatty acids and palmitic acid with reduced concentrations of omega-6 fatty acids. Overall total fatty acid content was lowest for the adductor muscle and highest for longissimus muscle. Few studies have examined changes in fatty acid composition in Texel lambs. Similarly, linolenic acid was present in higher concentrations in muscle of Texel x Santa Ines cross lambs compared to Pantaneiro or Santa Ines x Pantaneiro crosses [21].
Texel sired lambs had longissimus and gluteus muscles that were tougher than the other breeds even after aging for 6 d. Tenderness of the leg muscles were not different by breed. All shear force values were below 3.36 kg indicating that even though differences were observed between the breeds that they would be considered very tender. Threshold levels for shear force of less than 3.36 kg in beef [22] and less than 3-4 kg in lamb [23,24] are associated with very tender ratings by consumers. Others [25] found that Texel-sired lambs produced longissimus muscle that when aged for 6 d had similar shear force values to SU, Columbia and Composite sired lambs. In contrast, Shackelford et al. [9] reported lower slice shear force values for TX sired compared to SU sired in longissimus samples after aging for 7 d. Lambe and co-workers [26] indicated that any differences in tenderness due to greater muscling in TX sired lambs could be overcome by postmortem aging for more than 7 d. In another study, Lambe and co-workers [27] reported no change in eating quality (appearance, flavor or texture attributes) in carrier and non-carrier TX lambs. The use of Texel as a terminal sire produced lambs with higher dressing percentage and superior carcass quality compared to traditional breeds (Suffolk and Southdown) in pasture-finishing systems. Texel-sired lambs had greater concentrations of omega-3 PUFA and CLA in the muscle, which are considered beneficial for human health. Shear force values were higher in longissimus and gluteus muscles of TX lambs, but values were below threshold levels and would be considered acceptable by consumers.
References
- Clop A, Marcq F, Takeda H, Pirottin D, Tordoir X, et al. (2006) A mutation creating a potential illegitimate microRNA target site in the myostatin gene affects muscularity in sheep. Nature Genetics 38(7): 813-818.
- Tellam RL, Cockett NE, Vuocolo T, Bidwell CA (2012) Genes Contributing to Genetic Variation of Muscling in Sheep. Frontiers in Genetics 3: 164.
- McPherron AC, Lee SJ (1997) Double muscling in cattle due to mutations in the myostatin gene. Proceedings of the National Academy of Sciences – PNAS 94(23): 12457-12461.
- McFarlane C, Hennebry A, Thomas M, Plummer E, Ling N, et al. (2008) Myostatin signals through Pax7 to regulate satellite cell self-renewal. Experimental Cell Research 314(2): 317-329.
- Bünger L, Navajas EA, Stevenson L, Lambe NR, Maltin CA, et al. (2009) Muscle fibre characteristics of two contrasting sheep breeds: Scottish Blackface and Texel. Meat Science 81(2): 372-381.
- Kärst S, Strucken EM, Schmitt AO, Alexandra Weyrich A, De Villena FPM, et al. (2013) Effect of the myostatin locus on muscle mass and intramuscular fat content in a cross between mouse lines selected for hyper muscularity. BMC Genomics 14: 16.
- Li N, Yang Q, Walker RG, Thompson TB, Du M, et al. (2016) Myostatin Attenuation in Vivo Reduces Adiposity, but Activates Adipogenesis. Endocrinology (Philadelphia) 157(1): 282-291.
- Ren H, Xiao W, Qin X, Cai G, Chen H, et al. (2020) Myostatin regulates fatty acid desaturation and fat deposition through MEF2C/miR222/SCD5 cascade in pigs. Communications Biology 3(1): 612.
- Shackelford SD, Leymaster KA, Wheeler TL, Koohmaraie M (2012) Effects of breed of sire on carcass composition and sensory traits of lamb. J. Anim. Sci 90(11): 4131-4139.
- Justice SM, Jesch ED, Duckett SK (2022) Case Report: Validation of Dual-Energy X-Ray Absorptiometry for Rapid Prediction of Fat Content in Lean Lamb Carcasses and Primals. Concepts in Dairy and Veterinary Sciences (in review).
- Volpi-Lagreca G, Duckett SK (2017) Supplementation of glycerol or fructose via drinking water to grazing lambs on tissue glycogen level and lipogenesis. J. Anim. Sci 95(6): 2558-2575.
- Park PW, Goins RE (1994) In Situ Preparation of Fatty Acid Methyl Esters for Analysis of Fatty Acid Composition in Foods. J Food Sci 59: 1262-1266.
- Xie F, Xiao P, Chen D, Xu L, Zhang B (2012) miRDeepFinder: a miRNA analysis tool for deep sequencing of plant small RNAs. Plant Mol Biol 80(1): 75-84.
- Leeds TD, Notter DR, Leymaster KA, Mousel MR, Lewis GS (2012) Evaluation of Columbia, USMARC-Composite, Suffolk and Texel rams as terminal sires in an extensive rangeland production system: I. ewe productivity and crossbred lamb survival and preweaning growth. J. Anim. Sci 90(2): 2931-2940.
- Muir PW, Thomson BC (2008) A review of dressing out percentage in New Zealand livestock, USA.
- Notter DR, Mousel MR, Leeds TD, Zerby HN, Moeller SJ, Lewis GS, et al. (2014) Evaluation of Columbia, US Meat Animal Research Center Composite, Suffolk and Texel rams as terminal sires in an extensive rangeland production system: VI. Measurements of live-lamb and carcass shape and their relationship to carcass yield and value. J. Anim. Sci 92(5): 1980-1994.
- Macfarlane JM, Lambe NR, Bishop SC, Matika O, Rius-Vilarrasa E, McLean KA, et al. (2009) Effects pf the Texel muscling quantitative trait locus on carcass traits in crossbred lambs. Animal 3(2): 189-199.
- Ren H, Li L, Su H, Xu L, Wei C, Zhang L, et al. (2011) Histological and transcriptome-wide level characteristics of fetal myofiber hyperplasia during the second half of gestation in Texel and Ujumqin sheep. BMC genomics 12(1): 411.
- Wei C, Ren H, Xu L, Li L, Liu R, Zhang L, et al. (2015) Signals of Ezh2, Src, and Skt involve in Myostatin-Pax7 pathways regulating the myogenic fate determination during the sheep myoblast proliferation and differentiation. PLOS One 10(3): e0120956.
- Armstrong E, Ciappesoni G, Iriate W, DaSilva C, Macedo G, Navajas EA, et al. (2018) Novel genetic polymorphisms associated with carcass traits in grazing Texel. Meat Sci 145: 202-208.
- Vargas Junior FM, Martins CF, Feijó GLD, Teixeira A, Leonardo AP, Ricardo HdA, et al. (2019) Evaluation of genotype on fatty acid profile and sensory of meat of indigenous Pantaneiro sheep and Texel or Santa Inês crossbred finished on feedlot. Small ruminant research 173: 17-22.
- Destefanis G, Brugiapaglia A, Barge MT, Dal Molin E (2008) Relationship between beef consumer tenderness perception and Warner–Bratzler shear force. Meat Sci 78(3): 153-156.
- Safari E, Channon HA, Hopkins DL, Hall DG, van de Ven R (2002) A national audit of retail lamb loin quality in Australia. Meat Sci 61: 267-273.
- Safari E, Fogarty NM, Ferrier GR, Hopkins LD, Gilmour A (2001) Diverse lamb genotypes. 3. Eating quality and the relationship between its objective measurement and sensory assessment. Meat Sci 57(2): 153-159.
- Mousel MR, Notter DR, Leeds TD, Zerby HN, Moeller SJ, Taylor JB, et al. (2014) Evaluation of Columbia, USMARC-Composite, Suffolk, and Texel rams as terminal sires in an extensive rangeland production system: VIII. Quality measures of lamb longissimus dorsi. J. Anim. Sci 92(7):2861-2868.
- Lambe NR, Haresign W, Macfarlane J, Richardson RI, Matika O, Bünger L (2010) The effect of conditioning period on loin muscle tenderness in crossbred lambs with or without the Texel muscling QTL (TM-QTL). Meat science 85(4): 715-720.
- Lambe NR, Macfarlane JM, Richardson RI, Matika O, Haresign W, Bünger L (2010) The effect of the Texel muscling QTL (TM-QTL) on meat quality traits in crossbred lambs. Meat science 85(4): 684-690.

Top Editors
-

Mark E Smith
Bio chemistry
University of Texas Medical Branch, USA -

Lawrence A Presley
Department of Criminal Justice
Liberty University, USA -

Thomas W Miller
Department of Psychiatry
University of Kentucky, USA -

Gjumrakch Aliev
Department of Medicine
Gally International Biomedical Research & Consulting LLC, USA -

Christopher Bryant
Department of Urbanisation and Agricultural
Montreal university, USA -

Robert William Frare
Oral & Maxillofacial Pathology
New York University, USA -

Rudolph Modesto Navari
Gastroenterology and Hepatology
University of Alabama, UK -

Andrew Hague
Department of Medicine
Universities of Bradford, UK -

George Gregory Buttigieg
Maltese College of Obstetrics and Gynaecology, Europe -

Chen-Hsiung Yeh
Oncology
Circulogene Theranostics, England -
.png)
Emilio Bucio-Carrillo
Radiation Chemistry
National University of Mexico, USA -
.jpg)
Casey J Grenier
Analytical Chemistry
Wentworth Institute of Technology, USA -
Hany Atalah
Minimally Invasive Surgery
Mercer University school of Medicine, USA -

Abu-Hussein Muhamad
Pediatric Dentistry
University of Athens , Greece

The annual scholar awards from Lupine Publishers honor a selected number Read More...


