Lupine Publishers Group
Lupine Publishers
Menu
ISSN: 2637-4749
Research Article(ISSN: 2637-4749) 
Case Report: Validation of Dual-Energy X-Ray Absorptiometry for Rapid Prediction of Fat Content in Lean Lamb Carcasses and Primals Volume 4 - Issue 5
Susan K Duckett1*, S Maggie Justice2 and Elliot D Jesch2
- 1Department of Animal and Veterinary Sciences, Clemson University, US State
- 2Department of Food, Nutrition, and Packaging Sciences, Clemson University, US State
Received: January 18, 2022; Published: January 27, 2022
Corresponding author: Susan K Duckett, Department of Animal and Veterinary Sciences, Clemson University, Clemson, SC, US State
DOI: 10.32474/CDVS.2022.04.000197
Abstract
Rapid assessment of carcass composition is an important factor for research programs aimed at altering animal growth and body composition. Two experiments were conducted to validate the use of Dual-energy X-ray Absorptiometry (DXA) for prediction of fat content in lamb carcasses or primals. In experiment 1, carcasses (n = 42) from Suffolk whether lambs were scanned hot (at the end of slaughter) or cold (after chilling for 24 h) to determine how carcass temperature influenced DXA fat estimates of carcass lipid percentage or mass. In experiment 2, carcasses (n = 21) from Suffolk, Southdown or Texel sired lambs were DXA scanned as whole carcasses, four primal cuts (shoulder, rack, loin, leg), or individual primal cut to determine which primal cut best predicted fat content of carcass. Both hot and cold carcass mass estimates from the DXA had high agreement (r2 = 0.98 and r2 = 0.97) compared to HCW or CCW, respectively. On a weight basis, total lipid mass estimated from DXA scans on the cold carcass had the best agreement (r2 = 0.75) with the total lipid mass of carcass.
Traditional carcass characteristics were not helpful in developing equations to predict carcass composition in lean lamb carcasses. Fat percentage estimated from DXA scan of the shoulder primal cut best predicted (r2 = 0.84) carcass major primal total lipid percentage. Total lipid percent or mass as obtained through dissection and chemical analyses of the leg primal best predicted total lipid percent (r2 = 0.79) or mass (r2 = 0.78) of the major primals in the carcass. Use of technology like the DXA can help to minimize the amount of time and labor involved in predicting carcass composition, which allows researchers to expand data collection on how breed or management alters carcass leanness.
Keywords:Lamb; DXA; Carcass Composition; Fat
Introduction
The ability to accurately measure carcass composition is imperative in order to help make fair assessments for species performance and overall meat quality. Methods that are used to assess carcass composition in the research field such as carcass dissection and chemical analyses are time-consuming and expensive [1]. In the industry, the existing methods for judging meat quality rely heavily on subjective visual appraisal of certain carcass characteristics, which can lead to inconsistencies and variation [2]. These traditional methods found in both research and industry can be expensive and time consuming for everyone involved. The classification of carcasses must become more harmonized at the same time as having the least impact on the quality and quantity of the product [3]. By helping to increase the accuracy in measuring carcass composition, we begin to see better results in performance testing for desired carcass traits for producers and aids in ensuring that proper payment is rewarded as well [4]. As technology becomes a bigger component in the meat industry, opportunities become more available to accurately measure carcass composition with faster, non-invasive methods. Different non-invasive techniques are starting to be utilized to accurately determine carcass composition [3]. These non-invasive techniques help to accurately measure carcass composition without compromising the carcass in any way. Dual-energy X-ray absorptiometry (DXA) is one of these noninvasive techniques. DXA was developed to determine bone density in humans but has since been adapted for use in other species [5]. DXA utilizes X-rays at two different energies to determine body composition [6]. The DXA is simple to use and does not require alteration to the carcass to be scanned. (Therefore, the objectives of this study were to determine:
a) Agreement between (DXA scans on hot or cold carcasses with actual carcass dissection and chemical analyses on a percentage or mass basis, and
b) Determine which primal cut best predicts carcass composition as measured by DXA or dissection and chemical analyses.
Materials and Methods
All animal experimental procedures were reviewed and approved by the Clemson University Institutional Animal Care and Use Committee (AUP 2014-081, AUP 2018-037).
DXA Scanner
Carcass or primal weight and fat percentages were measured Dual X-Ray Absorptiometry (DXA; Hologic Discovery QDR Series, Hologic, Inc., Bedford, MA, USA) densitometer.
Experiment: 1
Suffolk wether lambs (n = 42) were individually fed a pelleted concentrate diet (Southern States Hi-Energy Starter & Grower; 17.7% CP, 82% TDN and Southern States Hi-Energy Finisher; 12.8% CP and 83.9% TDN) from weaning (75 d of age) to market weight (54 kg or 180 d of age). Lambs were fasted overnight and slaughtered at Clemson University Meat Laboratory. Hot carcass weight (HCW) was obtained at the end of the slaughter process. Hot carcasses were immediately scanned using the DXA to assess carcass composition on the hot carcass (HOT). Carcasses were then chilled in a standard meat cooler (2.2°C) for 24 hours. At 24 h postmortem, the carcasses were weighed to obtain cold carcass weight (CCW) and DXA scanned to assess carcass composition on the cold carcass (COLD). After DXA cold scans were completed, carcasses were ribbed at the 12/13th rib and standard carcass traits measured (ribeye area, REA; fat thickness, FT; body wall thickness, BW; flank streaking, FS; conformation, CON; quality grade, QG; yield grade, YG; [ 7]) Each carcass was split into two sides. The right side of each carcass was separated into soft tissue and bone and weighed. Soft tissue was ground and mixed. Several samples of the ground soft tissue were taken for subsequent total lipid analyses.
Experiment: 2
Lambs (n = 21) of different sires (Southdown, Texel or Suffolk) were obtained from Clemson University Small Ruminant Facility at weaning (75 d of age). Lambs were finished on mixed annual pastures until they reached market weight (59 kg). Lambs were fasted overnight and transported (14.3 km) to the Clemson University Meat Lab. Hot carcass weight (HCW) was obtained for each carcass at the end of the slaughter process. Carcasses were cooled in a standard meat cooler (2.2°C) for 24 hours. At 24 h postmortem, the carcass was then split into two sides. The right side of the carcass was kept intact and scanned using the DXA. After scanning, the right intact side was ribbed at the 12/13th rib and standard carcass traits were measured (ribeye area, REA; fat thickness, FT; body wall thickness, BW; flank streaking, FS; conformation, CON; quality grade, QG; yield grade, YG; USDA, 1992). The left side was cut into four primal cuts: shoulder (IMPS 207), rack (IMPS 204), loin (IMPS 242) and leg (IMPS 233). Weight of each primal was recorded and scanned using the DXA. Then each primal was dissected into soft tissue and bone, and weights obtained. Soft tissue from each primal was ground and mixed. Ground soft tissue samples from each primal were used for moisture and total lipid content.
Total Lipid Analysis
Lean and fat trim from each carcass or primal was ground twice and mixed thoroughly. An aliquot of the ground mixture was taken to measure moisture content by weight loss after drying at 95°C for 24 hr. Another aliquot was taken chopped and mixed using a Blixer (Blixer 3 Series D, Robot Coupe Inc., Ridgeland, MS) and lyophilized (VirTis, SP Scientific, Warminster, PA). Total fat content was measured using Ankom XT-15 Extractor (Ankom Technology Macedon, NY) with hexane as the solvent and calculated on a wet basis [8].
Statistical Analyses
The data were analyzed using regression procedure of SAS version 9.4 (SAS Inst. Inc., Cary, NC) to compare total lipid to DXA carcass fat measures. Stepwise regression was used to develop prediction equations for total carcass or major primal lipid percentage or mass from values obtained from DXA, carcass traits or primal dissection, when significant in the model (P < 0.05).
Results
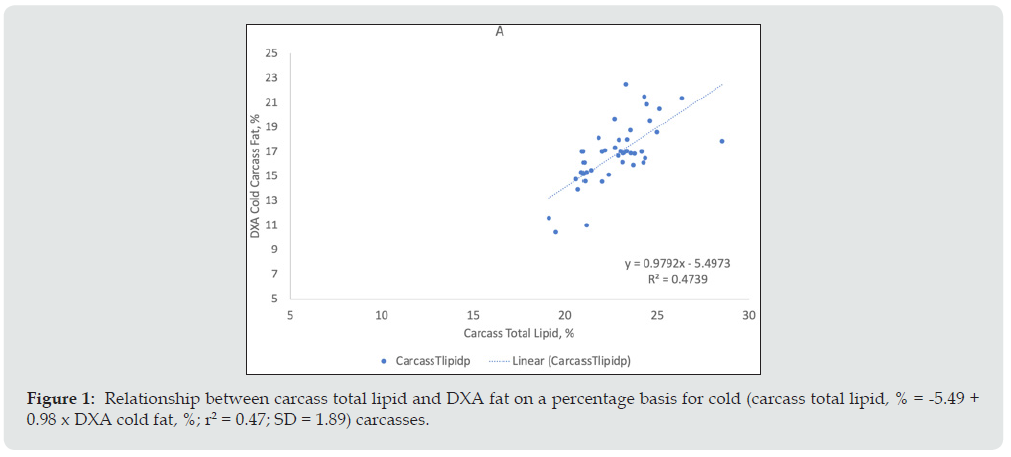
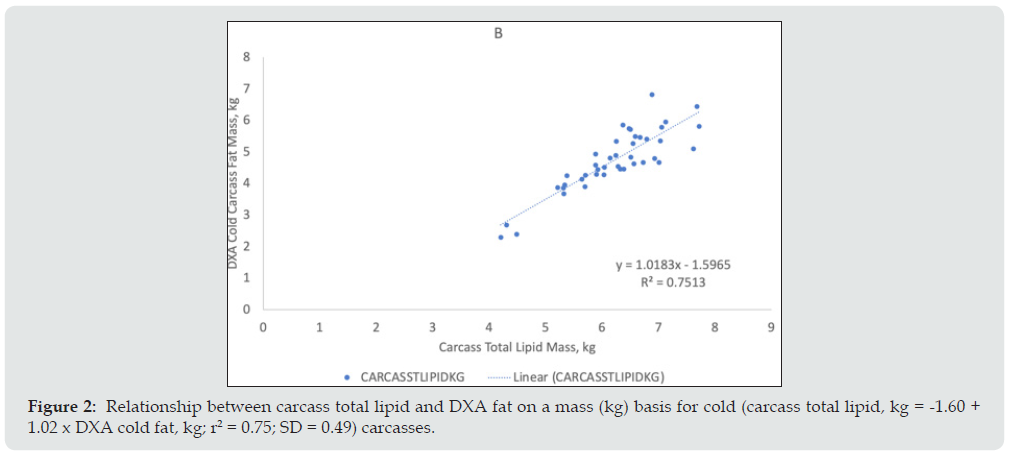
Carcass yield grade numbers ranged from 1.0 to 3.9 in both experiments indicating that the carcasses were lean without any yield grades of 4 or 5. Regression analyses were used to compare carcass weight and DXA mass on a hot or cold basis. Both hot and cold carcass mass estimates from the DXA had high agreement (r2 = 0.98 and r2 = 0.97) compared to HCW or CCW, respectively. Carcass fat percentage obtained from the DXA scans on the hot carcass had a lower agreement (r2 = 0.28) than the cold carcass (r2 = 0.47) with carcass total lipid percentage. Carcass fat mass estimated from DXA scans on hot carcass had a lower agreement (r2 = 0.63) than cold carcass (r2 = 0.75) with carcass total lipid mass. The DXA scans on the cold carcass had a higher agreement with carcass total lipid and all additional DXA scans were completed on the cold carcass (Figure 1). In addition, the regression equations were better for predicting carcass fat on a mass basis (kg) than on a percentage basis. For calculation of fat mass from DXA scans, the weight of the carcass obtained from the DXA scan was multiplied by estimated fat percentage from the DXA scan.
Figure 1: Relationship between carcass total lipid and DXA fat on a percentage basis for cold (carcass total lipid, % = -5.49 + 0.98 x DXA cold fat, %; r2 = 0.47; SD = 1.89) carcasses.
Stepwise regression was used to develop equations to estimate carcass total lipid on a percentage or mass basis using carcass characteristics and DXA scan values (Table 1). Stepwise regression identified DXA cold carcass fat mass (kg) for prediction of carcass total lipid percentage. This equation explained 53% of the variation (P < 0.0001) in carcass total lipid percent. For prediction of carcass total fat mass (kg), DXA cold carcass fat mass (kg) explained 75% of the variation in carcass total lipid mass. No carcass characteristics entered the models (P > 0.05) to improve carcass composition prediction in these lean carcasses (yield grade < 4.0). In experiment 2, we explored if one primal cut could be used to estimate total lipid percentage or mass of the 4 primal cuts of the whole carcass (Figure 2). This would allow researchers to utilize smaller portions of the carcass for DXA scanning or physical dissection and lipid analyses instead of the whole carcass or one side of the carcass. The four major primal cuts (shoulder, rack, loin and leg) represented 77.5% of cold carcass weight and over 90% of total carcass value.
Regression equations were developed to identify the best primal to use for predicting total lipid percentage or mass of the four major primals from the carcass. For the DXA scans, the equation with estimated fat percentage of the shoulder primal best predicted the total lipid percentage of major carcass primals (r2 = 0.84; Table 2). For the physical dissection and total lipid analyses, equations using the total lipid percentage (r2 = 0.79) or mass (r2 = 0.78) of the leg primal best predicted the total lipid percentage or mass of major carcass primals for the carcass. Lipid mass of the rack primal also had a high (r2 = 0.74) agreement with total lipid mass of major carcass. Stepwise regression was used to develop equations to better predict major primal total lipid by evaluating carcass characteristics with DXA scan values or physical dissection/total lipid analyses (Table 3). For DXA variables, the equation containing DXA fat mass from the major four primal cuts from one side of the carcass and conformation score best predicted (R2 = 0.84) the variation in total lipid percentage of the carcass major primals.
Table 1: Stepwise prediction equations for carcass total lipid on a percentage or mass (kg) basis from carcass traits and DXA scans (Expt. 1). No carcass traits entered the model (P > 0.05).

Table 2: Regression equations for predicting the total lipid percentage of the four major primals (shoulder, rack, loin, and leg) using individual primal total lipid percentage from DXA scans or physical dissection and total lipid (TL) analyses (Expt. 2).
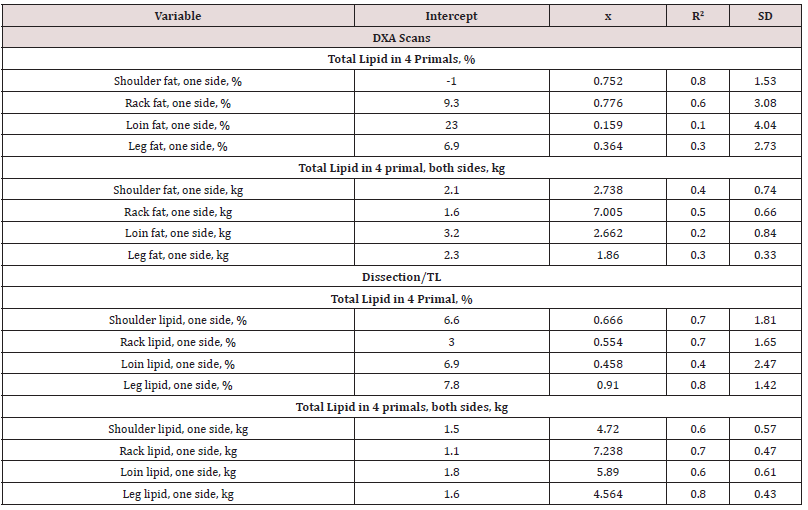
Table 3: Stepwise prediction equations for total lipid percentage or mass (kg) in carcass major primals (should, rack, loin, leg; both sides) using carcass traits and DXA scans or physical dissection and lipid analyses (TL; Expt. 2).
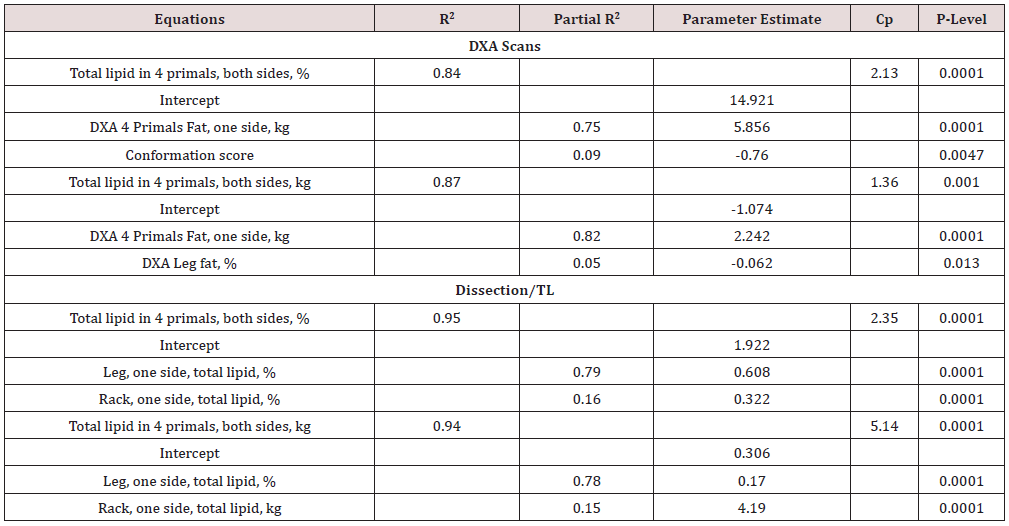
Figure 2: Relationship between carcass total lipid and DXA fat on a mass (kg) basis for cold (carcass total lipid, kg = -1.60 + 1.02 x DXA cold fat, kg; r2 = 0.75; SD = 0.49) carcasses.
On a mass basis, an equation containing DXA fat mass from the major four primal cuts from one side of the carcass and DXA leg fat percentage best predicted (R2 = 0.87) total lipid percentage of the carcass major primals. For the physical dissection and total lipid analyses procedures, an equation containing percentage of total lipid from the leg and rack primals best predicted (R2 = 0.95) carcass major primal total lipid percentage. On a mass basis, the equation using percent total lipid of the leg and total lipid mass of the rack best predicted (R2 = 0.94) carcass major primal total lipid mass. No carcass characteristics entered the model for predicting total lipid mass of carcass major primals. These results demonstrate that the physical dissection and total lipid analyses or DXA scanning of specific primal cuts can be used to estimate total lipid content of the carcass major primal cuts with high r2 values and accuracy (Cp values).
Discussion
Agreement between DXA and carcass total lipid showed that the scanning of the cold carcass was more accurate than the hot carcass. The prediction equations developed from the DXA cold carcass scans explained 75% of the variation in carcass lipid mass. Others have also shown that DXA can be used to predict carcass composition [3,4,9]. One of the earlier issues with using DXA to predict carcass composition was the amount of time the scans originally required. In some of the first studies, DXA scans took about 20 minutes per scan [1]. However, DXA technology is rapidly advancing. The DXA QDR series used in this study can complete a scan on a whole lamb carcass or primals in about 2.5 minutes and is non-invasive. Some of the more common issues observed when scanning carcasses include different DXA manufacturers, speed of the machine, carcass position, and carcass weight [9]. Even the simplest change in position on the DXA changes the reading. Humans are typically scanned in a supine position with their arms placed at their side [10]. Carcasses typically cannot stay in this position and therefore carcasses were laid on their right side facing out for this study. [11] found that DXA technology often accounts for the moisture content in human gastrointestinal tracts. Equations for the DXA can be modified to develop a better fit for carcass fat mass by working with the manufacturer.
Stepwise regression was used to examine other variables such as carcass characteristics could improve the prediction equation, but no carcass traits entered the models. Use of technology in predicting carcass composition is also helping to identify other issues in traditional grading methods [2]. The current yield grade equation for lamb relies solely on fat thickness at the 12/13th rib interface [ 7]. Several of the earliest carcass cutability studies showed that muscle weight in particular retail leg weight was more highly associated with the retail value of carcasses than other factors [12,13] reported that using a combination of carcass characteristics, chilled carcass weight, body wall thickness and kidney fat weight were more accurate for predicting lean meat yield. Other studies that used DXA technology also found that lean tissue content was more closely related to carcass weight than just fat depth alone [4,14] found that when using carcass characteristics in a stepwise analysis, fat depth was not even considered a significant variable in explaining variation in lean meat yield on differing carcasses. Studies utilizing different technology also found that adding carcass characteristics such as carcass weight and ribeye area helped to increase the accuracy of lamb vision system’s ability to predict lean meat yield when compared to using USDA yield graders [15]. This study evaluated carcass composition differences in lean lamb carcasses of similar breed type and finishing system to help rank carcass on carcass total lipid content. It appears from this work that the DXA can be used to speed up the process to identify lean carcasses without physically altering the carcass.
In other species, equations have been developed from dissection and lipid analyses of smaller carcass portions to predict carcass composition. This aids in reducing the labor and time needed to dissect an entire carcass or half carcass and reduces loss of product value. In beef cattle, the 9-10-11th rib section was shown to be a good predictor of overall carcass composition [16]. However, data are lacking for lamb carcass composition. For the DXA scans, the fat percentage of the shoulder from the DXA had the strongest relationship to carcass major primal lipid percentage. For physical dissection and total lipid analyses, the total lipid percentage or total lipid mass of the leg had the strongest relationship to carcass major primal lipid percent or mass. The ability to use smaller portions of the carcass for DXA scanning or dissection to identify lean carcasses is beneficial for research evaluating breed or management differences. The DXA can quickly and accurately examine the whole carcass or primal without altering the product. Use of technology like the DXA can help to minimize the amount of time and labor involved in predicting carcass composition, which allows researchers to expand data collection on how breed or management alters carcass leanness.
References
- Mercier J, Pomar C, Marcoux M, Goulet F, Thériault M, et al. (2006) The use of dual-energy X-ray absorptiometry to estimate the dissected composition of lamb carcasses. Meat Science 73(2): 249-257.
- Tan J (2004) Meat quality evaluation by computer vision. Journal of Food Engineering 61(1): 27-35.
- Scholz AM, Buenger L, Kongsro J, Baulain U, Mitchell AD (2015) Non-invasive methods for the determination of body and carcass composition in livestock: Dual-energy X-ray absorptiometry, computed tomography, magnetic resonance imaging and ultrasound: invited review. Animal 9(7): 1250-1264.
- Dunshea FR, Suster D, Eason PJ, Warner RD, Hopkins DL, et al. (2007) Accuracy of dual energy X-ray absorptiometry, weight, longissimus lumborum muscle depth and GR fat depth to predict half carcass composition in sheep. Australian Journal of Experimental Agriculture 47(10): 1165-1171.
- Mitchell AD, Conway JM, Scholz AM (1996) Incremental changes in total and regional body composition of growing pigs measured by dual-energy X-ray absorptiometry. Growth, Development, and Aging 60(2): 95-105.
- Laskey MA (1996) Dual-energy X-ray absorptiometry and body composition. Nutrition 12(1): 45-51.
- (1992) USDA United States Standards for Grades of Lamb, Yearling Mutton, and Mutton Carcasses.
- Volpi Lagreca G, Duckett SK (2017) Supplementation of glycerol or fructose via drinking water to grazing lambs on tissue glycogen level and lipogenesis. J Anim Sci 95(6): 2558-2575.
- Hunter TE, Suster D, Dunshea FR, Cummins LJ, Egan AR, et al. (2011) Dual energy X-ray absorptiometry (DXA) can be used to predict live animal and whole carcass composition of sheep. Small Ruminant Research 100(2): 143-152.
- (1996) Anon. QDR 4500 Fan Beam X-ray Densitometer. User’s Guide, Waltham, USA.
- Suster D, Leury BJ, Ostrowska E, Butler KL, Kerton DJ, et al. (2003) Accuracy of dual energy X-ray absorptiometry (DXA), weight and P2 back fat to predict whole body and carcass composition in pigs within and across experiments. Livestock Production 84(3): 231-242.
- Carpenter ZL, King GT, Orts FA, Cunningham NL (1964) Factors influencing retail carcass value of lambs. J Anim Sci 23(3): 741-745.
- Oliver WM, Carpenter ZL, King GT, Shelton M (1968) Predicting cutability of lamb carcasses from carcass weights and measures. J Anim Sci 27(5): 1254-1260.
- Juarez M, Lopez-Campos O, Roberts JC, Prieto N, Larsen IL et al. (2018) Exploration of methods for lamb carcass yield estimation in Canada. Can. J Anim Sci 98(1): 760-768.
- Brady AS, Belk KE, LeValley SB, Dalsted NL, Scanga JA, et al. (2003) An evaluation of the lamb vision system as a predictor of lamb carcass red meat yield percentage. J Anim Sci 81(6): 1488-1498.
- Lunt DK, Smith GC, McKeith FK, Savell JW, Riewe ME, et al. (1985) Techniques for predicting beef carcass composition. J Anim Sci 60(5):1201-1207.

Top Editors
-

Mark E Smith
Bio chemistry
University of Texas Medical Branch, USA -

Lawrence A Presley
Department of Criminal Justice
Liberty University, USA -

Thomas W Miller
Department of Psychiatry
University of Kentucky, USA -

Gjumrakch Aliev
Department of Medicine
Gally International Biomedical Research & Consulting LLC, USA -

Christopher Bryant
Department of Urbanisation and Agricultural
Montreal university, USA -

Robert William Frare
Oral & Maxillofacial Pathology
New York University, USA -

Rudolph Modesto Navari
Gastroenterology and Hepatology
University of Alabama, UK -

Andrew Hague
Department of Medicine
Universities of Bradford, UK -

George Gregory Buttigieg
Maltese College of Obstetrics and Gynaecology, Europe -

Chen-Hsiung Yeh
Oncology
Circulogene Theranostics, England -
.png)
Emilio Bucio-Carrillo
Radiation Chemistry
National University of Mexico, USA -
.jpg)
Casey J Grenier
Analytical Chemistry
Wentworth Institute of Technology, USA -
Hany Atalah
Minimally Invasive Surgery
Mercer University school of Medicine, USA -

Abu-Hussein Muhamad
Pediatric Dentistry
University of Athens , Greece

The annual scholar awards from Lupine Publishers honor a selected number Read More...


