


Lupine Publishers Group
Lupine Publishers
ISSN: 2643-6744
Research ArticleOpen Access
Stock Market Trend Prediction Model Using Data Mining Techniques Volume 1 - Issue 5
Received: November 26, 2019; Published: December 12, 2019
*Corresponding author: Oyelade Iyinoluwa, Department of Computer Science, Federal University of Technology, Akure, Nigeria
DOI: 10.32474/CTCSA.2019.01.000122
Abstract
Stock market prediction is essential and of great interest because successful prediction of stock prices may promise smart benefits. These tasks are highly complicated and very difficult. Many researchers have made valiant attempts in data mining to devise an efficient system for stock market movement analysis. This research has developed an efficient approach to stock market trend prediction by employing Frequent Pattern growth and Fuzzy C-means clustering algorithms. This research has been encouraged by the need of predicting the stock market to facilitate investors about when to buy, sell or hold a stock in order to make profit. Firstly, the original stock market data were converted into interpreted historical (financial) data via technical indicators. Based on these technical indicators, datasets that are required for analysis was created. Subsequently, Frequent Pattern Growth algorithm was used to generate frequent patterns. Based on these frequent patterns, Fuzzy C-means clustering technique was used to formulate the prediction model. Finally, a classification technique, K-Nearest Neighbor classifier was employed to predict the stock market trends. The results from the stock market trend prediction were validated through Hit ratio evaluation metric to estimate the prediction accuracy. Comparative analysis was carried out for the proposed model and a neural network model was used to benchmark the proposed model. The obtained results showed that proposed model produced better results than the neural network model in terms of accuracy. This paper has provided a novel approach which combines FP-Growth, Fuzzy C-means and K-Nearest Neighbor algorithms for stock market trend prediction.
Keywords: Fuzzy C-means Algorithm; FP-Growth Algorithm; K-Nearest Neighbor Algorithm; Stock Market Prediction
Introduction
Stock market prediction is one of the most trending topics in finance and business. However, the unpredictable nature of the stock market creates a problem for investors to do profitable investments. Several research efforts have been carried out to predict the market in order to make profit using different techniques ranging from statistical analysis, technical analysis and fundamental analysis among others, with different results. These techniques however cannot provide deeper analysis that is required and therefore not effective in predicting stock market trends. However, finding patterns in stock market can provide insight into market behavior, buying or selling habits and co-movement of stock shares. This research aims at creating an approach to discover inference knowledge from the relationships among stock index indicators to provide useful information about market trends for investment decisions Ehsan et al. [1] defined stock market as a private or public market for the trading of company stock and derivatives of company stock at an agreed price; these are securities listed on a stock exchange as well as those only traded privately. Stock market is very volatile in nature and prices of stocks change almost instantly. It strongly depends on demand and supply. The prices will be high when the demand is high, and the prices will be low when the demand is low [2]. Uncertainty is the main characteristic of all stock markets, which is related to their future state. This feature is undesirable and unavoidable for the investor whenever stock market is selected as the investment tool. Predicting the stock market is the best option to reduce uncertainty. Stock market prediction includes uncovering market trends, planning investment, investment strategies, determining the perfect time to purchase the stocks and what stocks to purchase [1]. Many factors may influence the stock market including political events, general economic conditions and traders’ expectations [3]. Therefore, predicting price movement on stock data seems to be quite difficul Due to technological development in information technology and software abilities, gathering sufficient data on stock traded by the hour and even by the minute have become much easier. This is the reason why data mining techniques have attracted the attention of investors interested in predicting the trends of the stock market. According to Ravindranath [4], Data Mining is the process of selecting, exploring and modeling large quantities of data to unravel previously unknown patterns for the purpose of business and commercial advantage. It allows users to analyze data, categorize it, and summarize the relationships among data Ehsan et al. [1] defined data mining as the science and technology of exploring data in order to discover previously unknown patterns. Finding frequent patterns plays an essential role in mining associations, correlations, and many other interesting relationships among data. Moreover, it helps in data indexing, classification, clustering, and other data mining tasks as well. Frequent pattern mining is an important data mining task and a focused theme in data mining research. It was first introduced by Agrawal et al. [5] to find frequently purchased items by customers in a “market basket analysis”. It became more popular due to its high applicability in various data analysis fields such as DNA pattern recognition, web data mining, clinical data mining, software bug analysis and stock market analysis. Apriori and FP-Growth algorithms are two most frequent pattern mining algorithms in literature [6]. Apriori algorithm which was introduced by Agarwal and Srikant [7] adopts the apriori property and candidate generation process to generate association rules. FP-Growth is a tree-based approach introduced by Han et al. [8] which follows a two-step procedure; it scans the database once and generates the Frequent Pattern tree in the first step and then it discovers frequent patterns from the tree. Apriori and FP-growth algorithms generate huge number of frequent patterns which are not able to produce direct knowledge or inference. Fuzzy Logic can play an essential role in discovering inference knowledge from huge number of frequent patterns by using Fuzzy Inference. Fuzzy inference is the process of formulating the mapping from a given input to an output using fuzzy logic. This paper adopts the fuzzy c-means clustering approach for matching facts with frequent patterns which performs excellently in either exact or partial matching to generate inference knowledge. The inference knowledge generated helps investors to know when to buy, sell or hold a stock. Therefore, the main purpose of implementing the fuzzy inference approach for association rule mining on stock market data is to discover inference knowledge by analyzing the random data and to use the knowledge as a reference during decision making.
Related Works
Stock market prediction is considered to be a challenging task for both investors and researchers, due to its profitability and intricate complexity. The predictability of the market is an issue that has been much discussed by researchers and academics. Several researches have been done for predicting the price direction of a stock using different data mining techniques and have emerged with various results Sachin et al. [2] worked on an association rule mining model for finding the interesting patterns in stock market dataset. The objective was to predict if the stock prices of a specific company will be up or down by the next day. The work used apriori algorithm for generating frequent patterns from the stock data and rules were generated from the frequent patterns. However, the prediction was not accurate because the rules generated were too ambiguous. Krittithee and Pakorn [9] worked on association rule mining on stock index indicators. In their work, a performance study was done using association rule mining to model index indicators and trading volume and their effect on price change. The work only described the relationship between stock indexes and how they affect price change but did not go further to give conclusion on the state of the particular stock. Shubhangi and Nandgaonkar [10] proposed Using Association Rule Mining: Stock Market Event Prediction from Financial News. Their work considered only the closing price of stocks and it was used to calculate the stock index indicators and for defining the rule. Naive Bayes algorithm was used for training the technical index indicators and association rule mining was used for generating buy, sell or hold signals. However, the accuracy of the model was low because they only considered one field of the stock data among five which is closing price. However, relations among stock market data are not sufficient for predicting the trends in the market. This paper improves on the reviewed related works by modeling a fuzzy clustering mechanism for predicting the future price direction of a stock.
Methodology of the Proposed Model
The proposed model adopted frequent pattern growth algorithm to find frequent patterns among stock index indicators and also adopted Fuzzy C-means clustering approach to develop a prediction model using the frequent patterns dataset. Historical data of a Nigerian bank for three years were obtained online from a stock broking firm with the Nigerian Stock Exchange. The dataset represented in Table 1 contains fields such as such as open price, close price, high price, low price and volume for each trading day. Five technical indicators such as Relative Strength Index (RSI), Rate of Change (ROC), Moving Average Convergence Divergence (MACD), Stochastic Oscillator (SO) and On Balance Volume (OBV) were calculated from the historical dataset in. The parameters for the technical indicators are specified according to the standard default guidelines. The data points were converted into symbols, that is, numeric-to-symbolic conversion to reduce the large number of distinct values. These indicators are described below.
Moving average convergence divergence (MACD)
The MACD is the difference between these two moving averages plotted against a centerline. In this work, the most common moving average values are used in the calculation. These are the 26-day and 12-day exponential moving averages (EMA). The signal line used is zero.
Table 1: Sample of raw dataset.

Formula:
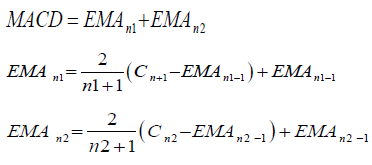
Where n1 is 12 days, n2 is 26 days, Cn1 is the closing price at day 12 and Cn2 is the closing price at day 26. The trading rules of the MACD to be used are: I. IF MACD is above the signal line then buy. II. IF MACD is below the signal then sell.
Relative strength index (RSI)
The Relative Strength Index (RSI) considers whether an asset is over bought or oversold. RSI is described in equation 3.4.
Formula:
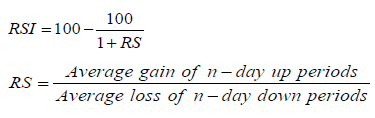
Where n is the number of days. The default number of days
used by analyst is 14 days which will be adopted in this work. The
trading rules to be used are:
i. IF RSI increases to above 70 (implies overbought) then
sell.
ii. IF RSI is between 30 and 70 (implies normal) then hold.
iii. IF RSI decreases to below 30 (implies oversold) then buy.
Rate of change (ROC)
ROC is a momentum oscillator that measures the percentage of change in price. It calculates the percentage difference between the closing price of the current day and the closing price of days.
Formula:
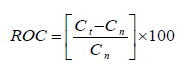
where n is the number of trading days which is 12 days, C t is
closing price of current day, Cn closing price of 12 days ago. The
trading rules to be used are:
i. IF ROC is negative then sell.
ii. IF ROC is positive then buy.
iii. IF ROC is zero then hold.
Stochastic oscillator (STO)
The Stochastic Oscillator gives an indication of the stock’s last closing price relative to the stock’s recent trading range [11]. The STO is plotted within a range of 0 to 100 and signals over-bought conditions above 80 and oversold conditions below 20 [12]. STO is described in the equation below.
Formula:
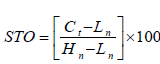
where n is the number of trading days which is 14 days, Ct is the
closing price of current day, Ln is the lowest price over 14 days and
Hn is highest price over 14 days. The trading rules of the stochastic
oscillator are summarized as follows.
i. IF STO increases above 80 (implies overbought) then sell.
ii. IF STO is between 20 – 80 (implies normal) then hold.
iii. IF STO is below 20 (implies oversold) then buy.
On-balance volume (OBV)
The On-Balance Volume indicator reflects movement in volume of stocks. The OBV is calculated by taking the total volume for the trading period and assigning it a positive or negative value depending on whether the price is up or down during the trading period. OBV is described in the equation below.
Formula:
If Today’s close is greater than Yesterday’s close, then:
OBV = Yesterday ' s OBV +Today ' s Volume
Else, if today’s close is less than yesterday’s close then:OBV = Yesterday ' s OBV −Today ' s Volume
Else, if today’s close is equal to yesterday’s close then:OBV = Yesterday ' s OBV
Conditions applied
Yesterday ' s OBV is yesterday’s volume. The trading rules of
the On-Balance Volume are summarized as follows:
i. IF OBV is upward then buy
ii. IF OBV is downward then sell
iii. IF OBV is the same then hold
The indicators for each trading day are calculated and a sample
is presented in Table 3 together with the trading volume for each
day. They are referred to as features and serves as the input dataset.
The indicators for each trading day are calculated and a sample is
presented in Table 2 together with the trading volume for each day.
They are referred to as features and serves as the input dataset.
Table 2: Sample of technical Indicator Dataset.

Table 3: The range of each Indicator.

Model Architecture
Figure 1: Stock Prediction Model Architecture using Data Mining Technique.

Figure 1 shows the architecture of the Stock Market Trend Prediction Model. The different components that make up the model work together to achieve the model objective. Data preprocessing is in two phases. First, the technical indicators are calculated from raw data retrieved from the internet. The technical indicator dataset formed the dataset required for mining. Secondly, data discretization reduces the large distinct values by dividing the data record into three ranges. Frequent pattern mining is performed on the preprocessed data to retrieve frequent patterns. The frequent pattern dataset is clustered using Fuzzy C-Means clustering algorithm to extract three cluster centers and K-Nearest Neighbor algorithm is used as the classification technique to classify new data points to the cluster centers in order to predict the trends of the new data points.
Data Preprocessing
Time series data is difficult to manipulate, but when they are treated as symbols (item units) instead of data points, interesting patterns can be discovered, and it becomes an easier task to mine them. Thus, it is suggested to convert the basic unit into symbols, i.e., numeric-to-symbolic conversion to reduce the large number of distinct values. The numeric-to-symbolic conversion transforms the available features (e.g. MACD, RSI, ROC, STO and OBV) of a financial instrument into a string of symbols. Each indicator is divided into three ranges (a, b, c) as shown in Table 3.
Frequent Pattern Mining
In order to mine the mapped dataset to discover frequently occurring features, frequent pattern mining has to be performed on preprocessed data. Under this process, frequent pattern growth algorithm reads the mapped dataset and generates frequent patterns as per predefined minimum threshold value and store in the frequent pattern base.
The step by step procedure for constructing a FP-tree is stated below.
Step 1: The mapped dataset is scanned once to determine the support count of each feature. Infrequent features are discarded, while the frequent features are sorted in decreasing support counts.
Step 2: Create the root of an FP-tree T and label it as null. For each trading day in the database, select the frequent items and sort them according to the order of the frequent item list.
Step 3: Let the sorted frequent item list be [p/p ] where p is the first element and P is the remaining list. Call insert _ tree [p/p ],T ).The function is performed as follows. If T has a child N such that N.itemname = p.item-name, then increment N’s count by 1, else create a new node N, with its count initialized to 1, its parent link linked to T and its node-link linked to the nodes with the same item-name via the node-link structure.
Step 4: If P is nonempty, call insert _ tree(P, N) recursively
After the FP-tree is constructed, frequent itemset are mined from it. Minimum support was experimented from 0.1 to 1. 0.1- 0.5 had a lot of uninteresting patterns. 0.6 to 1 had concise and interesting patterns but the numbers of patterns generated for each 0.6 to 1 minimum support were almost equal and did not much effect on the result. Therefore, 0.6 was selected as the minimum support for this paper.
Input: The transaction database represented by the constructed FP-tree and a minimum support of 0.6.
Output: The complete set of frequent patterns.
Method: call FP-growth (FP-tree, null)
Procedure FP-growth (Tree, α)
a) If tree contains a single prefix path, then
b) Let P be the single prefix-path of tree
c) Let Q be the multipath part with the top branching node replaced by a null root
d) For each combination (denoted as β) of the nodes in the path P do
e) Generate pattern β ∪ α with support = minimum support of nodes in β
f) Let freq-pattern-set(P) be the set of patterns generated
g) Else let Q be Tree
h) For each item ai in Q do
i) Generate pattern β = ai ∪ α with support = ai support
j) Construct β’s conditional pattern-base and then β’s conditional FP-tree treeβ
k) If treeβ ≠ φ
l) Then call FP-growth (Treeβ, β)
m) Let freq-pattern-set (Q) be the set of patterns generated
n) Return (freq-pattern-set (P) ∪ freq-pattern-set(Q) ∪ freqpattern- set(P) ∗ freq-pattern-set(Q)))
Fuzzy C-Means Clustering Algorithm
Fuzzy c-means (FCM) algorithm is applied on the frequent pattern dataset. Each data point is classified into the cluster with the highest membership value. FCM is based on the minimization of the following objective function. The objective function is calculated in each iteration.
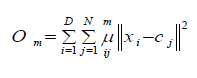
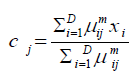
Where D is the number of data points, N is the number of clusters, xi is the ith data point, Cj is the center of the jth cluster, μij is the degree of membership of xi in the jth cluster. For a given data point, xi, the sum of the membership values for all clusters is one.
FCM performs the following steps during clustering.
Step 1: The cluster membership value uij is initialized to 0
Step 2: The predefined number of clusters N is assigned. The number of clusters is 3 and each cluster represents each trend which are uptrend, downtrend and static trend.
Step 3: The cluster centers of each cluster is calculated as follow.

Step 4: The degree of membership of ith data point in each cluster is calculated and updated as follows.
Step 5: The objective function Om is calculated.
Step 6: Step 3 to 5 is repeated until Om improves less than the specified minimum threshold.
Model Implementation
This section describes the analysis and implementation results
of the Fuzzy clustering-based model for stock market prediction.
The implementation of this model follows the following steps.
1. Frequent patterns are generated from the pre-processed
dataset.
2. The frequent patterns are then clustered into three
clusters.
3. K-Nearest Neighbour Classifier assigns new data points to
the cluster centers.
The model parameters comprise of both the frequent pattern
mining parameters and the fuzzy clustering parameters which
are outlined below.
I. Minimum support = 0.6
II. Minimum support count = 60
III. Number of clusters = 3
The total number of frequent patterns generated for minimum
support of 0.6 is 94 frequent patterns.
The model has five inputs (MACD, RSI, ROC, STO and OBV) and
one output (TREND). The data is plotted in 2D and clusters are
computed using fuzzy c-means clustering function (fcm). Fuzzy
C-Means clustering is an iterative process. First, the initial fuzzy
partition matrix is generated, and the initial fuzzy cluster centers
are calculated. In each step of the iteration, the cluster centers and
the membership grade point are updated, and the objective function
is minimized to find the best location for the clusters. The process
stops when the maximum number of iterations is reached, or when
the objective function improvement between two consecutive
iterations is less than the minimum amount of improvement
specified. The three cluster centres achieved are elaborated is Table
4. Each cluster centre is a data point and it corresponds to a trend.
Data points that fall into cluster 1, 2 and 3 have static trend, uptrend
and downtrend respectively.
Table 4: Cluster Centers and their corresponding trend.

Result and Discussion
The performance of the model was studied using financial data of three banks from the period of September 2017 to January 2018. The dataset comprises of opening, high, low and closing prices as well as the traded volume of one Nigerian Bank stock. Thus, a total of 300 data points, that is 100 data points for each bank were available for testing. The five chosen technical indicators, MACD, RSI, ROC, STO and OBV were computed from the sampled data. A K Nearest Neighbor (K-NN) classifier using k=1 is adopted as the classification technique. The cluster centres are the classes that new data points will be assigned to. Each new data point is classified by a majority vote of it neighbor with the data point assigned to the class of one nearest neighbor. Static trend is assigned 1, uptrend is assigned 2 and downtrend is assigned 3. Uptrend means a price fall which is an indication to buy a stock. Downtrend means price is high and rising which is a good time for a trader to sell stock. However, when the trend is static, that is price did not go up neither did it fall, the best decision to take at that point is to hold stock.
Figure 2: Actual Vs Predicted curve for GTB.

Figure 3: Actual Versus Predicted curve for UBA dataset.

Figure 4: Actual Versus Predicted curve for ZENITH dataset.

For GTB dataset, 17 data points misclassified out of 100
data points. Therefore, the accuracy of prediction is 83%.
• For UBA dataset, 89 data points classified correctly while
11 are misclassified. Therefore, the accuracy is 89%.
• For ZENITH dataset, 82 data points classified correctly
while 18 are misclassified. Therefore, the accuracy is 82%.
Table 5 summarizes the number of data points that were
classified under each cluster for each bank. For GTB and UBA,
cluster 2 has the highest number of data points classified to
it which corresponds to uptrend. This means that there were
generally more uptrends during the testing period, meaning that
prices fell mostly within this period, hence buying GTB and UBA
shares during this period would have been more profitable than
selling. However, cluster 3 has the highest classification for ZENITH
which corresponds to downtrend. This means that prices rose more
during this period, hence selling ZENITH shares would be more
profitable than buying.
Table 5: Classification of data points per cluster.

Performance Evaluation
The evaluation criteria used in this paper is Hit Ratio and its expression is shown in equation 13.
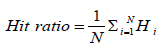
Where
Hi = 1 predi = Acti otherwise 0.
predi is the predicted output value,
Acti is the actual output value
N is the number of test data points. N is 100 for each bank.
Table 6 and Figure 5 shows the hit ratio of each bank and also
the number of 1’s and 0’s for each bank.
Table 6: Hit ratio for each bank.

Figure 5: Hit Ratio value for each bank.

Therefore, the model has an average accuracy of 84.67%.
Conclusion
This paper has proposed a novel approach for predicting stock market trends using frequent pattern mining, fuzzy clustering and k-nearest neighbor algorithms. A total of 742 data points were obtained online. Five technical indicators were chosen for this paper. Based on these indicators, dataset required for analysis was created. The dataset was preprocessed and then mined for frequent patterns. By choosing a minimum support 0.6, 94 frequent patterns were obtained. Fuzzy C-means clustering algorithm was applied to the frequent pattern dataset and three cluster centres were obtained and interpreted to represent either uptrend, downtrend or static trend. The performance of the model was studied using financial data of three banks. A total 100 data points for each bank were available for testing. The five chosen technical indicators, MACD, RSI, ROC, STO and OBV were computed from the sampled data. K-Nearest Neighbour model using k = 1 was adopted to test the model. The cluster centres are the classes that new data points will be assigned to andeach new data point was classified by a majority vote of it neighbour with the data point assigned to the class of one nearest neighbour. The predicted trends were compared with the actual trends to those that classified correctly and otherwise. The work was benchmarked with a neural network model that used the following parameters; 668 samples of training data, 100 samples of testing data, 5 inputs, 10 hidden neurons, 3 output layers and 40 iterations. The comparison shows that this research work performed better than the neural network model.
At the end of this research;
a) A stock market trend prediction model that can predict satisfactory the stock market trend using a combination of five technical analysis indicators was developed. b) The prediction model showed an average prediction accuracy of 84.67%. Results from the prediction can help in the decision making of individual investors of when to buy, sell or hold a stock.Future Work
Based on the result obtained from this paper, the model has shown an efficient way of predicting real time stock trends and assisting decision making of investors. In future research, more technical indicators can be included in the model. The experiment reported in this paper was based on modeling; future work can concentrate on developing a real time prediction system which will be easy to use by individual investors.
References
- Ehsan H, Hamed D, Jamal S (2010) Application of Data Mining Techniques in Stock Markets: A Survey. Journal of Economics and International Finance 2(7): 109-118.
- Sachin k, Shailesh J, Thakur RS (2014) An Association Rule Mining Model for Finding the Interesting Patterns in Stock Market Dataset. International Journal of Computer Applications 93(9): 10-20.
- Karpio K, Lukasiewicz P, Orlowski A, Zabkowski T (2013) Mining Associations on the War saw Stock Exchange. Proceeding of the 6th Polish Symposium of Physics in Economy and Social Science 123: 553-599.
- Ravindranath B (2003) Decision Support Systems and Data Warehouses. New Age International Limited.
- Agrawal R, Imeielinski T, Swami A (1993) Mining Association Rules between Sets of Items in Large Databases. Proceedings of the ACM SIGMOD Conference on Management of Data 22(2): 207-216.
- Chaturvedi K, Patel R, Swami DK (2014) A Fuzzy Inference Approach for Association Rule Mining. IOSR Journal of Computer Engineering 16(6): 59-66.
- Agrawal R, Srikant R (1994) Fast Algorithms for Mining Association Rules in Large Databases, VLDB Conference, Los Angeles, California, USA, pp. 487-499.
- Han J, Kamber M, Tung AKH (2001) Spatial clustering methods in data mining: A survey.
- Krittithee U, Pakorn L (2015) Association Rule Mining on Stock Index Indicators. International Journal of Computer and Communication Engineering 4(1): 46-49.
- Shubhangi SU, Nandgaonkar SS (2013) Using Association Rule Mining: Stock Market Event Prediction from Financial News. International Journal of Science Research (IJSR) 4(6): 319-7064.
- Hussein D, Pepe S (2002) Investment using Technical Analysis and Fuzzy Logic. Fuzzy Sets and System 127(2): 221-240.
- Achelis SB (2000) Technical Analysis from A to Z (2nd ed.). NY: McGraw-Hill, New York, USA.


-

Mark E Smith
Bio chemistry
University of Texas Medical Branch, USA -

Lawrence A Presley
Department of Criminal Justice
Liberty University, USA -

Thomas W Miller
Department of Psychiatry
University of Kentucky, USA -

Gjumrakch Aliev
Department of Medicine
Gally International Biomedical Research & Consulting LLC, USA -

Christopher Bryant
Department of Urbanisation and Agricultural
Montreal university, USA -

Robert William Frare
Oral & Maxillofacial Pathology
New York University, USA -

Rudolph Modesto Navari
Gastroenterology and Hepatology
University of Alabama, UK -

Andrew Hague
Department of Medicine
Universities of Bradford, UK -

George Gregory Buttigieg
Maltese College of Obstetrics and Gynaecology, Europe -

Chen-Hsiung Yeh
Oncology
Circulogene Theranostics, England -
.png)
Emilio Bucio-Carrillo
Radiation Chemistry
National University of Mexico, USA -
.jpg)
Casey J Grenier
Analytical Chemistry
Wentworth Institute of Technology, USA -

Hany Atalah
Minimally Invasive Surgery
Mercer University school of Medicine, USA -

Abu-Hussein Muhamad
Pediatric Dentistry
University of Athens , Greece
