


Lupine Publishers Group
Lupine Publishers
ISSN: 2643-6744
Research ArticleOpen Access
Employment of Resonators for Resolution Enhancement in Plasmonic Refractive Index Sensors Volume 3 - Issue 1
Received: August 7, 2023; Published: August 11, 2023
*Corresponding author:Hamid Abbasi, Department of Computer Science, University of Mazandaran, Iran
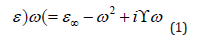
w
DOI: 10.32474/CTCSA.2023.03.000154
Abstract
In this paper, a plasmonic refractive index sensor based on metal insulated metal waveguide (MIM) with three rings and a resonant cavity is first proposed and numerically evaluated. Next, we add four teeth to the sensor structure. We study and simulate the resonant wavelengths and refractive index of resonators using the time difference finite difference method. Given that the sensor and the conduction characteristics of plasmonic waves are influenced by the structure parameters, Therefore, by changing the refractive index and changing the dimensions and coordinates of the cavity and rims, we can change the passage coefficient in the resonant modes and measure the sensor performance. As a result, we obtain the sensitivity coefficient, the figure of merit (FOM) and the quality factor Q of the sensor. We modulate the resonance wavelength FWHM using the generated modes and reach a sensitivity of 2166 nm / RIU. These plasmonic sensors with a simple framework and balanced performance and high optical resolution can be used to measure the refractive index in the medical, chemical and food industries.
Keywords: Plasmonics; Surface Plasmon Polaritons; Metal-Insulator-Metal; Refractive Index Sensor.
Introduction
The attractive feature of Surface Plasmon Polarites (SPP), i.e., the restriction of light in nano-dimensions, has caused this phenomenon to be widely studied and this feature can be used to build many plasmonic structures such as filters [1], multiple optical instruments [2], absorbers [3], splitters [4] and sensors [5-13]. Also, Metal-Insulated-Metal Plasmonic Waveguide (MIM) due to its ability to limit light in a small area and its compatibility with electronic operating systems is widely used in the design of many plasmonic devices. In addition, having a simple design method of these structures has made them one of the most desirable and popular structures. As a result, a variety of MIM plasmonic devices have been designed and implemented [14,15]. Many criteria can be used to design and implement refractive index sensors, one of which is the calculation of good sensitivity (S) and Figure of Merit (FOM) [16-24]. For this reason, researchers have made great efforts to improve the sensitivity of MIM plasmonic sensors, but longer wavelengths always suffer from wider FWHM, which reduces the Figure of Merit (FOM) and sensitivity coefficient. Recently, to enhance the performance of plasmonic sensors, various approaches have been used, such as Fano resonance with dark and light resonance interference, which results from structural symmetry failure or resonance interference, but such resonance is unstable and can be easily broken due to phase or mode mismatch. In this study, arrays of Metal-Dielectric-Metal (MIM) plasmonic waveguides and resonators are designed, simulated and analyzed to design and fabricate plasmonic sensors. The two-dimensional Finite Difference Time Domain (FDTD) method is used to simulate the sensor. Boundary conditions for all directions are selected as the Perfectly Matched Layer (PML). To simulate FDTD, a uniform mesh size of 8 nm was used.
Structural Model and Theory Analysis
As shown in Figure 1, two MIM waveguides coupled with three rings and a cavity are proposed. The waveguides are etched on the silver surface. As shown in the 2D picture, the grey and white areas represent silver and air, respectively. The permittivity of air is set as εi = 1, as for silver (Ag) the Drude model is utilized as follows [1]:
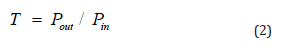
Here 𝖼∞ =1 gives the medium constant for the infinite frequency, ωp = 1.37 × 10¹⁶ refers to bulk frequency for plasma, γ = 3.21 × 10¹³ means damping frequency for electron oscillation, and ω shows incident light angular frequency. To describe metal and plasmonic waveguides in sensors, the Drude model is used because the Drude model can be easily integrated into time-difference finite difference simulations. The height of the two waveguides is w1 = 50 nm. The cavity has a height of w2 = 130 nm and a length of L1 = 92 nm. The middle ring has an inner radius of r1 = 90 nm and an outer radius of R1 = 133 nm and the two side rims have an inner radius of r3 = r2 = 91 nm and an outer radius of R3 = R2 = = 126 nm, respectively. Pin and Pout are monitors for measuring the input wave and the output wave, respectively. These two monitors are computed by merging the natural component of the Point Ting vector along the blurred lines. As a result, the wave transmission is calculated by the relation:
Surface plasmon polarities (SPP) TM mode, when attached to the MIM structure, can propagate at the interface level in the waveguide. Compared to the excited wavelength, the width of the bass waveguide is much smaller, so only the TM base mode can participate in the sensor simulation. The input wave starts moving from the left and after passing through the rings and cavities, it goes to the output waveguide. The silicon substrate is made of silver and the reason for this is to strengthen the performance of the refractive index [25]. We also use the following equations to calculate the TM wave scattering relationship [15]:
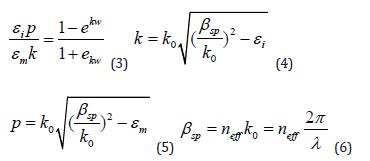
Here ω refer to the width of bus waveguide, λ shows incident light wavelength in vacuum, εi and εm give the relative dielectric and metal permittivity, βspp and neff are propagation constant and effective refractive index of SPPs, and =2π⁄λ k0 means wave number. Two-dimensional simulation is used to enhance sensor performance and achieve more accurate results and reduce simulation time. We must also choose the right height for the input wave, because too much wave height will reduce the wave penetration into the sensor structure and reduce the refractive index (can lead to longer propagation length) [26]. To describe the wave behavior, we draw a field distribution diagram (Figure 2). According to the figure, the wave goes to the resonators after starting to move. The resonant system is now considered as a single loop resonator whose effective radius is determined by the energy distribution. The middle cavity gets the largest share of the field distribution and creates a uniform state with the internal phase. MIM waveguide transmission spectra for different modes are plotted in Figure 3. When the middle ring is present in the sensor structure with one of the other three resonator (R2 ring or R3 ring or cavity), the transmission spectrum has three peaks but when all four resonators (R1 ring, R2 ring, R3 ring and cavity) are present in the sensor structure, the transmission spectrum has two peaks. Also, the wavelength changes in this diagram (R1 ring, R2 ring, R3 ring and cavity) are more and will reach a higher sensitivity factor. Therefore, we use the following equation to calculate the resonance conditions:
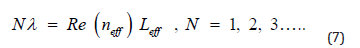
Where N refers to mode number which is an integer. neff refers to the effective refractive index of the ring resonator which can be solved by Eq (6), Leff means effective perimeter, generally refers to the average of the inner and outer perimeters.
Fracture Coefficient Simulation and Measurement Methods
The proposed plasmonic resonance behavior is investigated numerically and theoretically. For the numerical approach, we use the finite difference method of time domain with perfectly matched layer boundary conditions (PML) because this method effectively reduces numerical reflection. The uniform mesh sizes for the x and y directions are 8 and 8 nm, respectively. The transmission line model is used to analyze the structure theory and the simulation is done in two dimensions, which is infinite in one dimension. We change the effective refractive index of the middle ring to evaluate the performance of the sensor. This change in refractive index is calculated in the wavelength range of 400 to 1500 nm and the transmission spectrum from the sensor device is shown in Figure 4. We increased the dielectric refractive index by a step of 0.01 from 1.15 to 1.2, which resulted in a change in the resonance spectra and wavelengths. We increased the dielectric refractive index by a step of 0.01 from 1.15 to 1.2 nm, which resulted in a change in the resonance spectra and wavelength. The first characteristic to be measured for a sensor is the S sensitivity, which is used to quantify the sensitivity of refractive index sensors:
Figure 1: Two-dimensional image of a plasmonic sensor.

Figure 2: Electric field distribution at resonant frequency.

Figure 3: MIM waveguide transmission spectrum with resonators.

In this equation, Δλ is the change in resonance wavelength and Δn is the change in refractive index. According to Figure 5, the sensor transmission spectra have two peaks, which according to Figure 4, have the highest sensitivity for the refractive index n = 1.2, which is equal to 1938 nm / RIU. According to this diagram, there is a relatively linear relationship between the two parameters of resonance wavelength and refractive index. Because sensitivity alone is not a measure of good performance for comparing different types of sensors, and light resolution is also very important for sensors, Figure 6, Figure of Merit (FOM) is required to compare sensors:
Figure 4: Transmission spectra of a plasmonic refractive index sensor.

Figure 5: Plasmonic sensor sensitivity coefficient diagram.

Figure 6: Plasmonic sensor FOM diagram.

We also need the quality factor of the sensors:
According to Figure 7, the quality coefficient is obtained by using Equation 10 by dividing the wavelength by FWHM, whose value in the refractive index n = 1.2, which has the highest sensitivity coefficient, reaches 8.934. Equations 8, 9 and 10 are the Measurement capabilities of plasmonic sensors obtained by changing the refractive index of the structure. Using these three equations, we plot the coefficients of sensitivity, quality, and figure of merit.
Sensitivity Analysis of the Sensor by Adding Four Teeth
Now for better evaluation and to achieve a better-quality sensor, we add four teeth with length x1 = x3
= 20, x2 = x4 = 40, height y1 = y3 = 40 and y2 = y4 = 20, to the middle ring. The added teeth have an effect on the intensification of the middle ring Figure 8, which changes the intensification wavelength or creates a new state. We change the refractive index of the middle ring and the refractive index of the other two rings and the teeth, and the cavity and the two waveguides remain constant. The transmission spectrum of the sensor device is shown in Figure 9. According to this diagram, there is a relatively linear relationship between the two parameters of resonant wavelength and refractive index, and the TM resonance in the range of 400 to 1500 nm, gradually shifting Gives. By changing the refractive index by step 0.01 in the range 1.15 to 1.2, we obtain the sensitivity coefficient of the new structure using Equation 8 and plot it (Figure 10). The refractive index diagram in Figure 10 examines the peaks in Fig.9. In the left peak, all sensitivity coefficients are equal to zero, but the right peak has good results, and the highest sensitivity coefficient is equal to 2166 nm / RIU. The result is better than many similar articles. We now examine the figure of merit (FOM) of the designed sensor. Using Equation 9, we obtain its diagram and draw it Figure 11. Like the sensitivity coefficient, all mode 1 numbers of the figure of merit (FOM) are zero, but mod 2 has better quality and the highest FOM value is 18.447. The next criterion for measuring the performance of this sensor is the quality factor Q. The quality coefficient Q at n = 1.16 (which has the highest sensitivity coefficient) reaches 8.164 nm Figure 12.
Figure 7: Plasmonic sensor FOM diagram.

Figure 8: Sensitivity diagram of a plasmonic sensor with four teeth added.

Figure 9: Transmission spectra of a plasmonic refractive index sensor.

Figure 10: Plasmonic sensor sensitivity coefficient diagram.

Figure 11: Plasmonic sensor FOM diagram.

Figure 12: Plasmonic sensor quality coefficient diagram.

Bio-Sensing
Finally, we review an application for bioassay. The structure parameters remain constant. Since water is one of the most common solvents used in chemical and biological applications, it is necessary to test the performance of the sensor in water (n=1.33) as presented in Figure 13. Since the concentration of the solution can be reflected by the refractive index, a set of different refractive index values around the water is used to measure the sensitivity and the figure of merit (FOM). The transmission spectrum from the sensor device is shown in Figure 14. We have increased the refractive index of the middle cavity by a step of 0.0 nm from 1.34 to 1.38. Using the transfer spectrum and using Equation 8, we calculate the sensitivity coefficient of the plasmonic sensor in water, which reaches the sensitivity coefficient of 2604 nm / RIU. This sensitivity coefficient is higher than similar tasks and proves that this designed sensor has high quality and good performance and has a very good performance in water (Figure 15). Therefore, such structure can be a sensitive label-free and compact biosensor.
Figure 13: Plasmonic sensor quality coefficient diagram.

Figure 14: Transmission spectrum of a plasmonic sensor in water.

Figure 15: Plasmonic sensor sensitivity coefficient diagram in water.

Conclusion
A new topology was proposed and analyzed to measure the refractive index. The proposed configuration has a high sensitivity of 2166 nm / RIU. This sensor is considered because a small change in the refractive index of the middle ring causes a significant change in the propagation characteristics of the wave. It also has a high sensitivity as a sensor in bioassay and has excellent performance with high optical resolution. The plasmonic sensor in water reaches a sensitivity factor of 2604 nm / RIU. Our results and physical analysis due to the small size of the structure and high sensitivity coefficient can cause excellent light control in plasmonic structures and reduce losses.
Funding
This research received no external funding.
Disclosures
The author declares no conflicts of interest.
Data Availability
No data were generated or analyzed in the presented research.
References
- Xia Z, Wang X, Zhang L, Zhan Qin, Xingming Sun, et al. (2016) A Privacy-Preserving and Copy-Deterrence Content-Based Image Retrieval Scheme in Cloud Computing[J]. IEEE Transactions on Information Forensics & Security 11(11): 2594-2608.
- Deng R, Lu R, Lai C, Tom H Luan, Hao Liang (2017) Optimal Workload Allocation in Fog-Cloud Computing Toward Balanced Delay and Power Consumption[J]. IEEE Internet of Things Journal 3(6): 1171-1181.
- Yamazaki K (2018) Computer-assisted learning of communication (CALC): A case study of Japanese learning in a 3D virtual world[J]. ReCall 30(2): 214-231.
- Asadchih O, Dybska T (2020) The experimental testing of blended learning methods of oral Japanese lanuage teaching aimed at future philologists[J]. ScienceRise Pedagogical Education 3(36): 58-61.
- Yang Liu, Mingyan Liu (2017) An Online Learning Approach to Improving the Quality of Crowd- Sourcing[J]. IEEE/ACM Transactions on Networking 25(4): 2166-2179.
- Mun Hong Choe, Jiyeong (2017) Motivation, Strategy Use, and Self-efficacy Beliefs in Korean University Students. L2 English Proficiency[J]. Korea Journal of English Language and Linguistics 17(3): 519-545.
- Bruin B D, Floridi L (2017) The Ethics of Cloud Computing[J]. Science and Engineering Ethics 23(1):21-39.
- Jin L, Zhang Y, Chen X, Yang Xiang (2018) Secure attribute-based data sharing for resource-limited users in cloud computing[J]. Computers & Security, 2018, 72(1): 1-12.
- Xiao S, Xie X, Wen S, Zhigang Zeng, Tingwen Huang, et al. (2017) GST-Memristor-Based Online Learning Neural Networks[J]. Neurocomputing 272(10): 677-682.
- Leonidou C N, Skarmeas D (2017) Gray Shades of Green: Causes and Consequences of Green Skepticism[J]. Journal of Business Ethics 144(2): 401-415.
- Hirai T, Masuyyama H, Kasahara S, Yutaka Takahashi (2017) Performance analysis of large-scale parallel-distributed processing with backup tasks for cloud computing[J]. Journal of Industrial & Management Optimization 10(1): 113-129.
- Ling J, Shen S, Li J, Xijun Liang, Lei Li (2017) Budget Online Learning Algorithm for Least Squares SVM[J]. IEEE Transactions on Neural Networks & Learning Systems 28(9): 2076-2087.
- Jifara W, Jiang F, Zhang B , Huapeng Wang, Jinsong Li (2017) Hyperspectral image compression based on online learning spectral features dictionary[J]. Multimedia Tools & Applications 76(23): 25003-25014.
- Wei W, Fan X, Song H, Xiumei Fan, Jiachen Yang (2018) Imperfect Information Dynamic Stackelberg Game Based Resource Allocation Using Hidden Markov for Cloud Computing[J]. IEEE Transactions on Services Computing 11(1): 78-89.
- Wang S, Zhou J , Joseph K Liu, Jianping Yu, Jianyong Chen, et al. (2017) An Efficient File Hierarchy Attribute-Based Encryption Scheme in Cloud Computing[J]. IEEE Transactions on Information Forensics and Security 11(6): 1265-1277.
- Barsoum A, Hasan M A (2017) Provable Multicopy Dynamic Data Possession in Cloud Computing Systems[J]. IEEE Transactions on Information Forensics & Security 10(3): 485-497.
- Tsai J L, Lo N W (2017) A Privacy-Aware Authentication Scheme for Distributed Mobile Cloud Computing Services[J]. IEEE Systems Journal 9(3): 805-815.
- Ping L, Li J, Huang Z, Tong Li, Chong Zhi Gao, et al. (2017) multi-key privacy-preserving deep learning in cloud computing[J]. Future Generation Computer Systems 74(1): 76-85.
- Tang W, Feng W (2017) Parallel map projection of vector-based big spatial data: Coupling cloud computing with graphics processing units - ScienceDirect[J]. Computers, Environment and Urban Systems 61(1): 187-197.
- Yi H, Chan J, Alpcan T, Christopher Leckie (2017) Using Virtual Machine Allocation Policies to Defend against Co-Resident Attacks in Cloud Computing[J]. IEEE Transactions on Dependable & Secure Computing 14(1): 95-108.
- Weidlich J, Bastiaens T J (2017) Explaining social presence and the quality of online learning with the SIPS model[J]. Computers in Human Behavior 72(1): 479-487.


-

Mark E Smith
Bio chemistry
University of Texas Medical Branch, USA -

Lawrence A Presley
Department of Criminal Justice
Liberty University, USA -

Thomas W Miller
Department of Psychiatry
University of Kentucky, USA -

Gjumrakch Aliev
Department of Medicine
Gally International Biomedical Research & Consulting LLC, USA -

Christopher Bryant
Department of Urbanisation and Agricultural
Montreal university, USA -

Robert William Frare
Oral & Maxillofacial Pathology
New York University, USA -

Rudolph Modesto Navari
Gastroenterology and Hepatology
University of Alabama, UK -

Andrew Hague
Department of Medicine
Universities of Bradford, UK -

George Gregory Buttigieg
Maltese College of Obstetrics and Gynaecology, Europe -

Chen-Hsiung Yeh
Oncology
Circulogene Theranostics, England -
.png)
Emilio Bucio-Carrillo
Radiation Chemistry
National University of Mexico, USA -
.jpg)
Casey J Grenier
Analytical Chemistry
Wentworth Institute of Technology, USA -

Hany Atalah
Minimally Invasive Surgery
Mercer University school of Medicine, USA -

Abu-Hussein Muhamad
Pediatric Dentistry
University of Athens , Greece
