Lupine Publishers Group
Lupine Publishers
Menu
ISSN: 2643-6744
Review ArticleOpen Access
A Data Collection and Visualization System for Smart Buildings Volume 1 - Issue 3
Xinzhou Wei* and Astrid Frank
- Department of Electrical and Telecommunications Engineering Technology, New York City College of Technology, USA
Received:February 09, 2019; Published:February 20, 2019
*Corresponding author: Xinzhou Wei, Department of Electrical and Telecommunications Engineering Technology, New York City College of Technology, New York City, NY 11201, USA
DOI: 10.32474/CTCSA.2019.01.000111
Abstract
As a very import part of the Internet of Things (IoT), smart buildings usually consist of wireless sensor network (WSN) and many radio-frequency identification devices for data collection instantly. This paper presents a real time data collection and visualization scheme for smart buildings. We propose a framework that uses both open source hardware and software to collect the event driven data from a WSN and subsequently convert them to the query-based data which is needed by cloud server. Experiment results demonstrated that the proposed framework is feasible for efficiently visualizing data locally and preparing query-based data for cloud storage server.
Keywords: Wireless Sensor Network; Iot; Data Visualization; Smart Building
Introduction
Wireless sensor network (WSN) is a very important part of the Internet of Things (IoT) [1]. It is composed of several thousands of sensor nodes which are capable of sensing, actuating and relaying the collected information [2-4]. The primary function of WSN is to obtain information from sensors and monitor environments. In recent years, many WSN applications have been developed. Particularly, in smart home or smart building applications [5], all sensors connected to WSN will collect data and subsequently forward them to a central device referred as WSN hub or gateway. These data could be saved locally and finally uploaded on cloud storage server like Blink or Arlo home security system. In general, the cloud storage server is the center of smart home or smart building. As a result, users need access these data anytime or anywhere from their smart phone or other mobile devices. Hence, all the smart building related management applications could be considered as cloud based IoT systems [6-7].
With the data collected on a WSN in real time, users can employ a smart building management application to visualizing these data in a local machine or upload these data on the cloud for a broad management purpose. Because there are many different protocols exist on IoT, one of the biggest challenges for general management applications is the interoperability. That is, the devices on IoT working on different protocols cannot communicate and exchange data compatibly. Most importantly, the products with the same protocols are not even always interoperable across different profiles [7]. Moreover, the data collected from WSN sensors are the event-based raw data. Those data must be subsequently converted to a query-based format for an efficient usage by different protocols with difference devices. Meanwhile, all those data should be stored persistently in the cloud server at multiple levels. Later, they could be easily combined and processed with previously stored data, as well as with other non-IoT data [8]. Thus, in this paper, we propose a cross-platform system to visualize WSN data and convert the event-based data to a query-based format for the cloud storage server. This paper is organized as follows: section 2 described the proposed structure of WSN. Experiment results are shown in section 3. Section 4 draws the conclusion and future work.
Structure of WSN
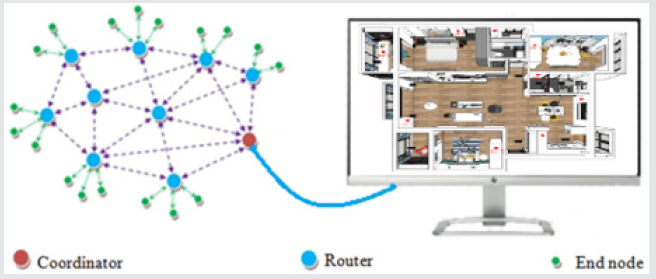
One of the most popular WSN protocols is ZigBee [9]. A typical ZigBee based wireless sensor network is shown in Figure 1. The XBee module is an implementation of ZigBee standard from Digi International Inc. [www.digi.com]. There are three parts in XBee/ ZigBee mesh network: coordinator (red dot), router (blue dot) and end node (green dot) [10]. All the data collected by end nodes will be forwarded to coordinator via routers in the WSN and processed by a local computer directly connected with that coordinator. In our work, we adopted XBee/ZigBee based WSN for the data collection. In XBee/ZigBee based WSN, one XBee module is configured as coordinator and there are many other XBee modules are configured as routers that could be connected to sensors [11]. A temperature sensor is attached on end node (green dot) in our system as demonstrated in Figure 1. An XBee wireless node is actually a microcontroller with a wireless radio transceiver. XBee provides both analog port and digital port based on its configuration. The detailed XBee configuration could be found in Faludi’s work [10]. Figure 2 shows the circuits on a breadboard, prototype board, and print circuit board of a wireless sensor node in our experiment.
Experiment Results
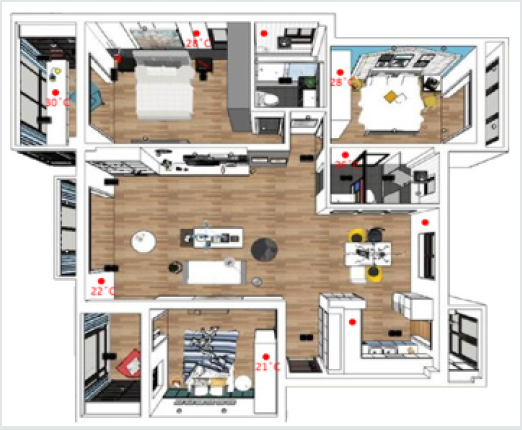
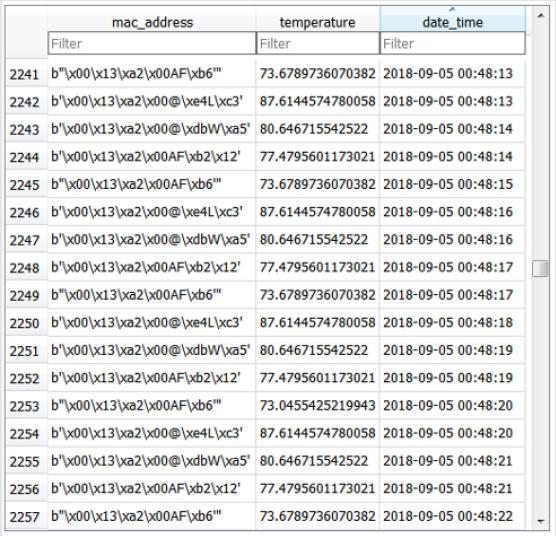
In a smart building scenario, we mount the wireless sensors in different locations in a building. The sensors will collect temperature, transmit these data in real time, and forward those data to an XBee coordinator which is connected with a computer. In Figure 3, we demonstrated our experiment result created by an open source programming language named “processing” [12]. The temperature data are displayed based on their locations in the building with red dots representing the XBee wireless sensor nodes. We also can animate the temperature data and blink the dots in order when our system receive the data nodes. The original data were recorded in Fahrenheit. Then, we converted the temperature unit to Celsius in visualization tool as shown in Figure 3. The “processing” is a Java based language so the results could be exported to a Java applet and used in a web browser-based management application. To convert the event-driven based data in query-based format, we applied the SQLite in our system with Python. SQLite is a self-contained, serverless database engine which is very fast and light weighted. Because it requires no configuration and stores information in ordinary disk files, SQLite is a popular choice as a database to backup data in cloud storage server. Based on the corresponding MAC address of the XBee node, SQLite database system record the temperature value and add timestamp simultaneously for that node. Figure 4 demonstrates a sample of our experimental data after the conversion (Figure 4).
Conclusion
In this paper, we presented an XBee/ZigBee based WSN to collect and visualize the data in real time for smart buildings. We described the structure to build this IoT application. The framework combines both processing and python-based data visualization tool through a local computer and could be exported as a Java applet to integrate in a web page. Our work on this project can be further extended by uploading data on cloud server and using web crawling technique to extract data for third-parties who are interested in other IoT applications.
Acknowledgment
This work is supported in part by the Undergraduate Research Program of the City University of New York (CUNY) and the PSCCUNY grant.
References
- Minoli D, Sohraby K, Occhiogrosso B (2017) IoT considerations, requirements, and architectures for smart buildings-Energy optimization and next-generation building management systems. IEEE Internet of Things 4(1): 269-283.
- Bustamante B, Delgado J, Febres C, Montano V, Saritama C, Ramirez C (2018) Wireless sensor network for real-time monitoring of temperature, humidity and illuminance in an orchid greenhouse. 13th Iberian Conference on Information Systems and Technologies (CISTI).
- Chauhan J, Bojewar S (2016) Sensor networks-based healthcare monitoring system. International Conference on Inventive Computation Technologies (ICICT) 2: 1-6.
- Ray PP (2016) An Internet of Things based approach to thermal comfort measurement and monitoring. 3rd International Conference on Advanced Computing and Communication Systems (ICACCS), pp.465-471.
- Ghayvat H, Mukhopadhyay S, Gui X, Suryadevara N (2015) WSN-and IOT-based smart homes and their extension to smart buildings. Sensors 15(5): 10350-10379.
- Mitton N, Papavassiliou S, Puliafito A, Trived KS (2012) Combining cloud and sensors in a smart city environment. EURASIP Journal on Wireless Communications and Networking.
- Biljana L Risteska Stojkoska, Kire V Trivodaliev (2017) A review of Internet of Things for smart home: Challenges and solutions. Journal of Cleaner Production 140: 1454-1464.
- Da Xu, L, He, W, Li S (2014) Internet of things in industries: a survey. IEEE Trans. Ind. Inf. 10(4): 2233-2243.
- Zig Bee Specification.
- Faludi R (2010) Building Wireless Sensor Networks: with ZigBee, XBee, Arduino, and Processing, O’Reilly Media.
- Wei X, Gen L, Zhang X (2017) An Open Source Data Visualization System for Wireless Sensor Network. Journal of Computer Science and Information Technology 5(2): 10-17.
- Overview - A short introduction to the Processing software and projects from the community.

Top Editors
-

Mark E Smith
Bio chemistry
University of Texas Medical Branch, USA -

Lawrence A Presley
Department of Criminal Justice
Liberty University, USA -

Thomas W Miller
Department of Psychiatry
University of Kentucky, USA -

Gjumrakch Aliev
Department of Medicine
Gally International Biomedical Research & Consulting LLC, USA -

Christopher Bryant
Department of Urbanisation and Agricultural
Montreal university, USA -

Robert William Frare
Oral & Maxillofacial Pathology
New York University, USA -

Rudolph Modesto Navari
Gastroenterology and Hepatology
University of Alabama, UK -

Andrew Hague
Department of Medicine
Universities of Bradford, UK -

George Gregory Buttigieg
Maltese College of Obstetrics and Gynaecology, Europe -

Chen-Hsiung Yeh
Oncology
Circulogene Theranostics, England -
.png)
Emilio Bucio-Carrillo
Radiation Chemistry
National University of Mexico, USA -
.jpg)
Casey J Grenier
Analytical Chemistry
Wentworth Institute of Technology, USA -
Hany Atalah
Minimally Invasive Surgery
Mercer University school of Medicine, USA -

Abu-Hussein Muhamad
Pediatric Dentistry
University of Athens , Greece

The annual scholar awards from Lupine Publishers honor a selected number Read More...


