Lupine Publishers Group
Lupine Publishers
Menu
ISSN: 2690-5760
Research ArticleOpen Access 
Connected Aircraft Squadron Electrocardiographic Sign (Yasser Sign); An Index for Tachypnea in Specific T-Wave Abnormalities- A New Diagnostic, Therapeutic, and Prognostic Sign; Retrospective-Observational Study Volume 1 - Issue 3
Yasser Mohammed Hassanain Elsayed*
- Critical Care Unit, Fraskour Central Hospital, Damietta Health Affairs, Egyptian Ministry of Health (MOH), Egypt
Received: January 06, 2020 Published: January 17, 2020
Corresponding author: Yasser Mohammed Hassanain Elsayed, Critical Care Unit, Fraskour Central Hospital, Damietta Health Affairs, Egyptian Ministry of Health (MOH), Damietta, Egypt
Abstract
Background: Tachypnea is a well-known clinical symptom. Specific electrocardiographic T-wave changes during tachypnea are a crucial point in the decision. The new sign is a constellation of the T- waves changes in special leads. There are three types were prescribed. The types have classified either base on an interaction between lead I and II, or aVL and aVR or V1 and V2. Hyperventilation syndrome, left bundle branch block, left ventricular strain, and Wolff-Parkinson-White syndrome was common inducers.
Method of study and patients: My case study was an observational retrospective 24-case report series. The study was conducted in both Fraskour Central Hospital (Intensive Care Unit) and Physician Outpatient Clinic. The author reported the 24-cases thorough nearly 4 years, started from December 24, 2015, and, ended on November 30, 2019.
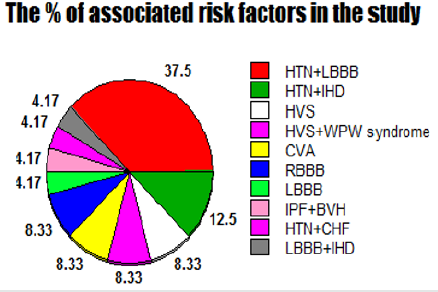
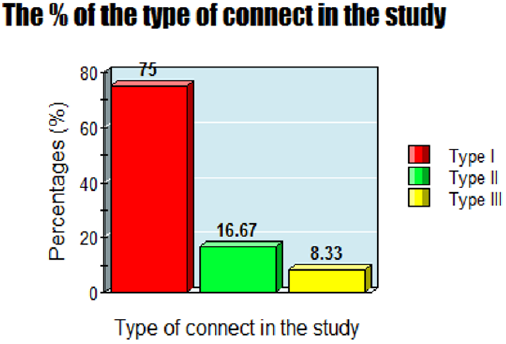
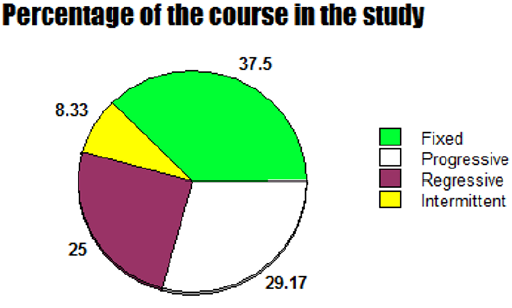
Results: The Mean age was: 63 years, with female sex predominance (62.5%). Hypertension with left bundle branch block (37.5%), hypertension with ischemic heart disease (12.5%), hyperventilation syndrome (8.33%), Wolff-Parkinson-White syndrome with hyperventilation syndrome (8.33%), cerebrovascular accident (8.33%), and right bundle branch block (8.33%) are the most common risk factors. The average for respiratory rate (bpm): (Range 20-55, Mean 31.625, Median 30, and Mode 26). An either third (33.33%) or fourth degree (25%) represent the complete sign: if it includes. Type I was the commonest (75%). Variable course outcome was reported; progressive (29.17%), regressive (25%), intermittent (8.33%), and fixed (37.5%). Conclusions: Connected aircraft squadron electrocardiographic sign is a new strong index for monitoring and follows up the tachypneic patients with specific T- waves changes in special leads in several cardiorespiratory patients.
Keywords: Connected aircraft squadron electrocardiographic Sign; Yasser sign; Tachypnea; Specific T-wave abnormalities; Index for tachypnea; Hyperventilation
Abbreviations: ABG: Arterial blood gases; AMI: Acute myocardial infarction; BA: Bronchial asthma Congestive heart failure: CHF; CO2: Carbon dioxide; COPD: Chronic obstructive pulmonary disease; CXR: Chest X-ray; DKA: Diabetic ketoacidosis; ECG: Electrocardiograph; ED: Emergency Department; HVS: Hyperventilation syndrome; ICU: Intensive care unit; IHD: ischemic heart disease; IV: Intravenous; LBBB: Left bundle branch block; LVH: Left ventricular hypertrophy; MA: Metabolic acidosis; NSTEMI: Non- ST-elevation myocardial infarction; O2: Oxygen; PE: Pulmonary embolism; POC: Physician outpatient clinic; RBBB: Right bundle branch block; RBS: Random blood sugar; RR: Respiratory rate; SCD: Sudden cardiac deaths; TCT: Thoracic CT; VQ scan: Ventilationperfusion scan.
Introduction
Tachypnea
Description: Tachypnea is currently a description of rapid breathing. The normal average of the respiratory rate (RR) at rest in an adult is 12 to 20 breaths per minute. Tachypnea is indicated in adults by a respiratory rat of more than 20 breaths per minute [1]. Tachypnea is not a disease, but a symptom that the body is trying to correct another problem [2].
Pathophysiology and differential diagnosis: An oxygen deficiency or marked carbon dioxide (CO2) retention in the body is a current mechanism of pathogenesis [2]. It can be a result of other health issues [2]. Tachypnea is an expression of rapid and shallow breathing. This term should not be confused as hyperventilation syndrome (HVS) which occurs when a patient’s breathing is rapid but deep [3]. Hyperventilation is an increase in the ventilation of the alveoli (which can occur via increased RR or depth of respiration or both) where there is a minimal rise in metabolic CO2 comparative to this rise in ventilation. In simultaneously, hyperpnea also considered in the differential diagnosis, which is defined as breathing more rapid and deep than breathing at rest [4]. So, in hyperpnea, there is an increase in the respiration rate that is nearly proportional to the increase in metabolic rate [4]. The oxygen (O2) level either too low, or the CO2 level may be too high. The body tries to correct this by breathing more rapidly [2]. Both are similar in that both result from an accumulation of CO2 in the lungs leading to an increased blood CO2 [3]. This increase of CO2 in the blood will direct the blood to the acidity side. So, this will stimulate the brain sending the brain signals for the respiratory drive as a trial for correction the metabolic disturbance. Thus, the blood pH can return to within the normal range in acidity [1]. Anxiety conditions and HVS a while panic episodes will inducing tachypnea, hypocapnia, and decreased CO2 levels which in turn reduces respiratory drive [1].
Etiology: Physiological and pathological factors implicated in causing tachypnea [5,6]. Both factors should be examined in the individual causes. So, tachypnea does not necessarily have a pathological cause. Exercise-inducing tachypnea (DKA) is a typical example. Some pathological causes of tachypnea are sepsis, diabetic ketoacidosis, respiratory diseases such as pneumonia, carbon monoxide (CO) poisoning, pulmonary embolism (PE), pleural effusion, bronchial asthma (BA) or chronic obstructive pulmonary disease (COPD) [6,7]. Allergic reactions, anxiety conditions, and foreign body aspiration are also possible causes of tachypnea [6,7]. Congestive heart failure (CHF) can also be a cause of tachypnea and if not managed, can progress to worsening CHF [1]. Tachypnea can be a symptom of sepsis or acidosis, such as DKA or metabolic acidosis (MA) [7].
The clinical and tachypnea: Patients may present with dyspnea. On clinical examination; peripheral cyanosis and the use of accessory muscles or chest muscles to breathe are possible associated signs [1].
Tachypnea evaluation and workup: The evaluation for a cause of tachypnea is based on the patient’s general status. Physician can evaluate dependent on pulse oximetry for O2, arterial blood gases (ABG) for metabolic state, chest X-ray (CXR), Thoracic CT (TCT), pulmonary function tests (PFT), random blood sugar, electrolytes profile (especially, sodium, potassium, ionized Ca++ and magnesium), hemoglobin, electrocardiogram (ECG), VQ scan, brain MRI and/or a toxicology screen [1]. ABG gives an estimate of O2 and CO2 content which can assist in determining the pH as well as metabolic abnormalities. If the pH indicates acidosis, some potential causes are DKA, lactic acidosis or hepatic encephalopathy8. A random blood sugar, if taken, can indicate or rule out DKA as well [9,10]. A CXR can depict any pulmonary causes of tachypnea, such as a pneumothorax, cystic fibrosis or pneumonia11. A TCT, which shows greater detail, can be used to indicate any other lung pathologies or potential malignancies. Apart from imaging, PFT can help determine causes from obstructive lung diseases such as COPD or BA. VQ scans can be helpful if signs and symptoms point to a potential APE [12]. If tachypnea is due to cardiac diseases, an ECG will show evidence of acute myocardial infarction (AMI) or arrhythmias [13,14]. A full blood count (FBC) and complete metabolic panel can indicate any evidence for anemia or infections, which can potentially cause tachypnea. A toxicology screen can evaluate if there are any drugs, both prescription and non-prescribed, that may be causing tachypnea [1].
Tachypnea and prognosis: Tachypnea may be benign. However, tachypnea not always points to critical illness. So, there are a variety of causes, and some may need immediate medical care [1].
Treatment: Tachypnea should be managed based on the suggested cause [1]. Lastly, when pulse oximetry is used to monitor a case of acute respiratory distress (ARD) and saturations are normal (94-98%), then, desaturation is an alert of decompensation. Historically, routinely giving O2 to every patient in ARD did little to mitigate their difficult respiration and, in patients who were not hypoxic, effectively masked deterioration that would be seen in a decreasing O2 saturation. Capnography is also very important as a monitoring device for ARD [15,16].
T-wave
Normal T-wave and physiology
The electrocardiographic T-wave represents the repolarization of the ventricles [17,18]. The interval from the beginning of the QRS-complex to the apex of the T-wave is assigned as the absolute refractory period (ARP). The last half of the T-wave is named as the relative refractory period (RRP) or vulnerable period. The T-wave contains more information than the QT-interval. The T-wave can be described by its symmetry, skewness, slope of ascending and descending limbs, amplitude and subintervals like the Tpeak-Tend interval [19]. The T wave is the positive deflection after each QRS complex [20]. Normally, T-waves are upright in all leads, except aVR, aVL, III and V1 leads [20,21]. Highest amplitude of T-wave is found at V2 and V3 leads. The shape of the T wave is usually asymmetrical with a rounded peak. T-wave inversions from V1 to V4 leads are frequently found and normal in children. In normal adults, T-wave inversions are less commonly found, but can be normal from V1 to V3 [21]. The depth of the T wave also becomes progressively shallow from one to the next lead [22]. The amplitude of the T-wave should not exceed 5 mm in limb leads and more than 15 mm in precordial leads [20,21]. Normally, the T-wave is formed at the end of the fast phase of ventricular repolarization [23]. Ventricular repolarization is the process by which the ventricular myocytes return to their negative resting potential so they can depolarize again. While this phase of the cardiac cycle is rapid, an upright low amplitude broad hump following the QRS-complex is seen in normal T-wave morphology [23]. However, various waveform morphologies may present as an indication of benign or clinically significant injury or insult to the myocardium. Understanding the differential diagnosis for T-wave discrepancies is crucial to the successful and safe management of various cardiac pathologies [23]. Additionally, T waves may be tall as a normal variant. Due to this, it is crucial to compare all ECG tracings with T-wave elevations to a prior study. Keep in mind elevated T-waves may even occur in as normal variation in young patients and athletes, typically in the precordial V2-V4 leads [24].
T-wave alternans
T-wave alternans (or repolarization alternans) is a rare electrical phenomenon, rarely seen on ECG, and is defined as periodic beat to beat variation in the timing, polarity or amplitude or shape of T-waves on the standard ECG [25-27]. It is signifying an in-homogeneity in the refractoriness of the myocardium, setting the stage for re-entry and facilitating onset of malignant ventricular arrhythmias [24]. The presence of T-wave alternans in the immediate pre-arrest setting was an important clue to the electrical instability of the myocardium, before ventricular fibrillation [25]. Despite the term “T-wave” alternans, alternating behavior may also involve the ST-segment and U-wave [27-30].
Inverted T-wave
Introduction: Inverted T-wave is considered abnormal if inversion depth more than 1.0 mm. Inverted T-waves found in leads other than the V1 to V4 leads is associated with increased sudden cardiac deaths (SCD). Inverted T-waves accompanied by cardiac manifestations (chest pain and cardiac murmur) are highly suggestive of IHD [21]. Other ECG changes associated with IHD are ST-segment depression with an upright T-wave; ST-segment depression with biphasic T-wave or inverted T-wave with negative QRS-complex [22]. T-wave symmetrically inverted with a pointed apex, while the ST-segment is either coved upwards or straightly depressed, or not deviated; and ST-segment depression developing to abnormal T-wave during ischemia free intervals [21]. However, ST-segment depression is not suggestive of ischemic location of the heart. ST-segment depression in ≥8 leads, associated with ST-segment elevation in aVR and V1 is accompanied by left main coronary artery disease or three-vessel disease (blockage of all three major branches of coronary arteries). ST-segment depression most prominent from V1 to V3 is suggestive of posterior MI. So, tall or wide QRS-complex with an upright T-wave is highly suggestive of the posterior MI [22]. The frequency of inverted T-waves is widely variable [31] (Table 1).
Significant and relevant causes for the inverted T-wave
A. Wolf-Parkinson-White (WPW) syndrome: Wolf- Parkinson-White (WPW) syndrome is a disorder of the cardiac conductive system resulted from the presence of an abnormal accessory pathway (AP) between the atria and ventricles [32]. It is a type of pre-excitation syndromes [33]. The problem with the electrical system of the heart involving an AP will be accompanied by symptoms [33-35]. Nearly 40% of cases never develop symptoms [36]. The typical ECG pattern seen in WPW syndrome with preexcitation is a short PR-interval (< 0.12 sec), a delta wave (slurred upstroke of the initial portion of the QRS complex), and a wide QRS complex (≥0.12 sec [33,35,37]. Not all patients with a WPW pattern on the ECG are symptomatic [38]. WPW is restricted to symptomatic patients with a typical ECG abnormality, whereas the term “WPW pattern” signifies an asymptomatic patient with typical ECG abnormalities [39]. WPW alters both depolarization and repolarization and can both mimic and obscure acute MI. In WPW with inferior Q-waves, the T-wave is usually upright (discordant). In WPW with inferior Q-waves, a concordant T-wave should raise suspicion for MI, either old or new40. Paroxysmal supraventricular tachycardia (PSVT) is the most common arrhythmia associated with WPW syndrome [32]. The underlying mechanism involves an accessory pathway, which enables the conduction of a depolarization wave from atria to ventricles bypassing the AV node and predisposes to arrhythmias and SCD35. WPW is commonly treated with radiofrequency catheter ablation (RFA) therapy, which has an 85% to 95% success rate of eliminating the abnormal pathway [41].
B. Hyperventilation syndrome (HVS): Hyperventilation syndrome (HVS) is defined as a breathing pattern above metabolic need [42]. Acute or chronic anxiety is usually considered the predominant primary causal factor of the HVS [43]. Acute hyperventilation is an adaptive response preparing for fight or flight [44]. HSV is anxiety-related dyspnea and tachypnea often accompanied by systemic symptoms [45]. It is sometimes precipitated by emotionally stressful events [45]. Whether or not an original cause is identified, there is usually a trigger, often stress-related, which the patient may identify as setting off an acute episode. The incidence of the HVS probably varies from 6-11% [43]. HVS most commonly occurs among young women but can affect either sex at any age [45]. Probably less than 4% have only an organic process as the cause and approximately 65% have only a psychogenic basis as the cause [43]. The symptoms and signs associated with the HVS are many and varied. The signs and symptoms of the HVS are indistinguishable from those of anxiety [43]. Acute coronary syndrome (ACS) and APE are two of the most common serious entities that may present similarly to HVS [46]. ECG changes during HVS are common and may include the following: ST depression or elevation, prolonged QT interval, T-wave inversion, and sinus tachycardia [43,46].
C. Both right and left bundle branch blocks: Both right and left bundle branch blocks are accompanied by ST-segment and T-wave changes [22]. Left bundle branch block (LBBB) produces T-wave inversion in the lateral leads I, aVL and V5-6 [20,22,23]. The LBBB innately causes T-wave to deflect in the opposite of the major deflection of the QRS-complex [23]. The right bundle branch block (RBBB) produces T-wave inversion in the right precordial leads V1-3 [20,22,23].
D. Left Ventricular Hypertrophy (LVH): This results in increased R-wave voltage in the left-sided leads (I, aVL and V4-6) and increased S-wave depth in the right-sided leads (III, aVR, V1-3). The thickened LV wall leads to prolonged depolarization (increased R-wave peak time) and delayed repolarization (ST-segment and T-wave deviations) in the lateral leads [47]. There are many sets of criteria used to diagnose LVH via electrocardiography. None of them are perfect, though by using multiple criteria sets, the sensitivity and specificity are increased. The Sokolow-Lyon index [48,49]:
a) S in V1 + R in V5 or V6 (whichever is larger) ≥ 35 mm (≥ 7 large squares)
b) R in aVL ≥ 11 mm
The Cornell voltage criteria50 for the ECG diagnosis of LVH involve measurement of the sum of the R wave in lead aVL and the S wave in lead V3. The Cornell criteria for LVH are:
a) S in V3 + R in aVL > 28 mm (men)
b) S in V3 + R in aVL > 20 mm (women)
E. Cerebrovascular accidents:
Diffuse, deep, symmetrically inverted T-waves may be seen in a severe central nervous system (CNS) trauma or pathology. These are called cerebral T-waves. Diseases accompanied by cerebral T-waves are ischemic stroke, intracranial bleed, and traumatic brain injury (TBI) [51].F. Ischemic heart disease (IHD): Inverted T-waves are accompanied by ischemic heart disease. The T-wave inversion is not specific for IHD, and the inversion itself does not correlate with a specific prognosis. However, if the clinical history is suggestive of IHD in the setting of inverted T-waves, this is correlative [51]. Wellens’ syndrome is a pattern of biphasic T-waves in V2-3. It is generally present in patients with ischemic chest pain.
a) Type 1: T-waves are symmetrically and deeply inverted
b) Type 2: T-waves are biphasic with negative terminal deflection and positive initial deflection [22]
Wellens’ syndrome is caused by the injury or obstruction of the left anterior descending (LAD) artery, therefore resulting in symmetrical T-wave inversions from V2-V4 with depth more than 5 mm in 75% of the cases. Meanwhile, the remaining 25% of the cases show biphasic T-wave morphology. ST-segments remains neutral in this syndrome. Those who were treated without angiography will develop anterior wall MI in a mean period of 9 days [21]. An episode of chest pain in Wellens’ syndrome is associated with ST-segment elevation or depression and later progressed to T-wave abnormality after chest pain subsided. T-wave inversion less than 5 mm may still represent IHD but is less severe than Wellens’ syndrome [22]. Wellen’s syndrome is symmetrically inverted T-waves in anterior precordial leads; these T waves suggest a severe narrowing of the LAD artery at a proximal location. Recognition of this condition is vital to prevent a large anterior STEMI52. However, Wellens signs can be seen in various other pathologies such as pulmonary disease, so the appropriate clinical correlation is imperative [23].
G. Electrolyte abnormalities: Electrolyte abnormalities cause diffuse changes in the T-wave morphology throughout the ECG rather than specific to a coronary artery distribution [23]. Hyperkalemia is a condition that can cause peaked T-waves. Depending on the degree of hyperkalemia, the peaked T-waves may range from a low amplitude to tall peaks to a sinusoidal pattern on ECG. The mechanism of the T-wave morphologies is through inhibition of the positively charged extracellular K+ on the repolarization of the myocardium. In initial ECG changes in hyperkalemia, the T-waves become narrow, pointed and tall; these changes will be seen in all leads on the ECG. As the hyperkalemia progresses other ECG abnormalities may occur: decreased P-wave height, a widened QRS-compex, PR-interval prolongation and eventually the ECG may become sinusoidal [51,53].
H. Pulmonary embolism: In pulmonary embolism, T-wave can be symmetrically inverted at V1- V4 leads but sinus tachycardia is usually the more common sign. T-wave inversion only occurs in 19% of mild APE, but the T-wave inversion can be present in 85% of the cases in severe APE. Also, T-wave inversion can also occur in III and aVF leads [22].
Methods of study and patients
My study was an observational-retrospective study for 24- case report series of tachypnea with electrocardiographic (ECG) T-wave changes. These T-wave changes were either among both I and II lead with aVL and aVF leads or between aVL and aVF leads or between V1 and V2 leads. The changes in the depth of T-wave in these leads include both T-wave inversion in I, aVL, and V1 leads and in the amplitude of an upright T-wave in II, aVF, and V2 leads. The new sign “Connected aircraft squadron electrocardiographic Sign (Yasser sign)” is a constellation of the T- waves changes in the above leads in tachypneic patients. The changes by increasing or decreasing in either T-wave inversion or the amplitude of an upright T-wave in the above specific leads with breathing rate changes are the base of the current new sign. The author reported the 24-cases of thorough nearly 4 years, started from December 24, 2015, and, ended on November 30, 2019. The study was conducted in the Intensive Care Unit (ICU) at Fraskour Central Hospital and Physician Outpatient Clinic (POC) (Table 2).
The cases were divided into three groups:
a) The first group (type I): it comprises only eighteen patients of investigated tachypnea with T-wave changes among both I and II leads, and with aVL and aVF leads.
b) The second group (type II): it comprises four patients of tachypnea with T-wave changes only between aVL and aVF leads.
c) The third group (type III): it comprises two patients of tachypnea with T-wave changes only between V1 and V2 leads.
Serial ECG tracings were initially examined in the tachypneic patients with T-wave changes for the new sign; “Connected aircraft squadron electrocardiographic Sign (Yasser sign)” (Figure 1). All groups were undergone to complete clinical examination (Table 3) and serial ECG tracings doing during variant times of tachypnea. Specific investigations were worked in each group of the study (Table 4). Serial ECG tracings, blood electrolytes (ionized calcium, sodium, potassium, and magnesium), complete blood counts, and random blood sugar were done for all cases. Arterial blood gases, troponin test, d-dimmer, CPK-MB, echocardiography, helical thoracic computed tomography (TCT), and chest X-ray (CXR) were done in selected patients. Most of the cases were admitted to the ICU. Few cases were managed as clinic outpatients in POC with later follow up. For more details on general, clinical, and laboratory data for the cases see (Table 3 and 4).
Figure 1: Showing ECG tracing before (A) and after discoloration (B) of the typical configuration of “Connected aircraft squadron electrocardiographic Sign (Yasser sign)”; the body (purple arrows) wings (red arrows), and interlacing distance space (lime arrows).
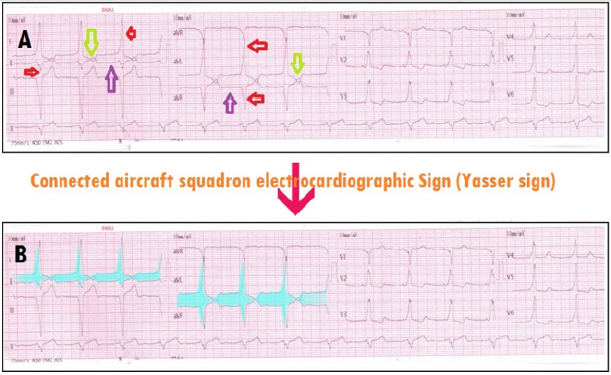
Table 3: Showing a summary of the history, clinical, and management data for the study cases.

AF: atrial fibrillation, APE: acute pulmonary embolism, BP; blood pressure, CVA: cerebrovascular accidents, Echo: echocardiography, ECG; electrocardiography, F; female, HTN: hypertension, HVS; hyperventilation syndrome, IHD: ischemic heart disease, IPF: idiopathic pulmonary fibrosis K+; potassium, LBBB: left bundle branch block ,LVH: left ventricular hypertrophy, Mg++; magnesium, M; male, MI: myocardial infarction, Na+; sodium, NSTEMI: non-ST-elevation myocardial infarction, P. Pacing: permanent pacing, RF; risk factor, RR; respiratory rate, Temp: temperature, TIA: transient ischemic attack, WPW syndrome: Wolff-Parkinson White syndrome.
Table 4: Showing laboratory data for the cases of study.

ABG; arterial blood gases, AF: atrial fibrillation, Ca++; calcium, CHF; congestive heart failure, CVA; cerebrovascular accident, CTR: cardiothoracic ratio, CXR: chest x-ray, DCM: dilated cardiomyopathy, DKA; diabetic ketoacidosis; diagnosis, HR; heart rate, HVS; hyperventilation syndrome, IHD: ischemic heart disease, K+; potassium, LBBB: left bundle branch block, LVH: left ventricular hypertrophy, N: normal, Na+; sodium, NSTEMI: Non-ST-elevation myocardial infarction, Mg++; magnesium, MI: myocardial infarction, RR; respiratory rate, RA; respiratory alkalosis, RBS; random blood sugar, TCT: thoracic computed tomography, TIA: transient ischemic attack, WPW syndrome: Wolff-Parkinson-White syndrome.
A. Eligibility criteria:
a) Inclusion criteria: All cases with an electrocardiographic T-wave inversion in either I or aVL or V1 leads or combination of both I and aVL. Patient ages ranged from 27 and up to 90 years old.
b) Exclusion criteria:
1. Runs of ventricular tachycardia
2. Hyperacute T-wave in idioventricular rhythm.
c) Limitations of the study: There are some limitations to the study:
1. Cabrera ECG format which becomes historical remnants rather than multiple technical errors.
2. Non-posterior AP in WPW syndrome.
Cases presentation
Case No. 1: A 35-year-old married, housewife, Egyptian female, presented to the physician outpatient clinic (POC) with acute tachypnea of intermittent course. The previous symptoms had happened after familial psychological stress. Radiofrequency ablation in the heart had happened one year ago. The attacks of tachycardia remarkably diminished after ablation. Serial ECG tracings were taken at variant times of hyperventilation were taken; on starting of hyperventilation, on more pronounced hyperventilation, and recovery showed intermittent sign configuration with gap closure (Figure 2). The operator advised the patient to calm down, resting his breathing and managed him using a paper bag and O2 inhalation during the attack. The physician prescribed bromazepam1.5 mg tablet OD on sleep and Calcium carbonate 500 mg capsule OD for one week. For more details see (Table 3 and 4).
Case No. 2: A 90-year-old married, farmer, Egyptian male, presented to the POC with acute tachypnea of intermittent course. The patient had a history of chronic lung disease. Helical chest CT showed idiopathic pulmonary fibrosis. Serial ECG tracings were taken at variant times of hyperventilation, and on recovery showed intermittent sign configuration with gap closure (Figure 3). The patient was managed with O2 inhalation during the attack with immediate symptomatic relief. For more details see (Table 3 and 4).
Case No. 3: A 76-year-old married, housewife, Egyptian female, presented to the emergency room (ER) with acute tachypnea of progressive course, fatigue, and orthopnea. The patient admitted to the ICU as CHF, hypertensive crises, and angina. Echocardiography showed global hypokinesia and dilated cardiomyopathy. Serial ECG tracings showed gradual and progressive sign configuration. The patient referred for coronary angiography. Unfortunately, the patient died within 2-hours post-PTCA (Figure 4). For more details see (Table 3 and 4).
Case No. 4: A 62-year-old married, worker, Egyptian male, presented to the ER with acute tachypnea of fixed course, fatigue and orthopnea. Echocardiography showed global hypokinesia and dilated cardiomyopathy. Serial ECG tracings showed a fixed sign configuration without gap closure. (Figure 5). The patient was managed in ICU as CHF. For more details see (Table 3 and 4).
Case No. 5: A 27-year-old married, housewife, Egyptian female, presented as a full-term pregnant into obstetrician ward. The patient was consulted for CS preoperative preparation. Intermittent tachypnea was recorded. Echocardiography showed no abnormality. Initial ECG accidentally showed WPW syndrome. Serial ECG tracings showed intermittent sign configuration without gap closure. (Figure 6). The patient was managed in ICU only for postoperative follow up. For more details see (Table 3 and 4).
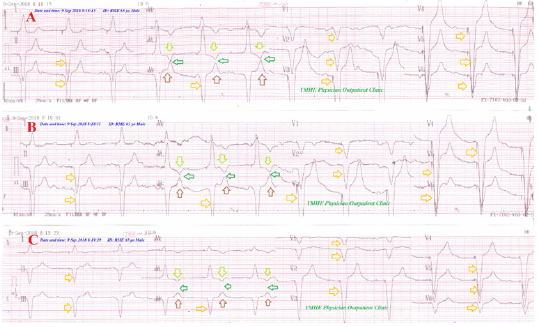
Case No. 6: A 65-year-old married, Blacksmith worker, Egyptian male, presented to the ER with acute tachypnea of regressive course and headache. The patient was managed in ICU as a hypertensive crisis with intravenous nitroglycerin infusion (7.5 μg/min with intermittent titration) was given. Later echocardiography showed left ventricular hypertrophy (LVH) with normal EF of 63%. Serial ECG tracings showed regressive sign configuration without gap closure (Figure 7). For more details see (Table 3 and 4).
Case No. 7: A 55-year-old married, housewife, Egyptian female, presented to the emergency room (ER) with acute tachypnea of progressive course, fatigue, and orthopnea. The patient admitted to the ICU as CHF, hypertensive crises, and angina. Echocardiography showed global hypokinesia and dilated cardiomyopathy. Serial ECG tracings showed gradual and progressive the sign configuration without gap closure The patient was managed in ICU as CHF. For more details see (Table 3 and 4).
Figure 2: Serial ECG tracings showing type I connect with the intermittent change of the gap distance among inverted T-wave in I and aVL leads and an upright T-wave in II and aVF leads. A. tracing: During initial hyperventilation with RR of 30 bpm showing inverted T-wave in I and aVL leads (lime arrows), ST-segment elevation in II,III, and aVF leads (brown arrows), with gap distance showing no contact among the inverted T-waves of I and aVL leads with an upright T in II and aVF leads (blue arrows). ECG also showing: LAD, limb leads voltage criteria for LVH with, false pathological Q in II, III, and aVF leads (pseudo-infarction pattern), non-voltage criteria in pericardial leads with increased peak time more than 120 msec. in V5, V6 leads, U-wave in V2-4, short PR-interval (purple arrows), wide-QRS complex (grey rode), delta wave (orange arrows),; positive in V1-6 (WPW Type B). B. tracing: During pronounced hyperventilation with RR 42 bpm showing similar A. tracing but with just contact among the inverted T-waves of leads I and aVL with an upright T in leads II and aVF giving Connected Aircraft Squadron Electrocardiographic Sign (Yasser Sign) (green arrows). C. tracing: on more pronounced hyperventilation with RR of 55bpm showing similar B. tracing but with gap distance is with the appearance of like “ ◊ ” interlacing area as a tail of airplane between T-wave in lead I to an upright T wave in lead II and inverted aVL to an upright T wave in aVF leads (yellow arrows). D. tracing: One hour after hyperventilation recovery showing a more wide gap distance with no contact among the previous waves and leads. Blue arrows indicate the presence of gap distance with no contact among the inverted T-waves of I and aVL leads with an upright T in II and aVF leads. Green arrows indicate just the presence of contact without interlacing between inverted and upright T-wave. Yellow arrows indicate the existence of interlacing area between inverted T and an upright T-wave indicates more severe hyperventilation to give like “ ◊ ” interlacing area as a tail of the airplane. Rose arrows indicate wings of Aircraft Squadron. Red arrows indicate bodies of Aircraft Squadron.
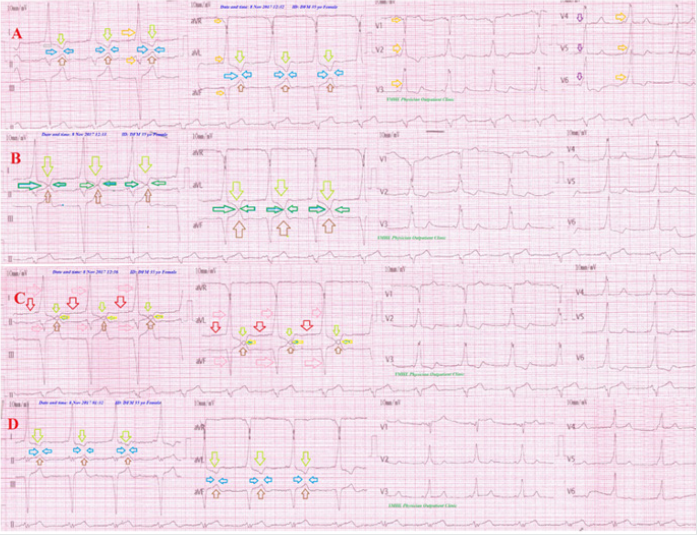
Figure 3: Serial ECG tracings showing type I connect with the intermittent change of the gap distance among inverted T-wave in I and aVL leads and an upright T-wave in II and aVF leads. A. tracing: on tachypnea with RR of 38 bpm showing inverted T-wave in I and aVL leads (lime arrows), ST-segment elevation in II, III, and aVF leads (brown arrows) showing interlacing area between inverted T-waves of I and aVL leads with upright T in II and aVF leads (green arrows). ECG also showing: LAD, criteria for BVH. B. tracing: on tachypnea with RR of 40 bpm showing similar A. tracing but with just contact among the inverted T-waves of I and aVL leads with an upright T in II and aVF leads giving Connected Aircraft Squadron Electrocardiographic Sign (Yasser Sign) (green arrows). C. tracing: on more pronounced tachypnea with RR of 52 bpm showing similar B. tracing but with gap distance is with appearance of like “ ◊ ” interlacing area as a tail of airplane between T-wave in lead I to upright T wave in lead II and inverted aVL to upright T wave in aVF leads (green arrows). D. tracing: on tachypnea of RR of 40 bpm showing more wide gap distance with contact among the previous waves leads and with more appearance of like “ ◊ ” interlacing area. E. tracing: on marked tachypnea with RR of 58 bpm showing similar D. tracing but with more appearance of like “ ◊ ” interlacing area and more smaller body (red arrows). Rose arrows indicate wings of Aircraft Squadron. Red arrows indicate bodies of Aircraft Squadron. Orange and purple arrows in V1-6 leads indicate the presence of a wavy triple sign (Yasser sign) of hypocalcemia.
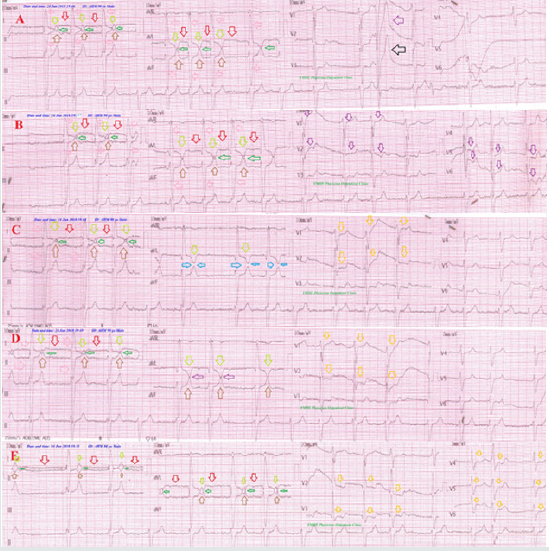
Figure 4: Serial ECG tracings showing type I connect with progressive and gradual decreasing of the gap distance among inverted T-wave in I and aVL leads and an upright T-wave in II and aVF leads (green arrows) with changeable RR from A. tracing to D. tracing. There is evidence of old MI (II, III, aVF, and V1-6).
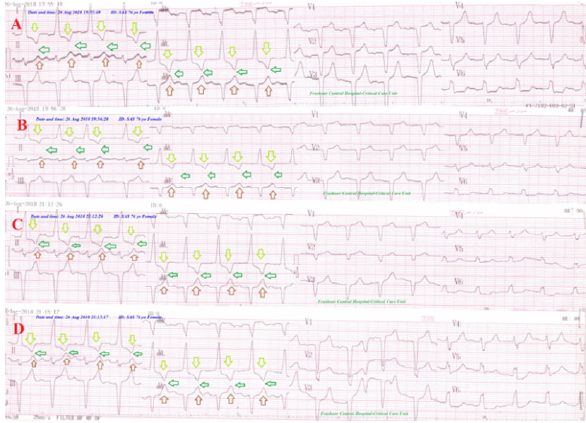
Figure 5: Serial ECG tracings showing type I connect with fixed gap distance among inverted T-wave in I and aVL leads and an upright T-wave in II and aVF leads (green arrows) with nearly fixed RR from A. tracing to D. tracing. There are RBBB, IHD, evidence of old MI (V3-6), and several PVCs (orange arrows).
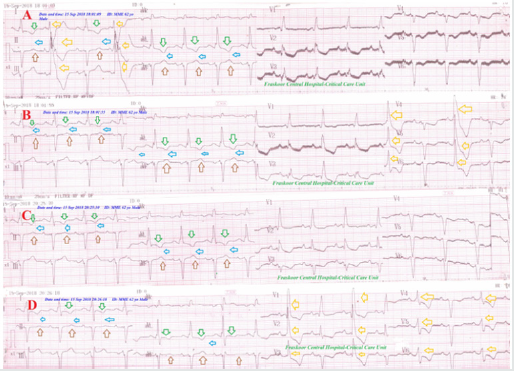
Figure 6: Serial ECG tracings showing WPW syndrome (red arrows and road) in type II connect with regressive gap distance among inverted T-wave in aVL leads and an upright T-wave in aVF lead (green arrows) with decreasing the RR from A. tracing to D. tracing. There is Wavy triple (Yasser sign) in V3 of C. tracing indicating the presence of hypocalcemia (blue arrows).
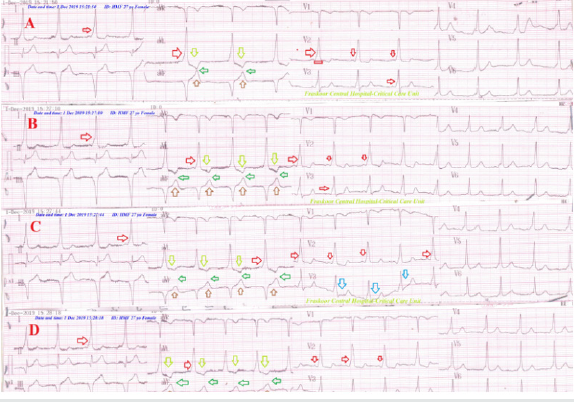
Figure 7: Serial ECG tracings showing old extensive anterior and inferior MI (gold arrows) with LBBB in type II connect with regressive gap distance among inverted T-wave in aVL leads and an upright T-wave in aVF lead (green arrows) with decreasing the RR from A. tracing to D. tracing. There is evidence of old MI (golden arrows).
Case No. 8: A 72-year-old married, worker, Egyptian male, presented to the ER with acute tachypnea of progressive course, fatigue, and orthopnea. The patient admitted to the ICU as CHF, hypertensive crises, and angina. Echocardiography showed global hypokinesia and dilated cardiomyopathy. Serial ECG tracings showed progressive sign configuration without gap closure The patient was managed in ICU as CHF. For more details see (Table 3 and 4).
Case No. 9: A 60-year-old married, teacher, Egyptian female, presented to the ER with acute tachypnea of fixed course, orthopnea, and headache. The patient admitted to the ICU as CHF and hypertensive crises. Echocardiography showed global hypokinesia and dilated cardiomyopathy. Serial ECG tracings fixed sign configuration without gap closure. The patient was managed in ICU as CHF with hypertensive crises. For more details see (Table 3 and 4).
Case No. 10: A 75-year-old married, housewife, Egyptian female, presented to the ER with acute tachypnea of fixed course and orthopnea. The patient admitted to the ICU as CHF and AF. Echocardiography showed global hypokinesia and dilated cardiomyopathy. Serial ECG tracings were taken showed fixed sign configuration without gap closure. The patient was managed in ICU as CHF and AF. For more details see (Table 3 and 4).
Case No. 11: A 75-year-old married, housewife, Egyptian female, presented to the ER with acute tachypnea of fixed course and dizziness. The patient was acute hemiplegic. Hemiplegia was spontaneously relieved. Urgent brain CT was normal. Brain CT was repeated within 48 hours with no further abnormalities. The patient admitted to the ICU as a cerebrovascular accident (CVA). Echocardiography showed inferior hypokinesia. Serial ECG tracings were taken showed fixed sign configuration without gap closure The patient was managed in ICU as a transient ischemic attack (TIA). For more details see (Table 3 and 4).
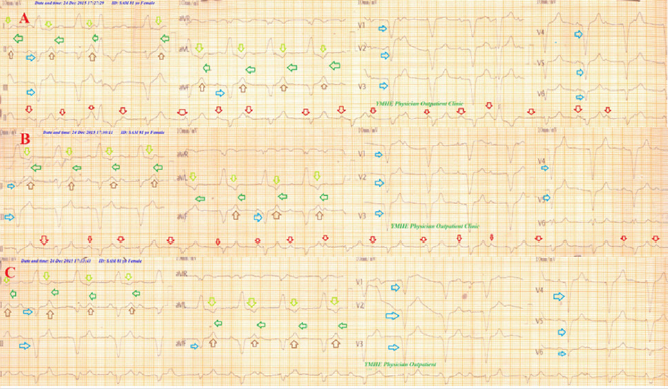
Case No. 12: A 56-year-old married, carpenter, Egyptian male, presented to the ER with acute tachypnea of progressive course, orthopnea, and headache. The patient admitted to the ICU as CHF and hypertensive crises. Echocardiography showed global hypokinesia and dilated cardiomyopathy. Serial ECG tracings gradual and progressive sign configuration without gap closure (Figure 8). The patient was managed in ICU as CHF with hypertensive crises. For more details see (Table 3 and 4).
Case No. 13: A 48-year-old married, housewife, Egyptian female, presented to the ER with acute tachypnea of fixed course, orthopnea, and headache. The patient admitted to the ICU as CHF and hypertension. Echocardiography showed left ventricular hypertrophy. Serial ECG tracings fixed sign configuration without gap closure. The patient was managed in ICU as CHF with hypertension. For more details see (Table 3 and 4).
Case No. 14: A 90-year-old married, farmer, Egyptian male, presented to the ER with acute tachypnea of fixed course and headache. The patient admitted to the ICU as NSTEMI and hypertension. Echocardiography showed left ventricular hypertrophy. Serial ECG tracings fixed sign configuration without gap closure. The patient was managed in ICU as NSTEMI and hypertension. For more details see (Table 3 and 4).
Case No. 15: A 60-year-old married, housewife, Egyptian female, presented to the ER with acute tachypnea of progressive course and chest pain. The patient admitted to the ICU as LBBB and chest pain. Echocardiography showed left ventricular hypertrophy. Serial ECG tracings gradual and progressive sign configuration without gap closure. The patient was managed in ICU as LBBB with chest pain. For more details see (Table 3 and 4).
Case No. 16: A 90-year-old married, housewife, Egyptian female, presented to the ER with acute tachypnea of regressive course and chest pain. The patient admitted to the ICU as as LBBB with chest pain, AF, and hypertensive crises. Echocardiography showed left ventricular hypertrophy with hypokinesia. Serial ECG tracings regressive sign configuration without gap closure. The patient was managed in ICU as LBBB with chest pain, AF, and hypertensive crises. For more details see (Table 3 and 4).
Case No. 17: A 81-year-old married, housewife, Egyptian female, presented to the POC with acute tachypnea of fixed course and mild dizziness. Echocardiography showed left ventricular hypertrophy with hypokinesia. Serial ECG tracings fixed sign configuration without gap closure (Figure 9). The patient was managed conservatively as LBBB with Mobitz I. For more details sees (Table 3 and 4).
Figure 8: Serial ECG tracings showing LBBB in type I connect with progressive gap distance among inverted T-wave in aVL leads and an upright T-wave in aVF lead (green arrows) with decreasing the RR from A. tracing to D. tracing.
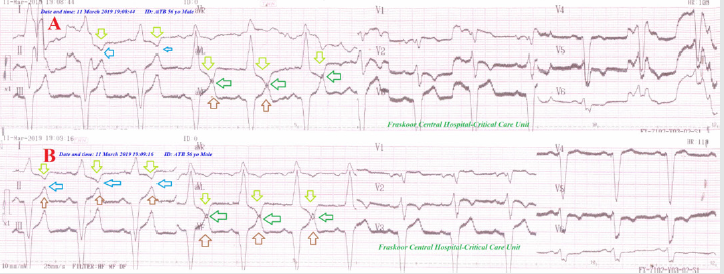
Figure 9: Serial ECG tracings showing LBBB with Mobitz I HB (Wenchbach phenomenon) (red arrows) after permanent pacing for CHB. They are showing type I connect with fixed gap distance among inverted T-wave in I and aVL leads and an upright T-wave in II and aVF leads (green arrows) with nearly fixed RR from A. tracing to D. tracing. There are old extensive anterior and inferior MI (blue arrows).
Case No. 18: A 68-year-old married, housewife, Egyptian female, presented to the ER with acute tachypnea of regressive course and chest pain. The patient admitted to the ICU as acute STEMI and hypertension. Echocardiography showed inferior hypokinesia. Serial ECG tracings regressive sign configuration with gap closure. The patient was managed in ICU as an acute STEMI and hypertension. For more details see (Table 3 and 4).
Case No. 19: A 65-year-old married, housewife, Egyptian female, presented to the ER with acute tachypnea of fixed course and chest pain. The patient admitted to the ICU as LBBB and chest pain. Echocardiography showed left ventricular hypertrophy and hypokinesia. Serial ECG tracings fixed sign configuration without gap closure. The patient was managed in ICU as LBBB with chest pain. For more details see (Table 3 and 4).
Case No. 20: A 49-year-old married, housewife, Egyptian female, presented to the ER with acute tachypnea of fixed course and chest pain. The patient admitted to the ICU as AF with chest pain and hypertension. Echocardiography showed left ventricular hypertrophy and hypokinesia. Serial ECG tracings fixed sign configuration without gap closure. The patient was managed in ICU as AF with chest pain and hypertension. For more details see (Table 3 and 4).
Case No. 21: A 61-year-old married, housewife, Egyptian female, presented to the ER with acute tachypnea of regressive course and chest pain. The patient admitted to the ICU as LBBB with chest pain and hypertension. Echocardiography showed left ventricular hypertrophy and hypokinesia. Serial ECG tracings regressive sign configuration without gap closure. The patient was managed in ICU as LBBB with chest pain and hypertension. For more details see (Table 3 and 4).
Case No. 22: A 70-year-old married, housewife, Egyptian female, presented to the ER with acute tachypnea of regressive course and chest pain. The patient admitted to the ICU as hypertensive crisis and chest pain. Echocardiography showed left ventricular hypertrophy and hypokinesia. Serial ECG tracings regressive sign configuration without gap closure. The patient was managed in ICU as AF with a hypertensive crisis and chest pain. For more details see (Table 3 and 4).
Case No. 23: A 33-year-old married, teacher, Egyptian (Table 3 and 4). Male presented to the POC with acute tachypnea of progressive course and chest pain. Serial ECG tracings progressive sign configuration with gap closure (Figure 10). Echocardiography showed no detected abnormalities. The patient was managed as hyperventilation syndrome. For more details see (Table 3 and 4).
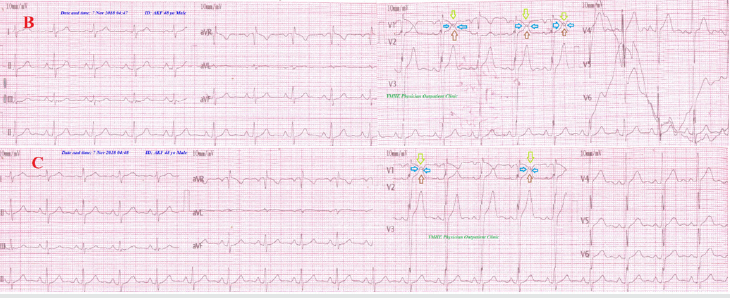
Case No. 24: A 48-year-old married, farmer, Egyptian male, presented to the POC for perioperative preparation with anxiety, acute tachypnea of progressive course and chest pain. Serial ECG tracings progressive sign configuration with gap closure (Figure 11). Echocardiography showed no detected abnormalities. The patient was managed as hyperventilation syndrome. For more details see (Table 3 and 4).
Figure 10: Serial ECG tracings showing type III connect with progressive gap distance among inverted T-wave in V1 lead and an upright T-wave in V2 lead (black arrows) with increasing the RR from A. tracing to B. tracing.
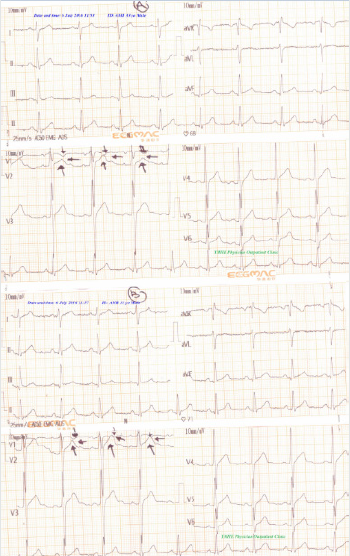
Figure 11: Serial ECG tracings showing type III connect with progressive gap distance among inverted T-wave in V1 lead and an upright T-wave in V2 lead (black arrows) with increasing the RR from A. tracing to B. tracing.
Results, Findings, and Discussion
A. Age in the study: The range of age in the study was 24-90 years with (mean: 63, median: 63.5, and mode: 90) (Table 3). The range of age in group I was 24-90 years. The range of age in group II was 48-76 years, and in group III was 33-48 years.
B. Sex: Predominant female sex was cleared. The percent of sex for female vs. male was 62.5% vs. 37.5% (15 vs. 9). The percent of sex in group I for female vs. male was 68.42% vs. 31.58% (13 vs. 6), and in group II was 66.67 % vs.33.33% (2 vs. 1), and male predominant in group III was 100% vs.0% (2 vs. 0) (Table 3).
C. The average for respiratory rate (bpm): (Range 20-55, Mean 31.625, Median 30, and Mode 26)
D. Oxygen saturation (pulse oximetry): (Range 86-99%, Mean 90.68%, Median 96%, and Mode 96%)
Conclusion and Recommendations
The sign description and interpretation:
a) The principles of “Connected Aircraft Squadron
Electrocardiographic or Yasser Sign” and their interpretations are depending on the following (Figure 1 and Table 6):
b) T wave inversion in I or aVL or V1 leads.
c) Upright T wave in II or aVF or V2 leads.
d) More deepen T-wave inversion in I or aVL or V1 leads during tachypnea or hyperventilation by repolarization abnormalities.
e) More pronounced T-wave in II, aVF leads by WPW syndrome pseudonormalization of T-waves.
f) Approximation of both inverted T-wave in lead I to an upright T-wave in lead II and inverted aVL to an upright T-wave in aVF leads or inverted T-wave in V1 lead with an upright T-wave in V2 lead.
g) The gap distance between the deepest point in inverted T-wave in I or aVL or V1 leads and the top point in an upright T wave in II or aVF or V2 leads are depending on the degree of tachypnea or hyperventilation which clinically assessed with respiratory rate.
h) The gap distance is showing no contact among the previous waves and leads after resolving the hyperventilation.
i) Just presence of contact without interlacing between inverted and an upright T-wave indicates the presence of tachypnea or hyperventilation.
j) An existence of interlacing area between inverted T and an upright T-wave indicates more severe tachypnea or hyperventilation to give like “ ◊ ” interlacing area as a tail of the airplane.
k) Positive voltage criteria in limb leads in some above cases: R wave in lead I + S wave in lead III > 25 mm, R wave in aVL > 11 mm, and S wave in aVR > 14 mm and false pathological Q in II and aVF leads giving wings of the airplanes.
l) T-wave alternans (or repolarization alternans) is rarely seen on ECG, and is defined as periodic beat to beat variation in the timing should be considered during sign interpretation.
m) The sum of previous points is the “Connected Aircraft Squadron Electrocardiographic or Yasser Sign” (Figure 1).
Morphologically, there four degrees for the sign were reported:
a) First degree: Presence of sign configuration (shared)
b) Second degree: Presence of approximation between the target inverted and an upright T-wave.
c) Third degree: Presence of connecting the target inverted and an upright T-wave
d) Fourth degree: Presence of gap interlacing both the target inverted and an upright T-wave (Figure 13, Table 6)
Depending on the type of connect between inverted and an upright T-waves for the affected leads, the sign can be divided into:
a) Type I: Presence of connecting among both I and II leads with aVL and aVF leads.
b) Type II: Presence of connecting between aVL and aVF leads.
c) Type III Presence of connecting between V1 and V2 leads (Figure 14)
Functionally, there four outcomes for the sign is base on the course of tachypnea:
a) Progressive: it means progressive approximation between the target inverted and an upright T-waves.
b) Progressive course indicates the presence of either progressive disease status or higher severity of the disease.
c) A regressive: it means regressive approximation between the target inverted and an upright T-waves.
d) Regressive course indicates the presence of either good therapeutic response or respiratory muscle fatigue.
e) Intermittent: it means intermittent approximation between the target inverted and an upright T-waves.
f) Intermittent course indicates fluctuation in the course of disease due to the presence of a precipitating factor.
g) A fixed: it means a fixed distance between the target inverted and an upright T-waves.
h) Fixed course indicates the presence of either stability in the course of the disease or severe respiratory muscle fatigue (Figure 15)
So, the sign can be classified into:
a) Incomplete sign: if it includes either a first or second degree.
b) Complete sign: if it includes either a third or fourth degree.
c) Lastly, the connected aircraft squadron electrocardiographic sign is a new strong index for monitoring and follow up the tachypneic patients with specific T- waves changes in special leads in several cardiorespiratory patients.
d) It is recommended to widen the research in this field.
Acknowledgment
The author wishes to thank Dr. Ameer Mekkawy; M.Sc. Ahmed Alghobary, B.sc. for technical support, and nurses of the Critical Care Unit and Emergency Department who make extra ECG copies for helping me
Conflicts of Interest
There are no conflicts of interest.
References
- Park SB, Khattar D (2019) Tachypnea.
- Berry J (2019) What to know about tachypnea.
- Prado PRD, Bettencourt ARC, Lopes JL (2019) Defining characteristics and related factors of the nursing diagnosis for ineffective breathing pattern. Rev Bras Enferm 72(1): 221-230.
- Martin EA (2019) Oxford concise medical dictionary. (6th ). Oxford University Press, USA pp: 333-334.
- Takayama A, Takeshima T, Nakashima Y, Yoshimizu T, Nagamine T (2019) A Comparison of Methods to Count Breathing Frequency. Respir Care 64(5): 555-563.
- Asmundsson AS, Arms J, Kaila R, Roback MG, Theiler C, et al. (2019) Hospital Course of Croup After Emergency Department Management. Hosp Pediatr 9(5):326-332.
- Kaser S, Sourij H, Clodi M, SchneeweibB, Laggner AN, et al. (2019) [Treatment of acute diabetic metabolic crises in adults: Hyperglycemic hyperosmolar state and ketoacidotic metabolic disorders]. Wien Klin Wochenschr 131(suppl 1): 196-199.
- Gallo De Moraes A, Surani S (2019) Effects of diabetic ketoacidosis in the respiratory system. World J Diabetes 10(1): 16-22.
- Leisman DE, Angel C, Schneider SM, D'Amore JA, D'Angelo JK, et al. (2019) Sepsis Presenting in Hospitals versus Emergency Departments: Demographic, Resuscitation, and Outcome Patterns in a Multicenter Retrospective Cohort. J Hosp Med 14(6): 340-348.
- Rea G, Sperandeo M, Serafino M Di, Vallone G, Tomà P (2019) Neonatal and pediatric thoracic ultrasonography. J Ultrasound 22(2):121-130.
- Nguyen PTK, Tran HT, Fitzgerald DA, Tran TS, Graham SM, et al. (2019) Characterization of children hospitalized with pneumonia in central Vietnam: A prospective study. Eur Respir 54(1):
- Kavurmacı Ö, Akçam Tİ, Kavurmacı SA, Turhan K, Çağırıcı U (2019) Pneumothorax: A Rare Entity During Pregnancy. Turk Thorac J 20(3): 206-208.
- Esquer GZ, George MP, Khalil S, Vijayvargiya P, Abu Saleh OM, Friedman PA, et al. (2019) Predictors of Bloodstream Infection in Patients Presenting With Cardiovascular Implantable Electronic Device Pocket Infection. Open Forum Infect Dis 6(4): ofz084.
- Dias Moreira AS, Grint K, Stepien R, Shaw G, Peek S (2019) Tricuspid valve dysplasia and a patent foramen ovale resulting in severe tricuspid regurgitation and right-heart dilation in a Red Angus calf. J Vet Cardiol 21: 28-33.
- Walsh BK, Croswell DN, Restrepo RD (2019) Capnography/Capnometry during mechanical ventilation: 2011. Respiratory Care 56(4): 503-509.
- Mc Evoy M (2013) How to Assess and Treat Acute Respiratory Distress. JEMS 8(38).
- Levis JT (2015) ECG Diagnosis: Hyperacute T Waves. Perm J 19(3): 1-79.
- Becker DE (2006) Fundamentals of electrocardiography interpretation. Ansett Prog 53(2): 53-63.
- Haarmark C, Graff C, Andersen MP, Hardahl T, Struijk JJ, et al. [2010] Reference values of electrocardiogram repolarization variables in a healthy population. Journal of Electrocardiology 43(1): 31-39.
- Burns Ed (2019) T wave.
- Qin W, Swee L, Teo G, Poh KK (2013) Electrocardiographic T wave abnormalities. Singapore Medical Journal 54(11): 606-610.
- Hanna EB, Glancy DL (2011) ST-segment depression and T-wave inversion: Classification, differential diagnosis, and caveats. Cleveland Clinic Journal of Medicine 78(6): 404-414.
- Kenny BJ, Brown KN (2019) ECG T Wave. Treasure Island (FL): Stat Pearls Publishing, USA.
- Hancock EW (1995) Normal ECG or peaked T waves? Hosp Pract 33(5): 19-20.
- Anantha subramaniam K, Karthikeyan V (2001) T wave alternans: An electrocardiographic sign of cardiac instability. Heart 85(4): 389.
- Smith JM, Clancy EA, Valeri CR (1998) Electrical alternans and cardiac electrical instability. Circulation 77(1):110-121.
- Rosenbaum DS, Jackson LE, Smith JM (1994) Electrical alternans and vulnerability to ventricular arrhythmias. N Engl J Med 330(4): 235-241.
- Kuo CS, Munakata K, Reddy CP, Surawicz B (1983) Characteristics and possible mechanism of ventricular arrhythmia dependent on the dispersion of action potential durations. Circulation 67(6):1356-1367.
- Narayan SM, Smith JM (1999) Spectral analysis of periodic fluctuations in electrocardiographic repolarization. IEEE Trans Biomed Eng 46(2):203-212.
- Habbab MA, el-Sherif N (1992) TU alternans, long QTU, and torsade de pointes: Clinical and experimental observations. Pacing Clin Electrophysiol 15(6): 916-931.
- Antaloczy Z (1979) Modern Electrocardiology. Amsterdam: Excerpta Medica pp. 401.
- Rahul S, Patel R (2007) Dewoolkar Anaesthetic management of WPW Syndrome. Internet J of A anesthesiology 11(2).
- Bhatia A, Sra J, Akhtar M (2015) Preexcitation Syndromes. Current Problems in Cardiology 41(3): 99-137.
- Knight BP (2019) Patient education: Wolff-Parkinson-White syndrome (Beyond the Basics).
- Eichlerová T, Knot J, Osmančík P (2018) Ventricular fibrillation as a primary manifestation of Wolff-Parkinson-White syndrome. Cor et Vasa 60(5): e456-e461.
- Kim SS, Knight BP (2017) Long term risk of Wolff-Parkinson-White pattern and syndrome. Trends in Cardiovascular Medicine 27 (4): 260-268.
- Al-Khatib SM, Pritchett EL (1999) Clinical features of Wolff- Parkinson-White syndrome. Am Heart J 138(3 Pt 1): 403-413.
- Wolff L, Parkinson J, White PD (2006) Bundle-branch block with short P-R interval in healthy young people prone to paroxysmal tachycardia. 1930. Annals of Noninvasive Electrocardiology: The Official Journal of the International Society for Holter and Noninvasive Electrocardiology 11(4):340-353.
- Surawicz B, Childers R, Deal BJ (2009) AHA/ACCF/HRS recommendations for the standardization and interpretation of the electrocardiogram: Part III: Intraventricular conduction disturbances. Circulation 119(10): e235-e240.
- Smith S (2012) WPW mimicking and obscuring acute MI. Dr. Smith's ECG Blog.
- Bengali R, Wellens HJ, Jiang Y (2014) Perioperative management of the Wolff-Parkinson-White syndrome. J Cardiothorac Vasc Anesth 28(5): 1375-1386.
- Gardner WN (1996) The pathophysiology of hyperventilation disorders. Chest 109(2): 516-534.
- Brashear RE (1983) Hyperventilation Syndrome. Lung 161(1): 257-273.
- Blackett G (2017) Does Over-breathing Or Hyperventilation Cause Sympathetic Nervous System Activation? StressResilientMind.co.uk. © Copyright Glyn Blackett.
- Lechtzin N (2016) Hyperventilation Syndrome.
- Kern B (2016) Hyperventilation Syndrome Workup. © 1994-2018 by WebMD LLC. Medscape.
- Burns Ed (2019) Left Ventricular Hypertrophy (LVH).
- Sokolow M, Lyon TP (1949) The ventricular complex in left ventricular hypertrophy as obtained by unipolar precordial and limb leads. Am Heart J 37(2): 161-186.
- Peter OM, Mary RJ, Richard DB, Thomas PG, Jeffrey BS, et al. (1998) Time-Voltage QRS Area of the 12-Lead Electrocardiogram: Detection of Left Ventricular Hypertrophy. Hypertension. 31 (4): 937-942.
- Casale PN, Devereux RB, Alonso DR, Campo E, Kligfield P (1987) Improved sex-specific criteria of left ventricular hypertrophy for clinical and computer interpretation of electrocardiograms: Validation with autopsy findings. Circulation 75 (3): 565-572.
- Somers MP, Brady WJ, Perron AD, Mattu A (2002) The prominent T-wave: Electrocardiographic differential diagnosis. Am J Emerg Med 20(3):243-251.
- Miner B, Hart EH (2019) Wellens Syndrome. Stat Pearls Publishing; Treasure Island, USA.
- Levis JT (2013) ECG diagnosis: Hyperkalemia. Perm J Winter 17(1): 69.

Top Editors
-

Mark E Smith
Bio chemistry
University of Texas Medical Branch, USA -

Lawrence A Presley
Department of Criminal Justice
Liberty University, USA -

Thomas W Miller
Department of Psychiatry
University of Kentucky, USA -

Gjumrakch Aliev
Department of Medicine
Gally International Biomedical Research & Consulting LLC, USA -

Christopher Bryant
Department of Urbanisation and Agricultural
Montreal university, USA -

Robert William Frare
Oral & Maxillofacial Pathology
New York University, USA -

Rudolph Modesto Navari
Gastroenterology and Hepatology
University of Alabama, UK -

Andrew Hague
Department of Medicine
Universities of Bradford, UK -

George Gregory Buttigieg
Maltese College of Obstetrics and Gynaecology, Europe -

Chen-Hsiung Yeh
Oncology
Circulogene Theranostics, England -
.png)
Emilio Bucio-Carrillo
Radiation Chemistry
National University of Mexico, USA -
.jpg)
Casey J Grenier
Analytical Chemistry
Wentworth Institute of Technology, USA -
Hany Atalah
Minimally Invasive Surgery
Mercer University school of Medicine, USA -

Abu-Hussein Muhamad
Pediatric Dentistry
University of Athens , Greece

The annual scholar awards from Lupine Publishers honor a selected number Read More...


