Lupine Publishers Group
Lupine Publishers
Menu
ISSN: 2637-4668
Research Article(ISSN: 2637-4668) 
Physico-Chemical Analysis and Modelling of Ground Water Quality Parameters Using Water Quality Index Method (WQI) and Principal Component Analysis (PCA) Volume 2 - Issue 2
Ilaboya IR* and Kayode Ojo N
- Department of Civil Engineering, University of Benin, Nigeria
Received: April 30, 2018; Published:May 11, 2018
Corresponding author: Ilaboya IR, Department of Civil Engineering, Faculty of Engineering, University of Benin, P.M.B 1154, Benin City, Edo State, Nigeria
DOI: 10.32474/TCEIA.2018.02.000134
Abstract
Groundwater is one of the major sources of water. It is affected by a number of natural and anthropogenic factors. As groundwater use has increased, issue associated with the quality of groundwater resources have likewise grown in importance. In this study, mathematical modelling technique for water quality index computation and multivariate statistical using Principal Component Analysis (PCA) were employed to evaluate and analyze the variability of ground water quality in parts of Benin City, Edo State, Nigeria. Various ground water quality parameters such as pH, turbidity, total suspended solids (TSS), Electrical Conductivity (EC), Total Dissolved Solids (TDS), Dissolved Oxygen (DO), phosphate, nitrate, sulphate, total solids (TS), sodium, potassium, calcium, magnesium, iron, lead, cadmium, zinc and chloride from twelve boreholes of known coordinates were investigated. Results of the computed water quality index indicate a latent variation in ground water quality of the study area. Although the index revealed an adequate ground water quality in the study area, a variation of 85.610% to 94.204% was observed. In addition, results of the principal component analysis (PCA) revealed that; phosphate, chloride and total dissolved solids are the three most important variables affecting the quality of the borehole water within the study area.
Keywords: Principal component analysis, Water quality index, Ground water, Electrical conductivity, Total dissolved solids
Abbrevations: PCA: Principal Component Analysis, WQI: Water Quality Index, GA: Ground Water, EC: Electrical Conductivity, TDS: Total Dissolved Solids, DO: Dissolved Oxygen, TSS: Total Suspended Solids
Introduction
Groundwater is one of the major sources of water. It is affected by a number of natural and anthropogenic factors. As groundwater use has increased, issue associated with the quality of groundwater resources have likewise grown in importance. For many years, attention has been directed at contamination from point sources. More recently, concerns have increased about nonpoint sources of contaminant and about the overall quality of groundwater resources Faisal [1]; Efe [2]; Oteze & Akujieze [3]. Contaminants in groundwater commonly result from infiltration containing agricultural fertilizers, pesticides, or contaminants from leaking tanks or pipes associated with industry Fryar [4], Debels [5]. Groundwater contamination can be detected by analyzing borehole water for a series of dissolved ion species. Hence water quality data sets typically contain many variables measured at several spatially scattered locations Ilaboya [6]. Water quality parameters which is used to assess the overall quality of ground water are usually adversely affected when untreated waste are discharge directly into water bodies Balakrishnan [7]. Apart from the fact that the pH will be totally altered, parameters such as chemical load, biological load, turbidity, conductivity, total dissolved solids, total suspended solids concentration of heavy metals and a host of other water quality parameters will also be affected. On account of these, it is recommended that monitoring programs be placed on ground that will constantly check and ensure that industries are located far away from water bodies in addition to monitoring the indiscriminate discharge of untreated waste into river and other water bodies Abdalkarim, et al. [8].
Identification of the critical factors affecting the overall quality of groundwater can be made possible through the use of nonparametric statistical techniques such as principal component analysis. In recent years many studies have been done using principal components analysis in the interpretation of water quality parameters. The application of different multivariate statistical techniques, such as cluster analysis (CA), principal component analysis (PCA) and factor analysis (FA) help to identify important components or factors accounting for most of the variation in the overall water quality Mazlum and Mazlum [9]. They are designed to reduce the number of variables to a small number of indices while attempting to preserve the relationships present in the original data. Iyer [10] constructed a statistical model which is based on PCA for coastal water quality data from the Cochin coast in south west India. The authors employed the model to explain the relationships between the various physicochemical variables that have been monitored and also to assess the effects of environmental conditions on the coastal water quality. Lohani [11] utilized principal components technique to provide a quick analytical method for the water quality of Chao Phraya river in Thailand. Also, Shihab [12] used this technique to describe the variation in water quality in Saddam dam reservoir and to reduce the number of water quality parameters needed for monitoring the lake water. In this study, water quality index model and principal component analysis were employed to study the variability in ground water quality from selected boreholes around Benin City.
Description of Study Area
The study area is Benin City in Nigeria. The city serves as the administrative and socio-economic center for both Oredo Local Government Area and Edo State in Nigeria. Benin City is a humid tropical urban settlement which comprises three Local Government Areas namely Egor, Ikpoba Okha and Oredo. It is located within latitudes 6020’N and 6058’N and longitudes 5035’E and 5041’E. It broadly occupies an area of approximately 112.552sq km. This extensive coverage suggests spatial variability of weather and climatic elements. Benin City lies visibly in the southern most corner of a dissected margin: a prominent topographical unit which lies north of the Niger Delta, west of the lower Niger Valley, and south of the Western Plains and Ranges Okhakhu [13]. The Benin City hydrological basin is partitioned into two main units. The first unit consists of the Ikpoba River Basin which drains the whole eastern part of the city while the second unit covers the Ogba River Basin which drains the western part. Although smaller rivers are found in some parts of the peripheral locations of the study area, in general, the hydrological basin clearly shows a north-south direction of flow owing to the high elevation of Nigeria from its northern part Okhakhu [13]. Fishing, irrigation, domestic consumption, industrial utilization, animal husbandry, recreation, environmental sanitation and research activities are some of the functions of rivers found in Benin City.
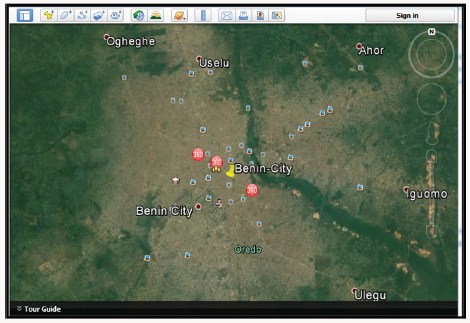
Rainfall, temperature, wind and relative humidity are the most significant climatic elements in Benin City. The rainfall element strongly determines the occurrence of the wet and dry seasons in the study area. As observed during the assessment of the urban troposphere using sensitive rain gauges of the American origin, the rainfall amount, its intensity, duration as well as its distribution throughout the city are determined by the prevailing maritime winds, changing clouds, temperatures and circulating pressures. Two principal air masses prevail in the City. These are the tropical maritime and tropical continental. The tropical maritime air mass which is essentially humid, warm, moisture-borne, and widely resident in Benin City for almost twelve months, originates from the South Atlantic Zone. It causes rainfall which begins from the late January till its gradual subsidence in mid-November. The arrival of rainfall in the study area brings welcome relief to the urban residents from the prevailing moderately dry and cold wind periods which normally occur between late December and the end of January Okhakhu [13]. Heavy rainfall and the associated floods occur frequently in Benin City and have caused huge economic losses as well as social problems. The Google earth map of Benin City is presented in Figure 1.
Research Methodology
Sample Collection/Conditioning
Water samples were collected randomly from twelve (12) boreholes within the study area. On the spot (in-situ) test such as pH, conductivity, total dissolved solids and dissolved oxygen was conducted immediately after sample collection. The water samples were then conditioned by storing them in clean dried sample bottles at room temperature before analysis. The need for conditioning was to allow the water to settle properly and give room for the microbial organisms to exhibit their full characteristics behaviour for ease of detection Ilaboya [6].
Physico-Chemical Analyses of Water Samples
The water samples were then subjected to full laboratory analysis in other to determine their physico-chemical properties that was used to compute the overall water quality index of the individual water samples. Some of the methods employed in the analysis are described below:
Turbidity Measurement: The amount of colloidal and residual suspended matter present in the water samples was determined using the Jenway 6035 Turbidimeter.
Hydrogen Ion Concentration (pH): The hydrogen ion concentration (pH) of the water samples was determined using a standard laboratory digital micro-processor pH meter; Hanna pH 210 model.
Dissolved Oxygen Content (DO): The dissolved oxygen content (DO) of the water samples was measured using a standard laboratory sized digital dissolved oxygen analyzer model: DO - 5509.
Conductivity Measurement: The conductivity of the water samples was determined using a digital water/sand quality test kit model SN2209
Total Dissolved Solids (TDS): The amount of total dissolved solids (tds) present in the different water samples was determined using a digital water/sand quality test kit model SN2209
Heavy Metal Determination: The concentration of heavy metals present in the different water samples was determined using Atomic Adsorption Spectrophotometer (AAS). (SOLAAR 969 UNICAM SERIES, using air acetylene flame).
Water Quality Index Modelling
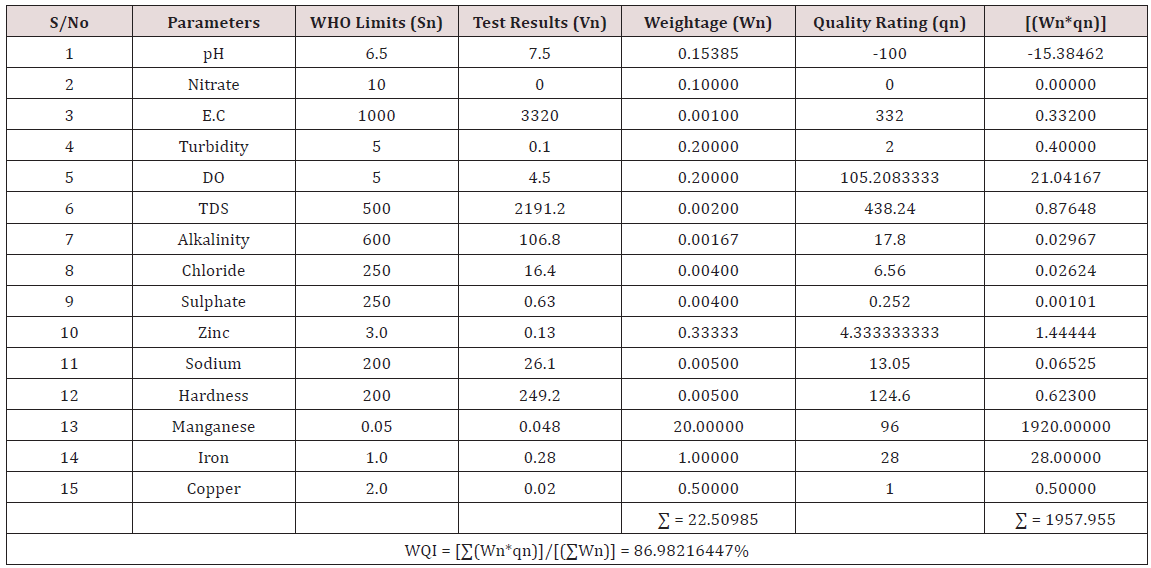
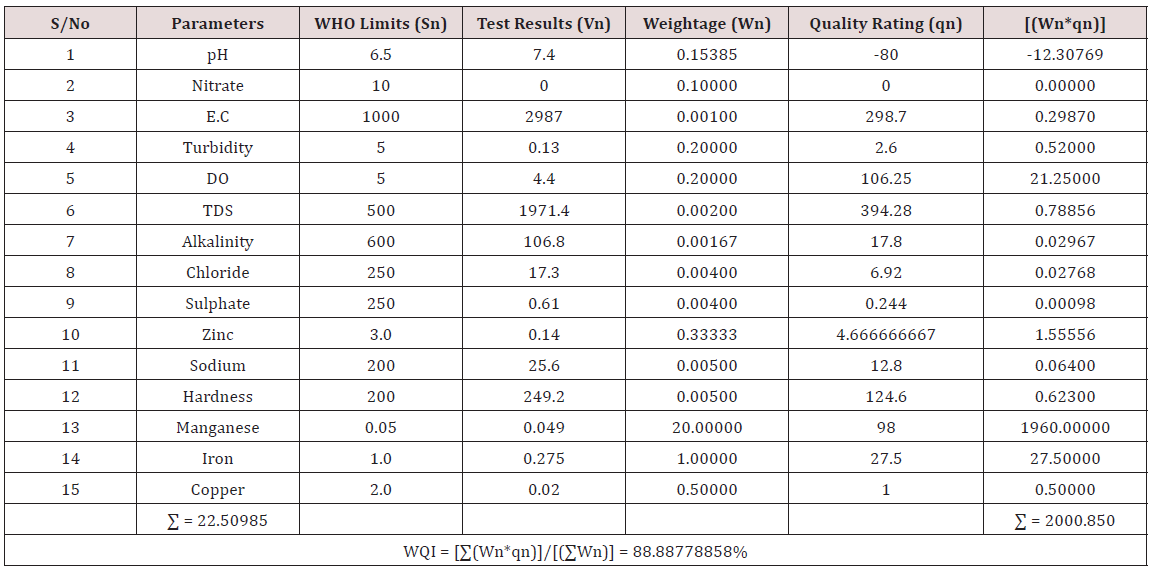
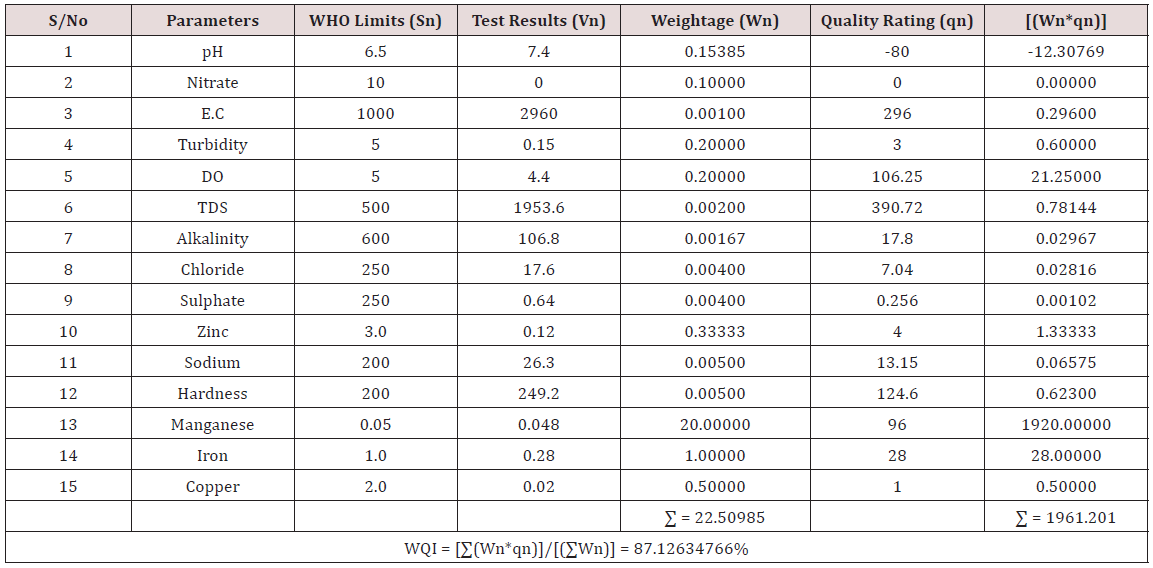
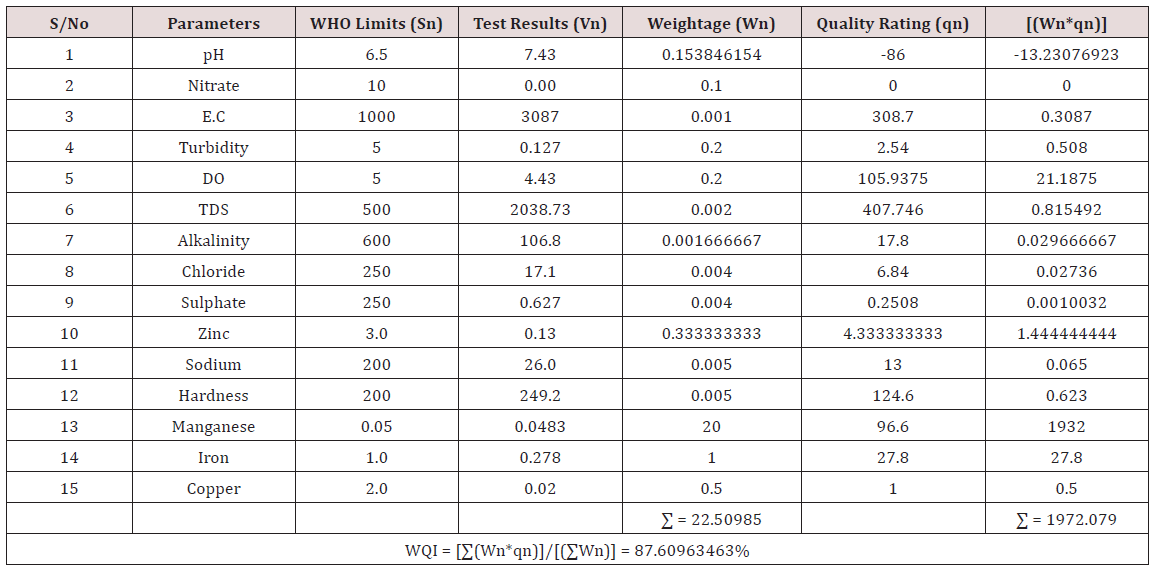
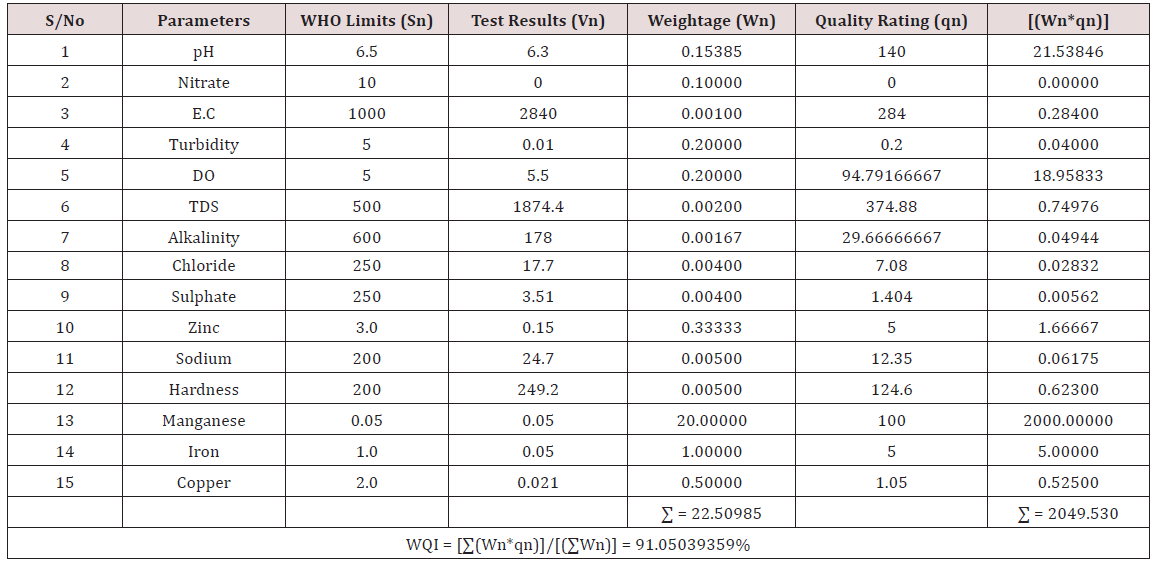
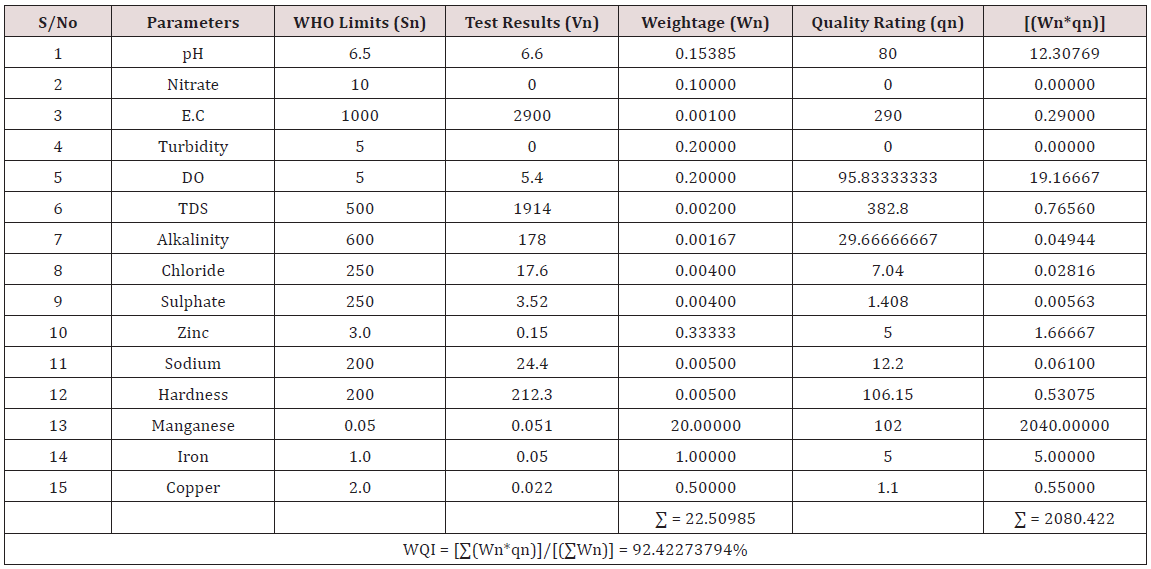
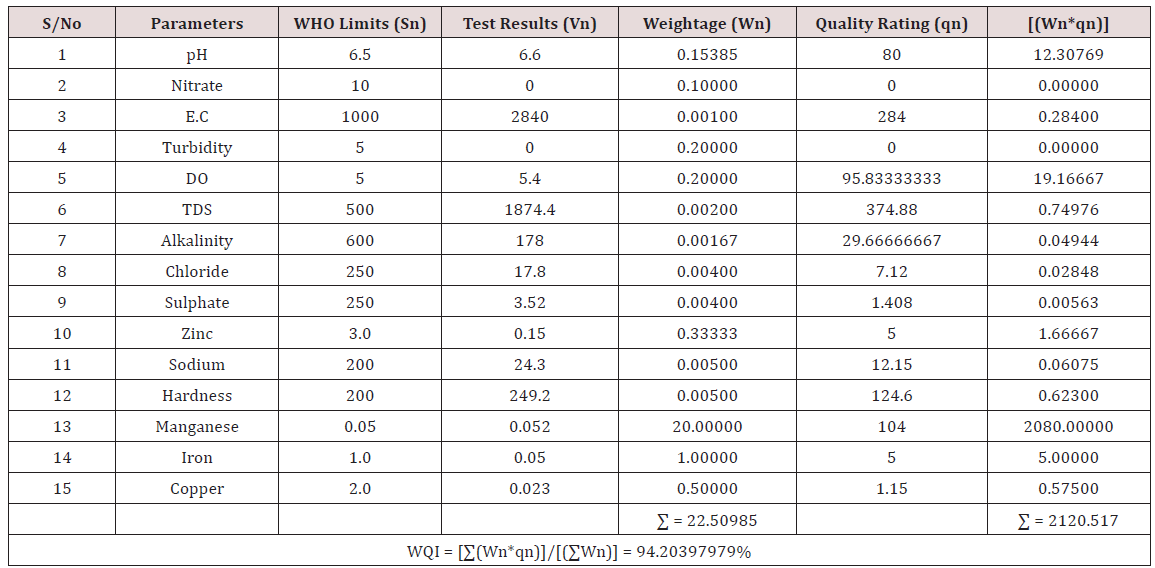
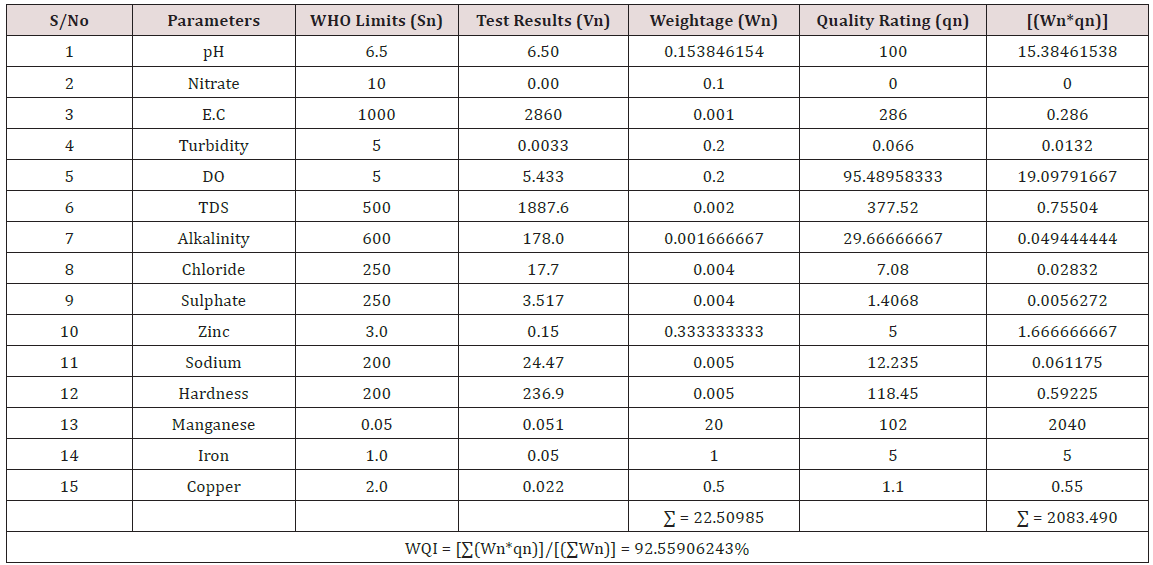
Water quality index was calculated for each of the sample water collected from different boreholes for assessing the variation of the overall quality of the water sample at each specific borehole location. The water quality index modelling was done by considering about fifteen (15) important physico-chemical parameters. The selected physico-chemical parameters include; pH, Nitrate, Electrical conductivity (EC), turbidity, Dissolved Oxygen (DO), Total Dissolved Solids (TDS), alkalinity, chloride, sulphate, Zinc, sodium, Carbonate Hardness, manganese, iron and copper. The basic steps involved in the modeling of water quality index are as follows:
Parameter Weightage Determination: For water quality index calculation, we first have to know the Weightage of each of the parameters identified. Parameters which have higher permissible limits are less harmful because they cannot significantly change the quality of the water sample even when they are present in high concentration. Weightage of tested parameters have an inverse relationship with its permissible limits. Therefore
Wn=1/sn (3.1)
Where;
Wn = Unit weight of the different parameters tested
Sn = Standard values of selected parameters (WHO Standard Permissible Limit)
Quality Rating or Sub Index of Selected Parameters: Rating scale was prepared for range of values of each parameter. The rating varies from 0 to 100 and is divided into five intervals. The rating qn = 0 implies that the parameter present in water exceeds the standard maximum permissible limits and water is severely polluted. On the other hand qn = 100 implies that the parameter present in water has the most desirable value. This scale is the modified version of rating scale given by Tiwari and Mishra (1985) and is calculated as follows:
qn=100(Vn-Vio)/(Sn-Vio) (3.2)
Where:
qn = Quality rating or sub index
Vn = Laboratory test result for each parameter tested
Sn = Standard value of each parameter tested (WHO standard for drinking water)
Vio = ideal value of selected parameters tested (in pure water Vio = 0 for all parameters tested except pH and dissolved oxygen which is 7.0 and 14.6 respectively.
Water Quality Index Calculation: Essentially, a Water Quality Index (WQI) is a compilation of a number of parameters that can be used to determine the overall quality of water sample. pH, Nitrate, Electrical conductivity (EC), turbidity, Dissolved Oxygen (DO), Total Dissolved Solids (TDS), alkalinity, chloride, sulphate, Zinc, sodium, Carbonate Hardness, manganese, iron and copper. The numerical value was then multiplied by a weighting factor that is relative to the significance of the test to water quality. The sum of the resulting values was added together to arrive at an overall water quality index. It is basically a mathematical means of calculating a single value from multiple test results. The WQI result represents the level of water quality in a given borehole location. The following steps were employed in computing the overall water quality.
i. The weightage unit (Wn) for all parameters tested was determined and summed up to obtain
ΣWn
ii. The quality rating or sub-index for all parameters tested was determined and summed up to obtain
Σqn
iii. The index Wn*qn was calculated for each parameter tested and summed up to obtain
ΣWn .qn
iv. Finally, Water Quality Index (WQI) was computed for each borehole location using the mass balance equation of the form:
(100) – ( ΣWnqn/ΣWn) (3.3)
Ground Water Quality Analysis Using Principal Component Analysis
Statistical computations involving the application of principal component analysis for ground water modelling was made using statistical package for the social sciences (SPSS 22 software). Principal component analysis (PCA) is a powerful tool that attempts to explain the variance of a large dataset of intercorrelated variables with a smaller set of independent variables. The Principal Components (PC) is the uncorrelated (orthogonal) variables obtained by multiplying the original correlated variables with the eigenvector, which is a list of coefficients (loadings or weightings). Thus, the PCs are weighted linear combinations of the original variables. PC provides information on the most meaningful parameters, which describe the whole data set while affording data reduction with a minimum loss of original information. Application of PCA to ground water analysis was conducted by using the following step by step methodology
a) Collection of groundwater samples
b) Analysis of the water samples
c) Computation of Anti-image correlation matrix
d) Computation of eigen values
e) Extraction of the component matrix
f) Generation of scree plot
g) Extraction of the rotated component matrix
h) Horizontal decentralization of the component matrix
i) Extraction of parameters with critical effects on water quality
Result and Discussion
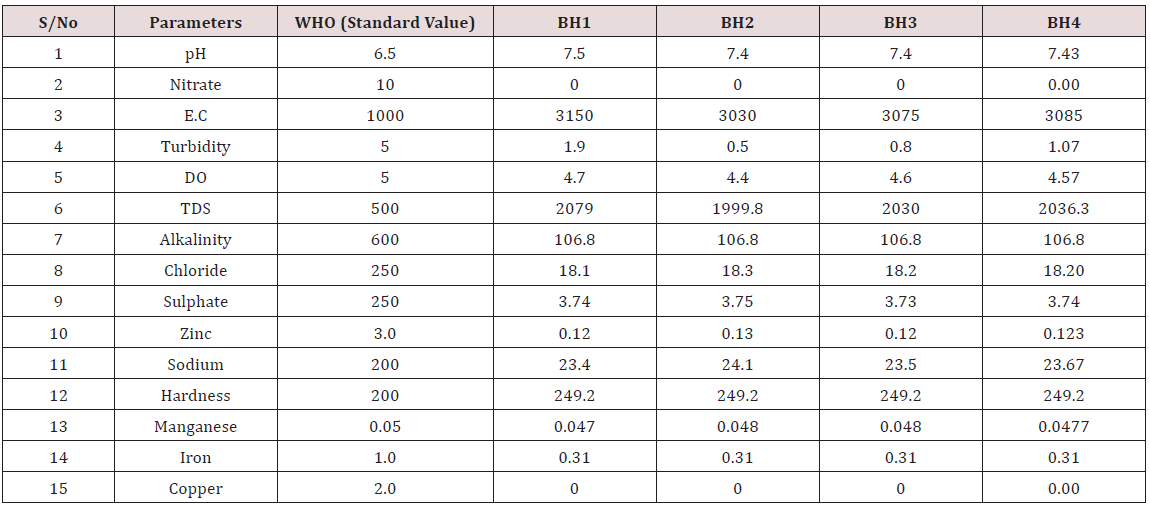
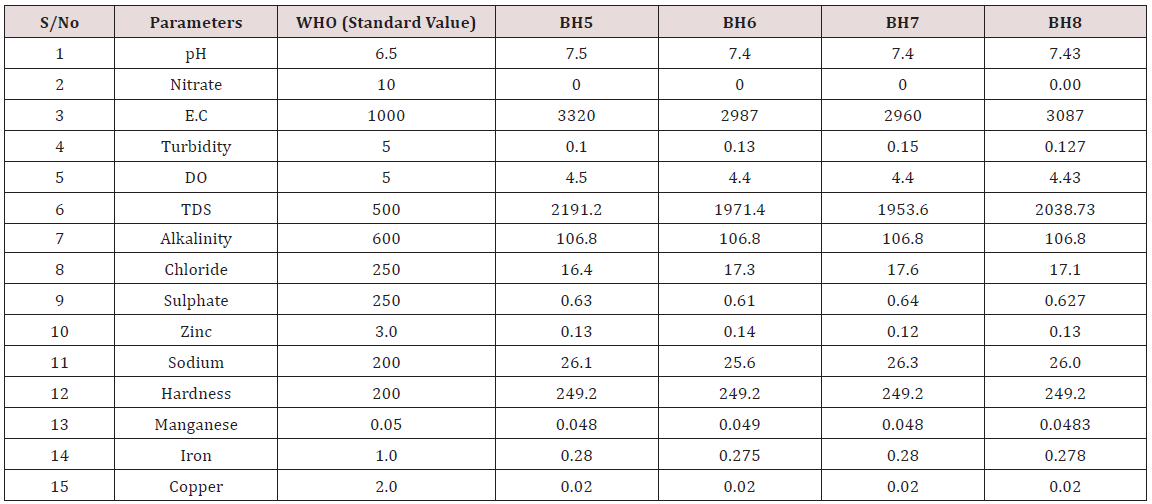
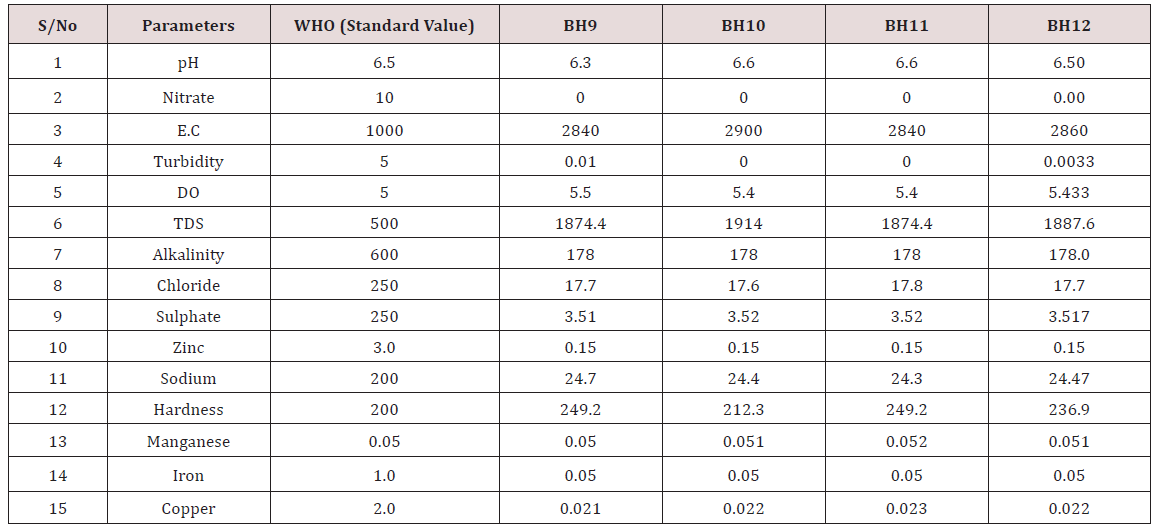
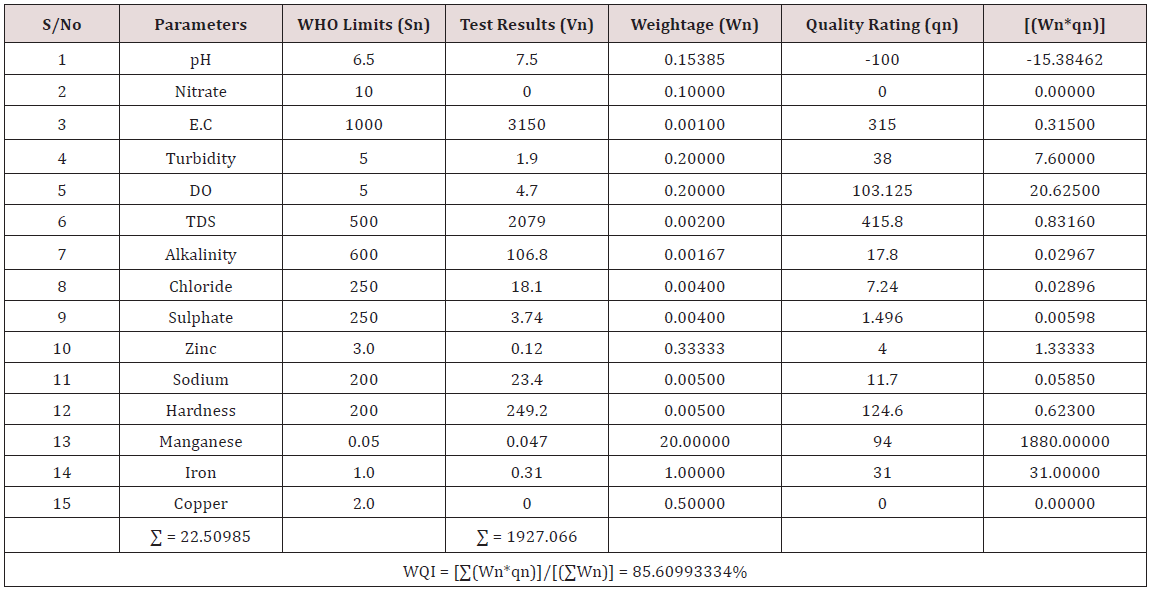
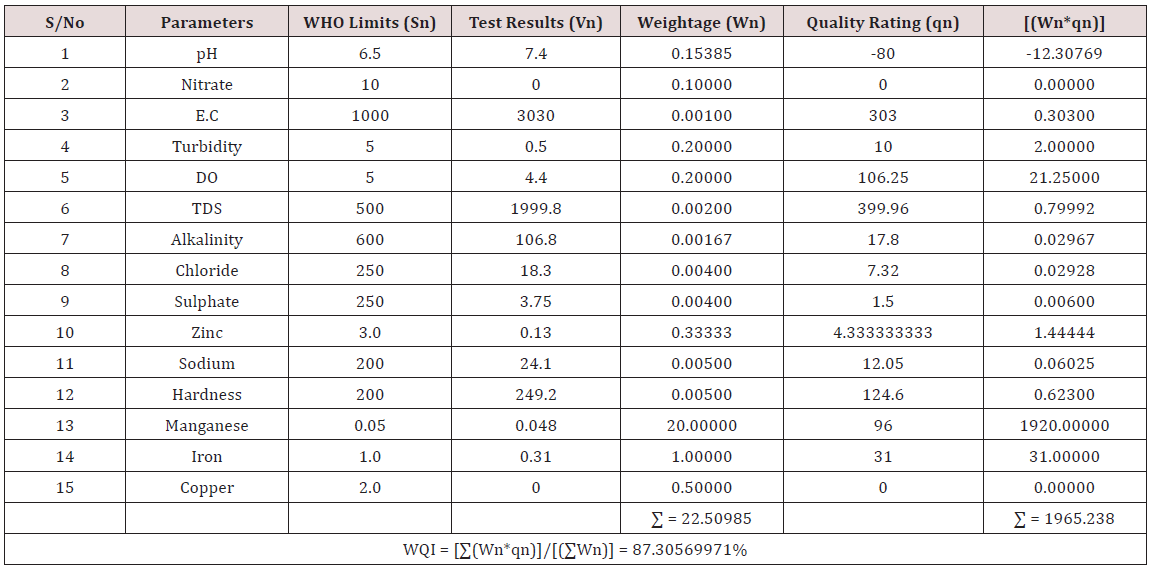
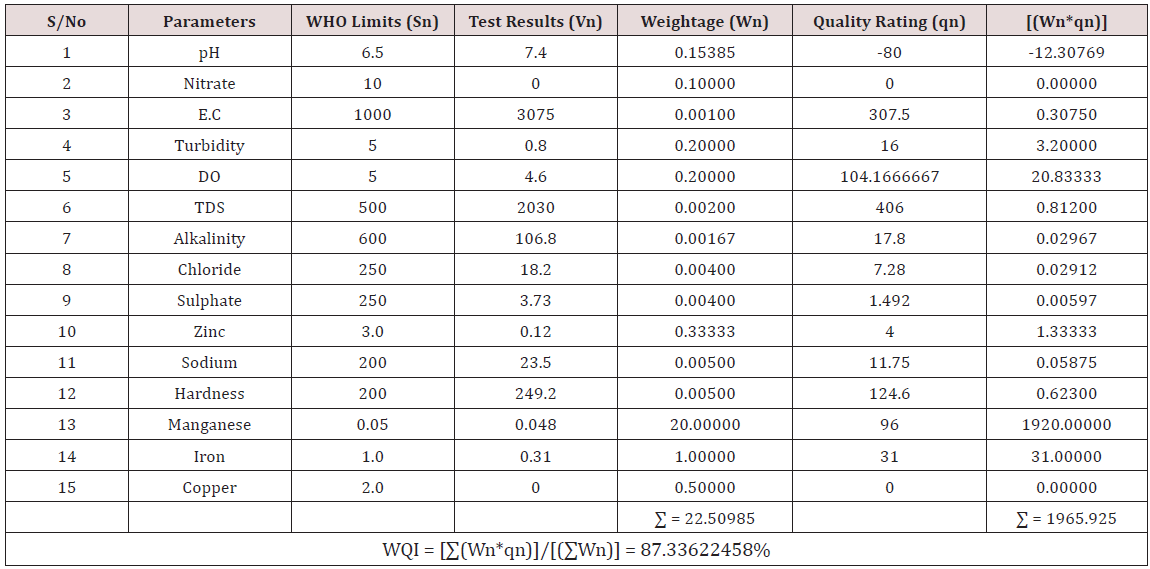
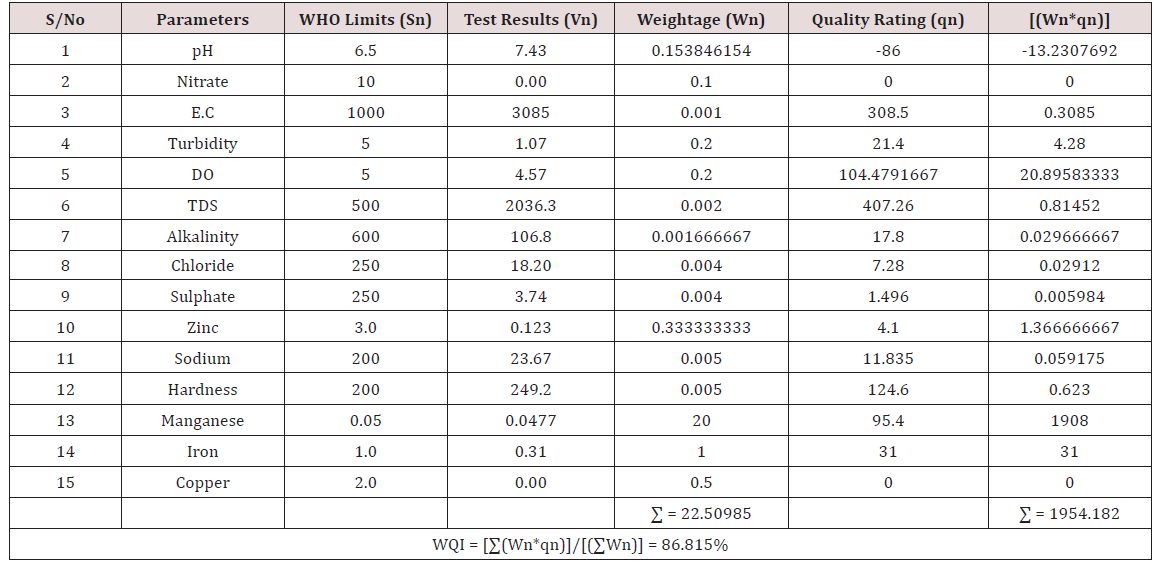
Results of the detailed physico-chemical analysis of the ground water samples are presented in Appendix while the parameters employed for the water quality index modelling and principal component analysis is presented in Tables 1- 3. Results of the computed water quality index are presented as shown in tables 4 to 15 respectively. Based on the result of Tables 4-15, it was observed that there is a significant variation in the water quality index of the water samples collected from the twelve different boreholes.
Principal component analysis (PCA) was performed to:
a) Study the combined influence (correlation) of some selected water quality parameters on the overall quality of borehole water within the study location.
b) Identify the most critical water quality parameter (s) that significantly influenced the overall water quality of ground water within the study area
Results of the factor analysis are presented as follows
Anti- Image Correlation Matrix
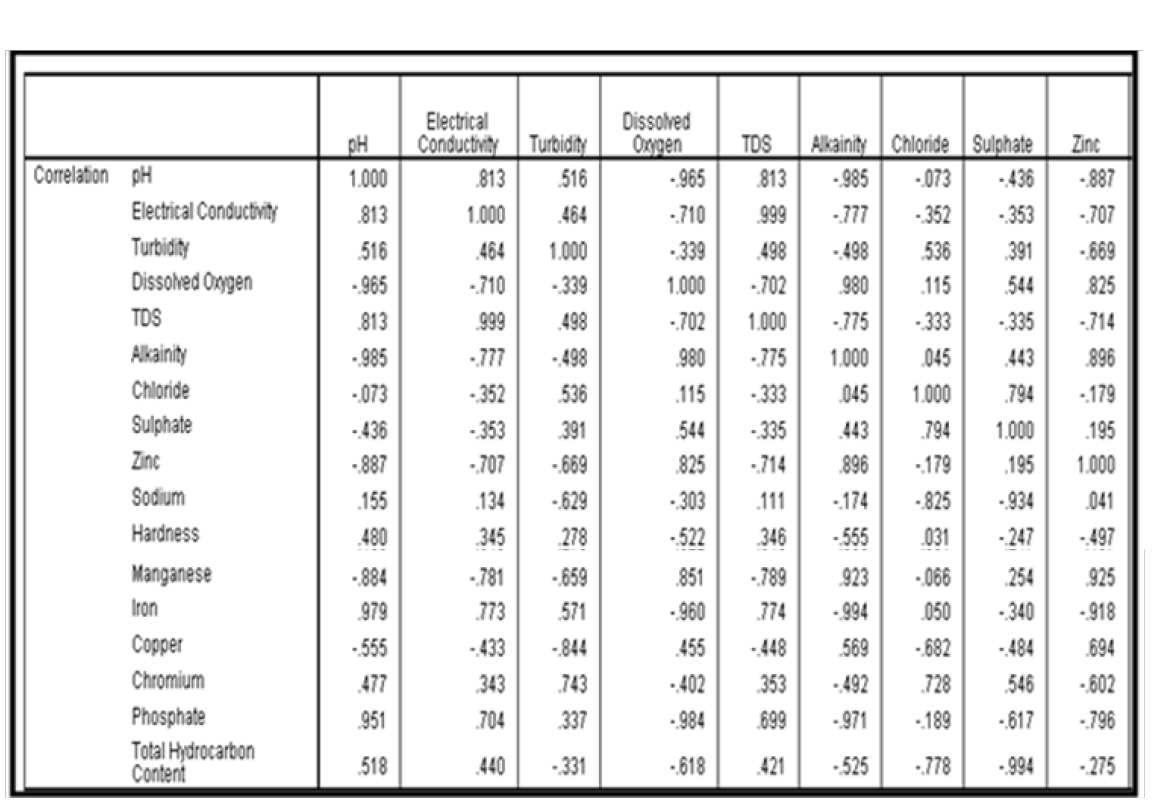
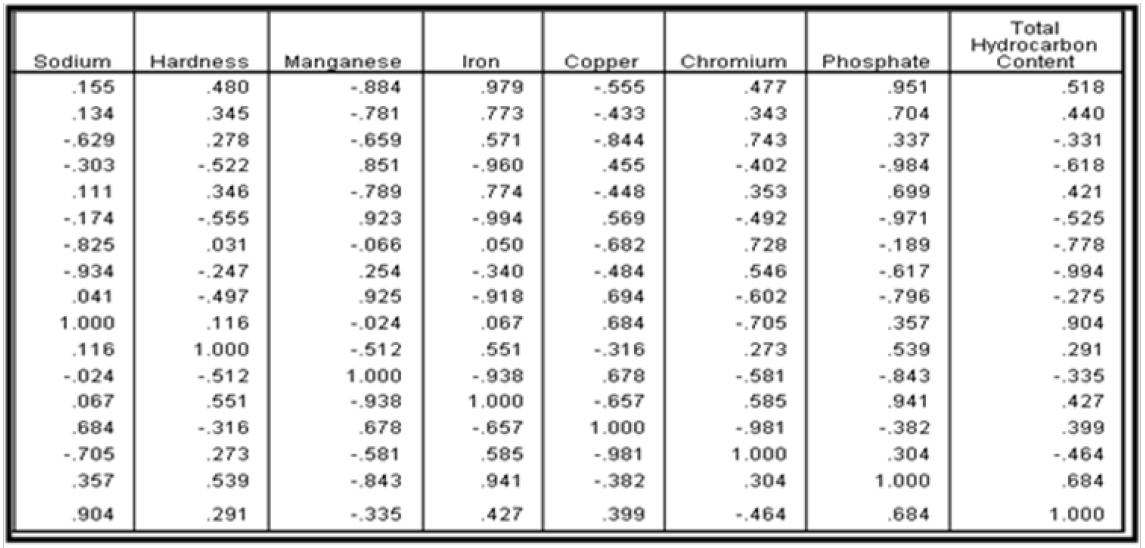
The anti-image correlation matrix presented in Tables 16a & 16b was employed to test the capacity of principal component analysis (PCA) in explaining the underlying correlation between some selected water quality parameters. Results of Tables 16a & 16b shows that principal component analysis is suitable for this analysis. The suitability of PCA is based on the fact that; the off diagonal matrix in Tables 16a & 16b are less than unity with a host of them very close to 1.
Computation of Communualities
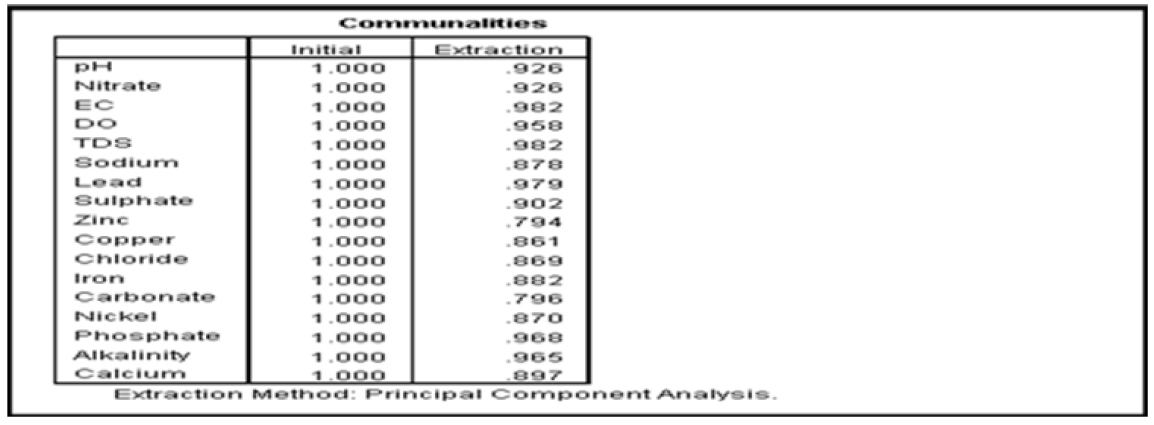
It is also important in the extraction phase to examine the communualities. The communalities is represented by the sum of the square loading for a variable across factor. Communality can range from 0 to 1. A communality of 1 means that all of the variation in the ground water quality is explained by the component factors. The computed communualities is presented in Table 17. It was observed from the result of Table 4.17 that the initial communualities was 1.000 for all the ground water quality parameters employed for this analysis. Communualities of 1.000 is good since it indicates that the variation in ground water quality around the study area can be explained with the aid of principal component analysis. Extraction communualities are estimates of the variance in each variables accounted for by the factors. High extraction indicates that the extracted components represents the variables well. If any extraction is very low (< 0.3), then one may need to extract another component factor.
Extraction of Component Factors
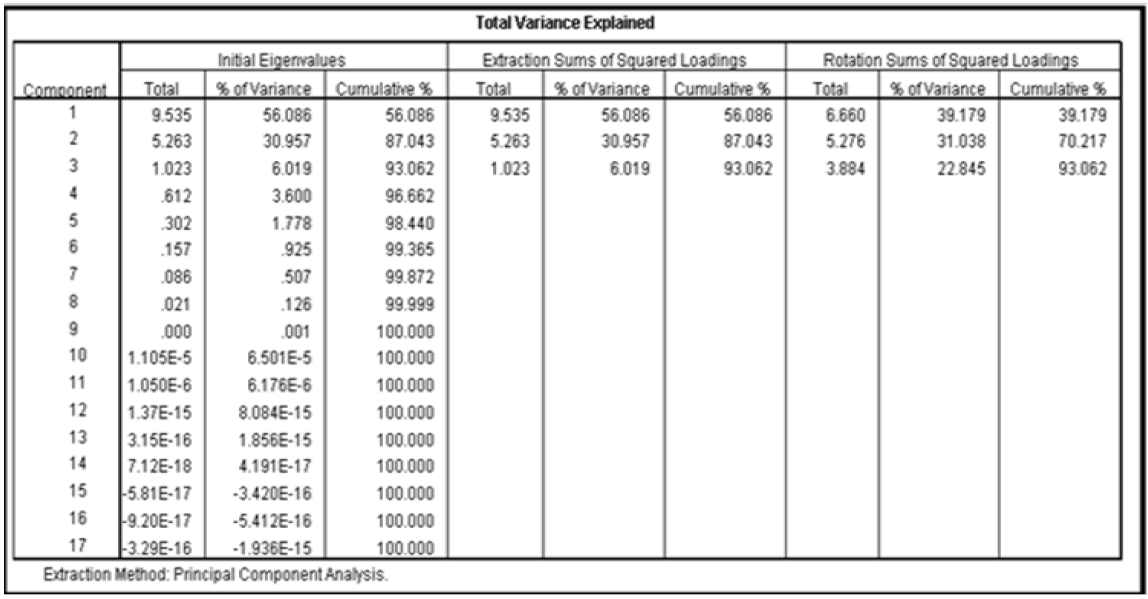
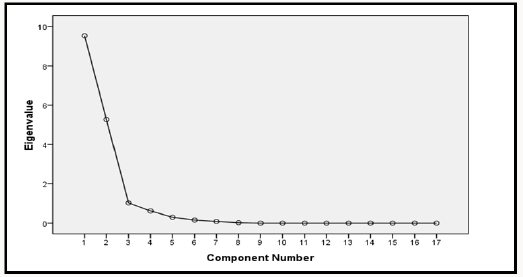
The next step in the factor analysis was to extract the component factor using principal component analysis method (PCA). Result of the component factor extracted is presented in Table 18. The extraction analysis determines how well the component factors explains the variation in the overall water quality from the twelve boreholes using the total varianced explained as presented in Table 19. Factors with eigen values greater than one represent the number of component factors needed to describe the underlying variation of the ground water quality. This are the component factors that contributes an adequate amount to the variation in the ground water quality. The eigen value is normally used as cutoff in factor analysis since it is the sum of the squared factor loadings of all variables. Factors with eigen value less than unity means that such factor do not have any influence on the overall ground water quality. From the results of Table 18, it was observed that three component factors had eigen value greater than one. These component factors contributed to change in the quality of the ground water aroung the study area. This claim was further supported using the scree plot presented in Figure 2. From the result of Figure 3, it was again observed that three component factors possess very strong influence on the overall quality of the ground water around the study location.
Extraction of Rotated Component Matrix
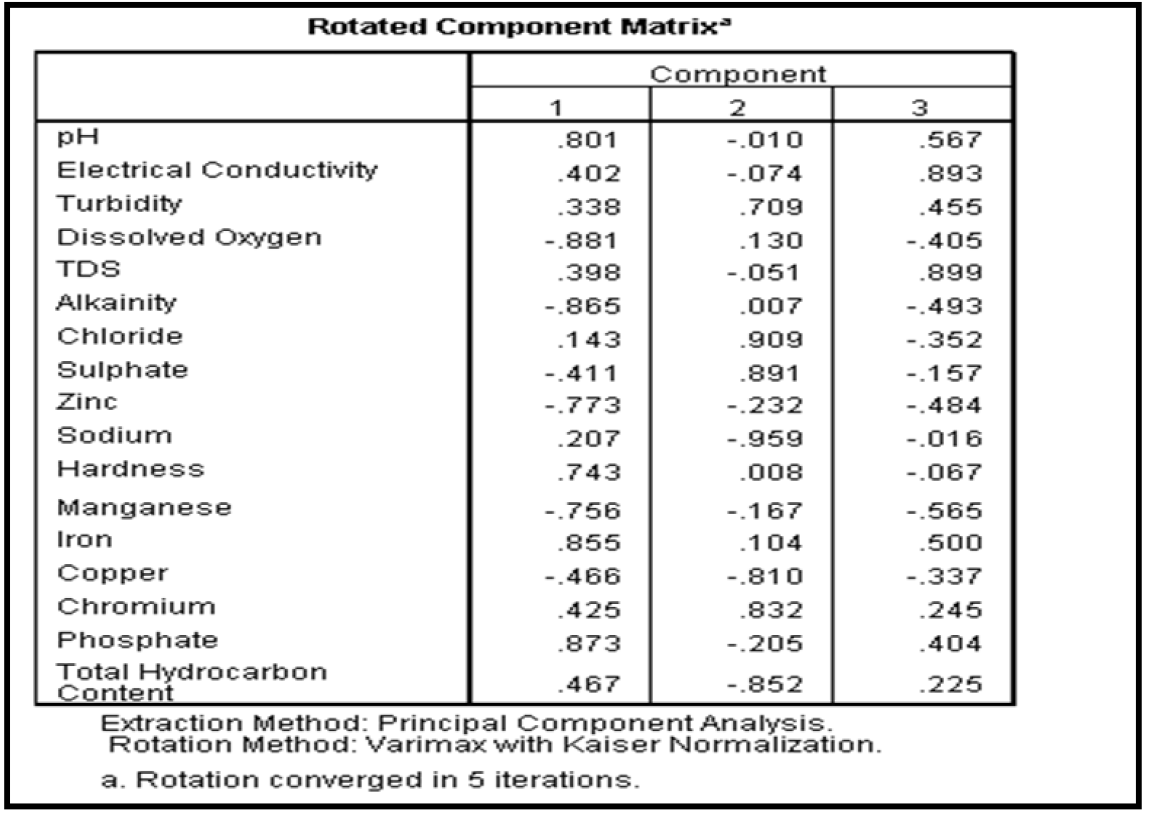
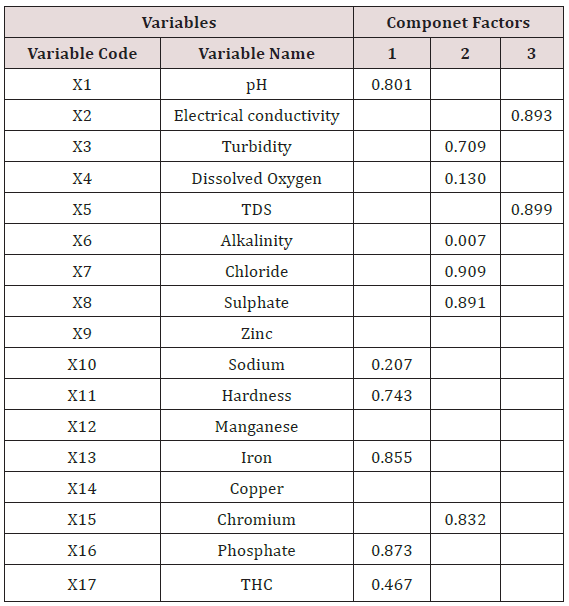
In other to identify the ground water quality parameters that make up the members of each component factors, the rotated component matrix was generated as presented in Table 19. The extracted rotated component matrix was employed to understand the correlation between ground water quality parameters in each component group. In regression terms, the rotated component matrix is the standardized regression coefficient between the observed values and the component factors. Higher factor loading indicates that a parameter is closely associated with the component factor. To determine the water quality parameters that make up each of the component factors, horizontal decentralization of the rotated component matrix was done and the best favoured parameters was selected as member of that particular component factor. Result of the horizontal decentralization of the rotated component matrix is presented in Table 20
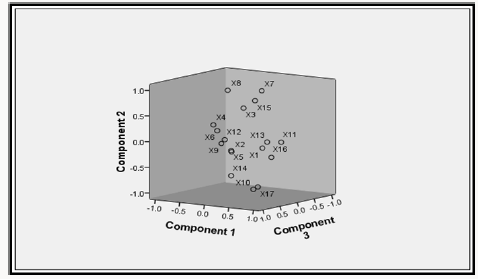
Results of Table 20 revealed that the first component factor is most highly correlated with pH, concentration of sodium, iron, total hardness, phosphate and total hydrocarbon content with phosphate having the strongest influence. The second component factor is most highly correlated with turbidity, dissolved oxygen, alkalinity, chloride, chromium, and sulphate concentration with chloride concentration having the strongest influence. The third component factor is most highly correlated with electrical conductivity and total dissolved solids with Tds having the strongest influence. It is also observed from the result of Table 20 that zinc, manganese and copper do not have any influence on the overall quality of the different borehole water tested. In addition, phosphate, chloride and total dissolved solids are the three most important variables affecting the quality of the borehole water within the study area. The component plot in rotated space is presented as shown in Figure 2. Based on the results of the factor analysis using the principal component analysis (PCA), it was observed that phosphate, chloride and total dissolved solids are the three most important variables affecting the quality of the borehole water within the study area. Therefore, the treatment units to be design must be capable of addressing the effects of high posphate, chloride and total dissolved solid observed with the borehole water.
Treatment Unit for Chloride Removal
Chemical precipitation involving the use of quick lime (calcium oxide) or soda lime can be employed. The quick lime will react with the chloride present in the water to form precipitate of calcium chloride which can then be removed either by gravimetric analysis or sedimentation under the influence of gravity. For effective design computation, the following assumptions were made:
a) Daily water demand = 2 million Liters (2 x 10⁶L)
b) Volume of water to be treated = Daily water demand
c) Maximum chloride concentration = 18.3mg/L
For molecular weight, we find that 100parts of CaCO3 requires 56 parts of pure lime (CaO) for treatment or
100mg/L of CaCO3 requires = 56mg/L of quick lime
18.3mg/L of CaCO3 will require
56/100×18.3mg / L of CaO =10.248mg / L of CaO
Hence quick lime needed = 10.248 mg/L
Since two million liters of water is to be treated, total quick lime required.
= 10.248mg/L x 2 x 10⁶L
= 20.498kg
The quantity of soda required to react with non-carbonate hardness of 18.3mg/L (as calcium carbonate) is computed as follows;
From molecular weight we have
100parts of CaCo3 requires = 106 parts of Na2CO3
18.3mg/L of CaCo3 will require
Total soda lime required to treat two million liters of water
= 19.398mg/L x 2 x 10⁶L
= 19.398 x 2 x 106mg
= 38.796kg
Dimension of Dosing Tank
Daily water demand = 2000m3/d
Hourly water demand = 2000/24= 83.33m3/hr
a. Since Pumping Is For 20hrs Per Day, Discharge Into The Tank Will Be
83.33*24/20= 100m3/hr
b. Assume A Detention Period Of 8 Hours Then
i. Capacity of tank = 100m3 / 8 = 800m3
c. Assume Effective Tank Depth Of 3.0m Then
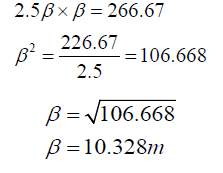
ii. Area of tank =Volume/depth=800m3>/3m=266.67m2
d. Assume Length To Breadth Ratio Of 2.5:1
Length = 2.5β = 2.5 x 10.325
L = 25.820m
e. Assume A Free Board of 0.5m, Hence Actual Depth of Tank = 3.5m
Hence tank dimension = L x β x h = 25.820m x 10.328m x 3.5m
Treatment Option for Phosphate and Total Dissolved Solids
The fixed bed adsorption treatment method offers the best treatment options of water containing high concentration of phosphate and total dissolved solids. Fixed bed column can be operated singly in series, or in parallel. Treatment with a granular activated carbon involves carbon held in a reactor (sometimes called a contactor). The water to be treated is applied to the top of the column and withdrawn at the bottom. The activated carbon is held in place with an under dram system at the bottom of the column. The advantage of a down flow design is that adsorption of organics and filtration suspended solids are accomplished in a single step.
a. Volume of Water Treatment per Gram of Granular Activated Carbon Specific Throughput.
Assumption
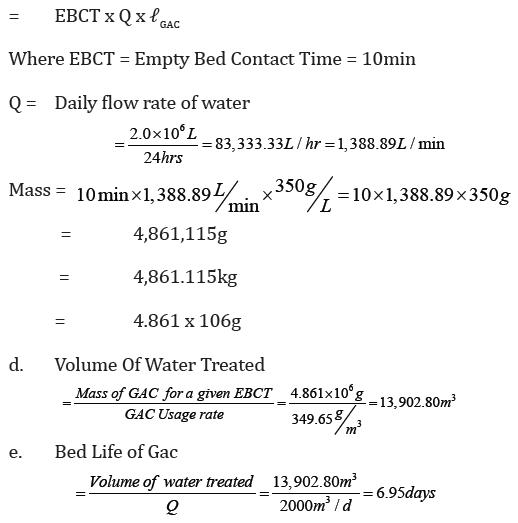
i. Let Empty Bed Contact Time (EBCT) = 10min
ii. Let effective contact time (t) = 7min
iii. Density (ℓ) of GAC = 350g/L
Then
Specific throughput =t/(EBCT)(lGAC )= 7 / 10* 350=0.00286L/g
b. GAC - Granular Activated Carbon Usage Rate (g/m3)
1/ Specific throughput = 1/0.00286 = 349.65g/ m3
c. Does of Gac Required for 10min Ebct
Conclusion
Analytical tools employed in this study which include; physicochemical characterization, water quality index modeling and principal component analysis where found effective in providing suitable information on:
i. The quality of ground water witnin the study location.
ii. Understanding the contributions of each water quality parametrs to the overall quality of ground water within the study area
Information derived from the analysis was therefore employed as baseline for the design of the treatment unit. The design was targeted to solving the basic issues derived from the principal component analysis which revealed that phosphate, chloride and total dissolved solids are the three most important variables affecting the quality of the borehole water within the study area.
Appendix
Appendix 1: Water quality Assessment of Borehole 1, 2, 3, and 4.
(Module 1-4)
Appendix 2: Water quality Assessment of Borehole 5, 6, 7, and 8.
(Module 1-4)
Appendix 3: Water quality Assessment of Borehole 9, 10, 11, and 12.
(Module 1-4)
References
- B Ivan, A Marco, L Mathias (2014) Physically and Geometrically Nonlinear Vibrations of Thin Rectangular Plates. International Journal of Non Linear Mechanics 58: 30-40.
- G Polytech (2001) Basic of Experimental Modal Analysis. Polytec GmbH, Polytec Platz, Waldbronn Germany.
- A Chopra (2014) Dynamics of Structures-Theory and Applications to Earthquake. (4th edn), Prentice Hall, USA.
- ANSYS Inc, v-18, help guide.
- (2006) Footbridges: assessment of vibrational behavior of footbridges under pedestrian loading. Roads and Bridges Engineering and Road Safety, Paris, France.
- (2005) Eurocode 0: Basic of structural design. Appendix 2: Application for bridges, European Standard Norme.
- British Standards Institution (2003) UK National Annex to Eurocode 1: Action on structures-Part 2: Traffic loads on bridges, NA, London.

Top Editors
-

Mark E Smith
Bio chemistry
University of Texas Medical Branch, USA -

Lawrence A Presley
Department of Criminal Justice
Liberty University, USA -

Thomas W Miller
Department of Psychiatry
University of Kentucky, USA -

Gjumrakch Aliev
Department of Medicine
Gally International Biomedical Research & Consulting LLC, USA -

Christopher Bryant
Department of Urbanisation and Agricultural
Montreal university, USA -

Robert William Frare
Oral & Maxillofacial Pathology
New York University, USA -

Rudolph Modesto Navari
Gastroenterology and Hepatology
University of Alabama, UK -

Andrew Hague
Department of Medicine
Universities of Bradford, UK -

George Gregory Buttigieg
Maltese College of Obstetrics and Gynaecology, Europe -

Chen-Hsiung Yeh
Oncology
Circulogene Theranostics, England -
.png)
Emilio Bucio-Carrillo
Radiation Chemistry
National University of Mexico, USA -
.jpg)
Casey J Grenier
Analytical Chemistry
Wentworth Institute of Technology, USA -
Hany Atalah
Minimally Invasive Surgery
Mercer University school of Medicine, USA -

Abu-Hussein Muhamad
Pediatric Dentistry
University of Athens , Greece

The annual scholar awards from Lupine Publishers honor a selected number Read More...


