Lupine Publishers Group
Lupine Publishers
Menu
ISSN: 2637-4668
Research Article(ISSN: 2637-4668) 
Identification of Determinant Factors Influencing Modal Choice Behavior and Satisfaction Level of Commuters: A Case of Rajshahi City Volume 3 - Issue 5
Muhaiminul Islam1*, Rafi Mahmud Tumon1, Md Rashiqul Islam1 and Anutosh Das2
- 1Undergraduate student of Department of Urban & Regional Planning, Rajshahi University of Engineering & Technology, Bangladesh
- 2Lecturer of Department of Urban & Regional Planning, Rajshahi University of Engineering & Technology (RUET), Bangladesh
Received: October 29, 2019; Published: November 13, 2019
Corresponding author: Muhaiminul Islam, Department of Urban & Regional Planning, Rajshahi University of Engineering & Technology, Bangladesh
DOI: 10.32474/TCEIA.2019.03.000171
Abstract
The economy of the Rajshahi city is growing day by day. The growing economy increasing employment opportunities which are attracting more people from the suburban areas. Hence, increasing number of trips are generated by commuters. The commuters use different modes for their commuting. Understanding the mode choice behavior and satisfaction level of the commuters is important for planners and policymakers to facilitate transportation services and to undertake management strategies. Commuter’s socioeconomic background and demographic characteristics affect the mode choice and also services provided by different modes affect mode choice behavior of the commuters. This study attempts to identify the influencing factors behind the mode choice behavior of commuters and to determine the level of satisfaction of commuters on the existing frequently used mode. In this regard, the data is collected through questionnaire survey and the sample collection method is systematic random sampling method. After data collection, the data are analyzed through excel and SPSS. The analysis shows that mode choice of the commuters largely depends on income, age, travel time and travel distance etc. And people are satisfied with the service of their frequently used mode. With the provision of some facilities and management strategy, the satisfaction level can be further improved. If concerned authority offers commuters opportunities of smooth movement through transportation policy, Rajshahi city may function efficiently in coming decades. This study will provide an insight to formulate efficient planning and policies in future.
Keywords: Commuters; Influencing factors; Mode Choice; Rajshahi; Satisfaction levels.
Introduction
The term commuter is defined as a person who travels some distance to work on a regular basis Asensio et al. [1]. A large number of commuters are attracted every day from the suburban area because of the growing economy and urban employment opportunity of Rajshahi Islam et. al, 2016. Most of these commuters have to depend on different transport modes for their daily commuting. As commuters have to travel a long distance during the peak periods, choice of transport mode is very crucial for them. Suburban traveling is multimodal in characteristics which involve combination of multiple modes [2]. Different studies showed that mode choice plays the vital role along with the main mode for a longdistance commuting [3]. It is necessary to study different aspects of their mode choice behavior to meet the expected necessities of the commuters according to their needs, likings and socio-economic features. In addition, a comprehensive mode choice study is needed considering the main mode for a well-integrated multimodal transportation system for the commuters. Some people also feel relaxed to live in the suburban area for a better environment. Suburban commuters typically compromise the transportation disutility resulting from higher travel time and cost for less housing cost and better environment Evan et al. 2002.
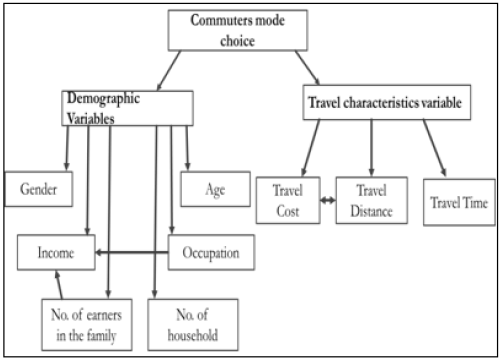
A huge number of commuters are traveling every day which affects the economy of the Rajshahi. If the transportation system is not affordable, suitable and effective for the suburban commuters, then the disutility overshadows the influence they are creating on the economy of Rajshahi city and as a result, they are more likely to choose their residence in the main city near to their working place. In the near future, it will create more Rajshahi city clogged and overpopulated. For Rajshahi, the majority of the suburban commuters are dependent on Bus. But it is understandable that a certain number of the commuters are auto/CNG users and Bi-cycle users. Most of them are using the Rajshahi- Nature Route. Distance and economy are playing a vital role. For traveling a long- distance commuter should prefer Bus service as it is cost effective and less time consuming and also this number is going to increase in near future when the growth of Rajshahi spreading towards its suburban area. It is necessary to ensure a good quality transportation system that will ensure the quality commuters travelling. No studies have been conducted yet to figure out the mode choice behavior of the commuters living in Rajshahi’s suburban areas Figure 1. To fill the existing knowledge gap, this study challenges to analyze the mode choice behavior of the commuters who have to regularly travel to Rajshahi from its suburban areas using different travel mode and also tries to find out the level of satisfaction of commuters on their frequently used mode.
Literature Review
Level of satisfaction is used to depict the condition of different modes of transport. Satisfaction is then defined as a judgment which may be a product or service feature, or the product or service itself and provides a pleasurable level of consumption-related completion [4]. It is also defined as psychological consequence emerging from experiencing the service [5]. On the other hand, customer’s satisfaction is an emotional response to the use of product and service [6]. It is a complex human process involving intellectual and affective processes as well as other psychological influences [7]. Anton et al. [8] gave a more modern approach defining customer satisfaction as a state of mind where the customer’s needs, wants and expectations throughout the product or services life have been meeting or exceeded resulting in subsequent repurchase and constancy.
This study endeavors to calculate commuter’s level of satisfaction. Commuters are the person who regularly travels one place to another, typically to work. According to the official statistical data of the Statistical Office of Republic of Serbia, who work or go to school out from their place of residence and return to it on daily basis or several times a week [9]. Earlier research has clearly shown that individual and household socio- demographics apply a strong influence on travel mode choice decisions and gender, income, car ownership, employment status affect travel mode decisions [10].
Residential location, neighborhood type, and urban form play a prominent role in determining the favored travel mode for the commute [11]. In more recent research studies, to compute the value of travel time, the reliability of travel time is also combined within the framework [10]. Other attributes that effect travel mode choice include travel distance [12].Trip satisfaction is an important step to the promotion of sustainable modes of transport which have got the increased attention recently and it has been a part of a larger shift in the field of transportation towards the study of travel behavior [13]. There are several studies related to the commuters and travel behavior. For example, in the study by Witchayangkoon, Sirimontree, Buddhawana, and Lertpocasombut et al. [14].
Vanpool commuter service of Bangkok was observed. The purpose was to assess the satisfaction level of Vanpool user. From the study, the passenger has moderate satisfaction with the service scoring 3.4 out of 5. They claimed that Vanpools make Bangkok a livable city in the aspect of public transport and environmental issues. In the study by St-Louis et al. [13] assessed how the level of satisfaction differs across transportation mode which can be helpful to encourage the use of active as well as public modes of transport over the use of automobiles. This study used large travel scale survey across six modes of transportation. This framework assumed the external and internal influencing factors of satisfaction: personal, social and attitudinal variables must be considered in addition to objective trip characteristics. The finding was pedestrians, train commuters and cyclist were significantly more satisfied over drivers, metro and bus users. Arasan et al. [15] studied characteristics of trips by foot and bicycle modes in Tiruchirapalli, Tamil Nadu, India. They analyzed home-based walking and bicycling trips with respect to trip length and the influential variables such as age, sex, occupation, the purpose of the trip, and time of the day of travel. Significant variations in trip lengths by walk and bicycle were found to exist among trip makers of different categories.
Materials and Methods
At first preliminary literature review are conducted for findings the suitable study. It helps to understand the importance of this study in the context of the study area. The main objective of the study is to identify the influencing factors behind the mode choice behavior of commuters and another objective is to determine the level of satisfaction of commuters in their frequently used mode. A comprehensive literature review has been performed to conceptualize the study and explore all probable method how the study can be done and what methods can be used. After conducting the comprehensive literature review the study area has been selected for the study. The Rajshahi-Natore route is selected for the survey and the targeted people are a commute from Bagha, Charghat, and Natore etc. After that suitable methods are selected to perform the study. At first, for the data collection draft questionnaire has been prepared. Then after conducting preliminary survey, the questionnaire is finalized.
Data from primary sources were collected for this study. Primary data was collected through reconnaissance survey, personal interview on socio-economic characteristics of an individual trip maker. Systematic random sampling technique is used or else it may not fulfill the purpose. The total sample needed to conduct the study is about 227 with confidence level 95% and confidence interval 6 which is calculated by using sample calculator. Total 230 samples are collected for the study. The survey was done at Talaimairi Bus stand and another place like some construction sites. Target people were Day Labor, Rickshaw Puller, Auto Driver, and Businessmen. People travel from outer part of the Rajshahi City Corporation area were considered as a commuter with the range of 60-70km from the center. No sorting and screening (such as incomplete questionnaire, invalid data etc.), was done, so all the questionnaire were considered for further analysis.
The questionnaire for survey contains the trip (such as, travel mode, purpose of trip, origin, desired destination, and length of stay at destination), the features of travelers (which includes, age, gender, monthly family income), travel time and travel cost are also included. The questionnaires were written with the names of the three distinct modes under study, such as Bus, CNG/Auto, and Bicycle. For the purpose of mode split analysis, the data of commuters is collected. In this study gender, income, travel time and travel cost are four variables used in explaining the selection of a mode for transportation commodities. By considering these variables regression, correlation and crosstabs is done using SPSS to identify the factors that influence the modal choice. And to overall satisfaction level is calculated by taking an average of 22 variables. For the purpose of data analysis, the methodology follows the descriptive and mathematical analysis of socioeconomic and travel characteristics of the commuters and the factors affecting their mode choice. The analyses have been carried out through cross-tabulation, tables, and charts developed by SPSS and MS EXCEL. After data analysis, the result represents and some recommendations are provided where necessary.
Results
Factors affecting mode choice behavior
Commuter’s socio-economic characteristics and their travel characteristics are the important factors affect their mode choice decision. This chapter intended to provide a descriptive analysis of different factors associated with mode choice behavior of the suburban commuters of Rajshahi. Commuter’s mode choice depends on different factors. Characteristics are divided into two main categories. Those are demographics variables and travel characteristics. Demographics variables are again subdivided by age, gender, occupation, number of earners in the family, number of household and income. On the other hand, travel characteristics variables included travel time, travel distance and travel cost.
Socio-economic characteristics of the commuters and mode choice behavior
Age: The majority of the commuters are aged between 25-40 years (Table 1). The percentage of travelers aged 15-25 years use Bicycle for commuting is about 80.90. Majority of the commuters (55.20 percent) are in the age group sof 25-40 years. Only 20.4 percent and 24.3 percent of the travelers are aged 15-25 and above 40 years respectively. The younger aged commuter prefers bicycle as their mode of transport. Because it is free of cost. Only 5.4 percent of commuters aged above 40 years use a bicycle.
Income: Income plays an important role in passenger choice behavior [16]. Because income will influence the mode choice behavior. For example, low-class people always seek low-cost travel modes, sbut rich people don’t. Different class of people will pay differently for the same destination. For the purpose of the study, the Income level of the commuters is distributed into three categories that are shown in table 2. It shows that the majority of the commuters (64.30 percent) belongs to the group of 10000- 20000 BDT monthly income (Table 2). The number of people of lower income is also considerable. 32.2 percent of the commuters have monthly income less than 10000. If the modal share is devised, most of the lower income commuters are bus and bicycle users. Contra wise, commuters of higher income mostly prefer CNG/Auto.
The mode choice of the commuters according to income is delineated in the table. The majority of the commuters having an income level 10000-20000 BDT and 34.8 percent of them are using Bus as a mode of transport (Table 2). The commuters whose income level is less than 10000 prefer Bus and Bi-cycle and the percentage is 78.4 and 21.6 respectively and they avoid CNG/Auto totally. The percentage of bus used for the group of 10000-20000 is 54.1 percent. For CNG/Auto 10.1 percent and for Bi-cycle 35.8 percent. The most interesting thing is 100% of the commuters of income level 20000-30000 use CNG/Auto as their income level is greater. Here 58 percent of the Bus users and 65.2 percent of the CNG/Auto users are having an income level of 10000- 20000, 34.8 percent of CNG/Auto users are from 20000-30000 monthly income level. As the result shows the number of higher-class people is less so the percentage of CNG/Auto users also less in the group of 20000-30000. Moreover, 60 percent of the commuters are Bus user, 10 percent are CNG/Auto and the rest 30 percent are Bi- cycle user.
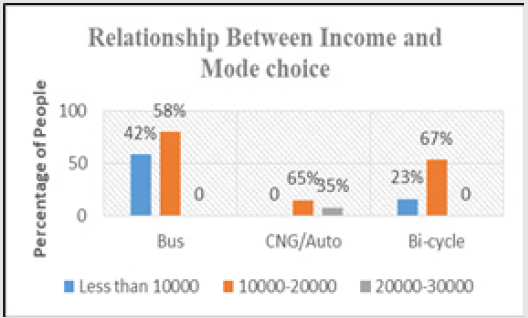
The most vital factor that influences the mode choice behavior of commuter is income. It is evident from the (Figure 2) that income and mode choice behavior are correlated. There are three types of mode: Bus, CNG/Auto and Bi-cycle and income level are categorized into Less than 10000, 10000-20000 and 20000-30000. For Bus 58 percent of users are from 10000- 20000 income level, for CNG/ Auto 65 percent are from 10000-20000 and for Bi- cycle 67 percent are from 10000-20000. There are no Bus users having an income level of 20000-30000, No CNG/Auto users from the group of Less than 10000 and no Bi-Cycle users from 20000-30000. The essence is CNG/Auto is more expensive for poor people. They either travel by Bus or Bicycle.
Number of wage earners in the family: Majority of the commuters (74.3 percent.) have only one wage earner in the family. The commuters who have only one wage earner in the family prefer bus and bicycle and it is about 69 percent and 26.3 percent respectively. When the number of earners increases in the family member a large portion of commuter’s shift to CNG/Auto. Because traveling with CNG/Auto is more convenient but more costly than bus and bicycle. When a number of earners increases, they can afford this slight increase in cost.
Occupation: It is found that majority of the commuters are Rickshaw puller (54.3 percent). 32.6 percent and 13 percent of commuters are day labor and auto driver respectively. If the modal share is considered for day labor, it clearly shows that most of the commuters (70.7 Percent) use bicycle and 29.3 percent Commuters use the bus for their daily commuting.
Travel characteristics of the commuters
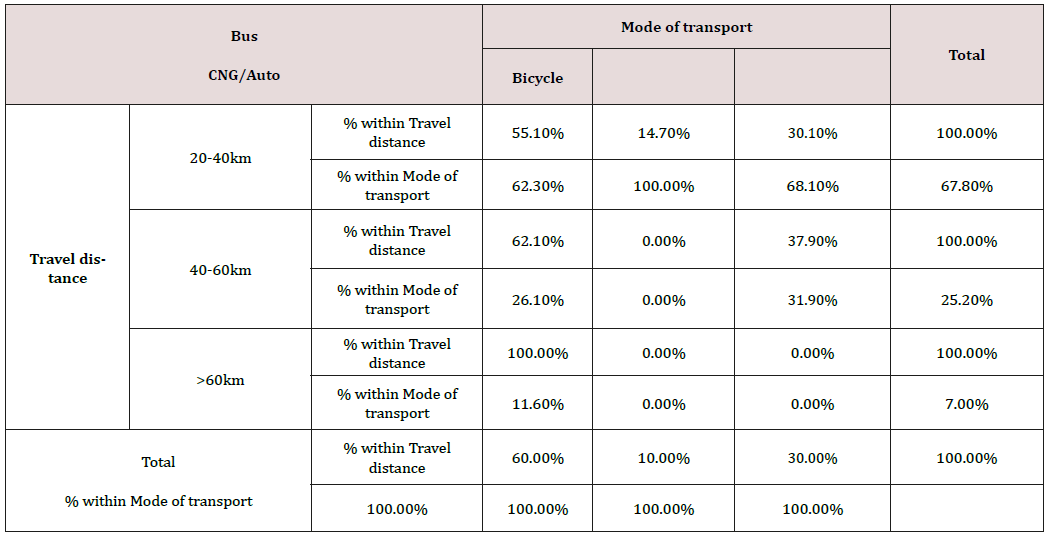
It has been found that majority of the commuter’s travel distance is in between 20km to 40km and the data shows that the percentage is 67.85. Also, it has been found that 25.2 percent commuter’s travel distant is 40-60km and 7 percent commuter’s travel distance is greater than 60km. Here an interesting finding is that when the travel distance is in between 20-40km the commuters use CNG/Auto.
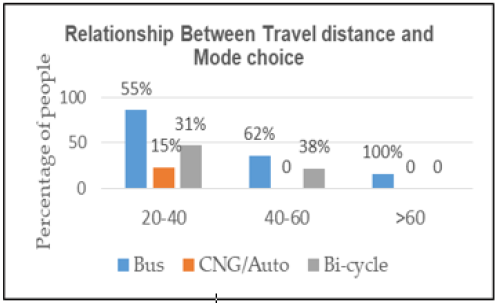
Travel distance: Table 3 delineates the relation between mode of transport and travel distance. For 20-40km distance, the commuters use 55.1 percent of bus, 14.7 percent of 14.7 percent CNG/Auto and 30.1% of Bicycle. But increase in distance changes the percentage among the different modes of usage. For the distance of 40-60km 62.1 percent commuter choose bus and 37.9 choose Bi-cycle and for the distance greater than 60km Bus is only the mode of transport. Here 68.1 percent Bi- cycle users travel from 20-40km and 31.9 percent from 40-60km. On the other hand, 100 percent CNG/Auto users travel from 20- 40km. For the bus 62.3 percent travel from 20-40km, 26.1 percent from 40-60km and 1.6 percent from greater than 60km. The percentage of Bus users varies because between three categories 67.8 percent of commuters travel from 20-40km and only 7 percent from greater than 60km. (Figure 3) delineates the relation of no of people and travel distance and mode choice. There are Bus, CNG/Auto and Bi-cycle modes of transport for traveling and the distance is categorized into 20-40km, 40-60km and >60km. For the distance of 20-40km 55 percent of commuters are using Bus, 15 percent are CNG/Auto user and 31 percent are Bi-cycle user, for 40-60km 62 percent are Bus and 38 percent are Bi-cycle user and the distance is greater than 60km people only travel by bus. So, the essence is increased in distance increases the possibility of choosing Bus by the commuters.
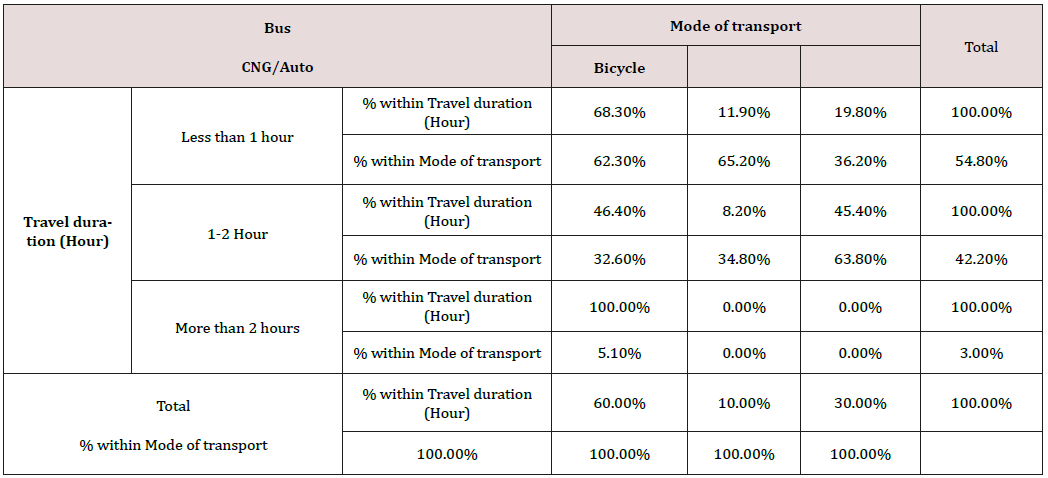
Travel duration: In (Table 4) it has been found that the 54.8 percent commuter’s travel duration is less than 1 hour, 42.2 percent commuter’s travel duration is between 1-2 hour and only 3 percent commuter’s travel duration is greater than 2 hour. It clearly shows that when the travel duration is greater than 2 hours thse commuters only choose bus for their travel. But when the travel duration is between 1-2 hour 46.4 percent commuters choose bus and 45.4 percent of commuters to choose bi- cycle for their travel, it indicates that modal share has no considerable difference. When the travel duration is less than 1 hour most of the commuters use Bus, then they use a bicycle and then CNG/Auto.
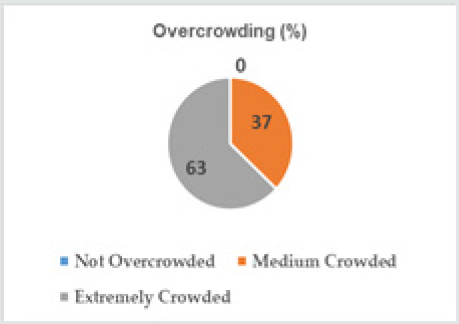
Over crowding: In this Figure 4, it has been found that 63% of respondents said that when they travel by bus they face extremely overcrowding and 37% respondent claimed about medium overcrowding. This overcrowding turns the commuters to travel by other modes. Sometimes they travel by CNG/Auto and sometimes when travel distance is 20-40km, they use a bicycle for their commuting. Because of Overcrowding sometimes modal transfer happened.
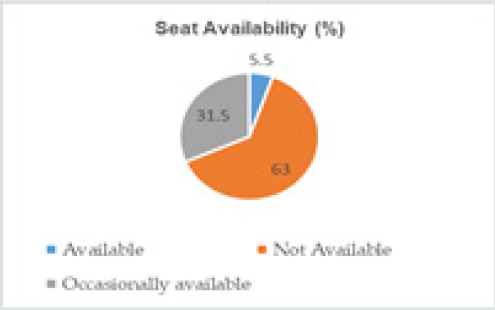
Seat availability: In Figure 5 it has been found that 63% respondents said that when they travel by bus, they don’t get a seat, 31% respondents said seat occasionally available and only 5% said seat available. Seat availability also occurs in the modal transfer. It has been found that the middle-aged commuter shifts their mode to CNG/Auto form Bus.
Reasons behind selecting a bus trip for general purpose
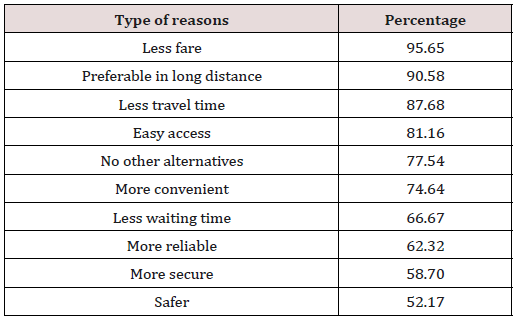
Priority ranking on certain criteria has been made on the basis of people’s perception for selecting a bus trip. From the respondent view, it has been found that less fare is the most valuable reason for selecting a bus as a mode of commuting. About 95.65 percent respondent who travels by bus said less fare is the main reason for selecting a bus, also 90.58 percent respondents had expressed that bus is preferable to them in long- distance travel.
Frequently used mode of the commuter
It’s evident after conducting the pilot survey that, commuters usually use buses as their mode of commuting. The preliminary results show that about 60 percent uses a bus, 30 percent uses a bicycle and 10 percent uses CNG/Auto as their mode of transport.
Level of satisfaction of the commuter: From first objectives, it’s evident that commuter’s mode choice depends on various variables. But most of the commuters prefer bus as their frequently used mode. The second objective aims to understand commuters’ level of satisfaction for improvement of existing bus service facility serving daily commuters. To attain this, 138 regular bus commuters, aged 15 years and above, were interviewed from 15 October to 15 November 2017 at Talaimari Mor and during peak (7 am –8 am and 5 pm – 6 pm) and off-peak periods. The sample is made up of 65.09 percent rickshaw puller, 18.1 percent auto driver, and 15.9 percent day labor. And 22 variables are considered to find out overall satisfaction level of the commuter. Those variables are seat condition, Heating, and ventilation system, proportion of seated to standing passengers, leg space, steps height, waiting time, interchangeability between services, travel expenditure, availability and accuracy of information, fare collection, ramp, drivers and fare collector behavior, vehicle lighting, pickpocket, robbery, driving follow posted speed, shade, sitting, cleanliness, frequency, regularity and schedule maintenance. Additionally, using a Likert-scale, respondents were asked to provide a rating of ‘1’ to ’5’ on their level of satisfaction of the existing bus service attributes for their everyday journey on bus service, with ‘1’ representing very poor,‘2’ representing poor, ‘3’ representing moderate/okay, ‘4’ representing good and ’5 ’ representing very good. The survey findings showed different commuter satisfaction in all attributes.
Ordered logit model results: Satisfaction on different bus service elements: When the “seat condition” is considered mean satisfaction, level is about 2.51. Which denotes that the satisfaction level is poor to moderate/, okay and the standard deviation is .733. Most of the buses contain seats that are broken or not comfortable to seat. Some buses have got the good seat but the number of what types of buses is very few. People’s satisfaction level is not varying a lot, their opinion regarding seat condition almost coincides at the same point. When the “Leg space” is considered mean satisfaction, level is about 1.44. Which denotes that satisfaction level is between very poor to poor and standard deviations is .498. Buses height or design is not satisfactory for the commuters. Even the short people gave the opinion that the buses don’t have enough leg space, they are facing a lot of problems while traveling. A proportion of standing passengers to seated passengers is very high. Commuters have to travel as a standing passenger or on the roof of the buses. When the “Proportion of seated to standing Passengers” is considered mean satisfaction level is about 1.24. Which denotes that the satisfaction level is very poor to the poor and standard deviation is .428. Which indicates the deficiency in bus services for the commuters? Heating and ventilation system is moderate/okay. Some windows are broken, and some can’t open. The mean satisfaction level for heating and ventilation system is 3.12 and a standard deviation is 535.
Around 50 percent of respondents are okay with seat condition and 36 percent think the condition is poor and 9 percent think the condition is very poor. When “heating and ventilation system” is considered about 70 percent respondent think the condition is poor and only 21 percent is okay with the situation. The commuters are okay with the waiting time. About 53 percent of respondents think the situation is not a problem. They don’t have to wait more than 20 minutes to get a bus. But it’s a tiresome practice as they work all day long in their workplace, so if this time can be reduced then that will be beneficial for them. The mean value of the satisfaction level is 2.74 and the standard deviation is 0.636. The cost of travel varies from 10 takes to 20 takas. About 28 percent of commuters said satisfaction level is very good and satisfaction level of 43 percent of a respondent is good. No respondent said their satisfaction level is poor. The mean value of the satisfaction level is 3.99 and the standard deviation is .756. Overall Satisfaction is 2.87 that means, they are not satisfied with the Bus Facility. They wanted to improve not only the Bus facility but also the entire transportation system. Overall Skewness is 0.066 which indicate that the dataset is positively skewed but close to zero that means the amount of lower value are higher and higher value are fewer and the mean is greater than the mode. Overall Kurtosis is - 0.1636 which indicates that the distribution of data is Platykurtic and the distribution is close to the normal distribution. All of the Parameters indicate that the data is reliable.
Conclusion
The analysis presented in this paper has provided useful insights into the trip making behavior of commuters, particularly with respect to trip and demographic characteristics - and mode switching behavior of the commuters. The main objective of the research is to identify the factors that influence the modal choice of the commuters. And the study also tries to find out satisfaction level of commuters on their frequently used mode by its second objective. Nevertheless, the insights obtained appear reliable and complementary to other findings in the limited body of knowledge available on commuting behavior. It is hoped that this analysis will provide insight into the interaction between the choices. With increasing concern for urban and suburban congestion in cities worldwide and interest in the potential of advanced technologies and to prevent Rajshahi city from congestion like Dhaka city, it appears that further attention should be directed at commuting and trip making behavior.
References
- Asensio J (2002) Transport Mode Choice by Commuters to Barcelona's CBD. Urban Studies 39(10): 1881-1895.
- Khan O (2007) Modelling Passenger Mode Choice Behavior Using Computer Aided Stated Preference Data. Doctor of Philosophy. School of Urban Development. Queensland University of Technology, Australia
- Crisalli U, Gangemi F (1997) The access/egress mode choice to Railway Terminals. Third International Conference on Urban Transport and the Environment for the last 21st Century, Italy.
- Oliver RL (1993) Cognitive Affective and Attribute Biases and the Satisfaction Response. Journal of Consumer Research 20(3): 418-430.
- Mackay K, Crompton J (1990) Measuring the Quality of Recreation Services. Journal of Park and Recreation Administration 8(3): 47-56.
- Oliver RL (1981) Measurement and Evaluation of Satisfaction Process in Retail Settings. Journals of Retailing 5: 25-48.
- Haemoon Oh, Parks SC (1996) Customer Satisfaction and Service Quality: A Critical Review of the literature and Research Implication for the Hospitality Industry. Hospitality Research Journal 20(3): 35-64.
- Ronald E Goldsmith (1997) Anton J (1996) Customer Relationship Management: Making Hard Decisions with Soft Numbers. Journal of Leisure Research 29(3): 355-358.
- Lukic V (2012) Economic Profile of Serbian Commuter. The Ministry of Education and Science of Republic of Serbia. Industrija 40(2).
- Bhat C, Srinivasan S (2005) A multidimensional mixed ordered-response model for analyzing weekend activity participation. Transportation Research Part B Methodological 39(3): 255-278.
- Vanwee B, Holwerda H (2006) Preferences for Modes, Residential Location and Travel Behaviour: The Relevance for Land-Use Impacts on Mobility.
- Scheiner J (2010) Interrelations between travel mode choice and trip distance: trends in Germany 1976- 2002 Journal of Transport Geography 18(1): 75-84.
- St Louis E, Manaugh K, van Lierop D, El Geneidy A (2014) The happy commuter: A comparison of commuter satisfaction across modes. Transportation Research Part F: Traffic Psychology and Behaviour 26: 160-170.
- Witchayangkoon B, Sirimontree S, Buddhwana S, Lertpocasombut K (2014) Roles of Bangkok Vanpool Commuter Services towards Livable City. International Transaction Journal of Engineering, Management, & Applied Science & Technologies 6(1): ISSN 2228-9860.
- Arasan V T, Rengaraju V R, Rao K V K (1994) Characteristics of Trips by Foot and Bicycle Modes in Indian City. Journal of Transportation Engineering 120(2).
- Li X, Tian X, Li X (2016) Multi-mode Choice Behavior for Passenger in Comprehensive Transportation Corridor. Procedia Engineering 137: 849-857.
- Community Series, Population Census of Bangladesh 2011. Bangladesh Bureau of Statistics.
- Coster J, Cathain A, Nicholl J , Salisbury C (2009) User Satisfaction with Commuter Walk-in Centers. British Journal of General Practise 59(569): e390-e393.
- Oliver R L, Swan J E (1989) Consumer Perception of Interpersonal Equity and Satisfaction in Transactions: A Field Survey Approach. Journal of Marketing 53: 1-21.

Top Editors
-

Mark E Smith
Bio chemistry
University of Texas Medical Branch, USA -

Lawrence A Presley
Department of Criminal Justice
Liberty University, USA -

Thomas W Miller
Department of Psychiatry
University of Kentucky, USA -

Gjumrakch Aliev
Department of Medicine
Gally International Biomedical Research & Consulting LLC, USA -

Christopher Bryant
Department of Urbanisation and Agricultural
Montreal university, USA -

Robert William Frare
Oral & Maxillofacial Pathology
New York University, USA -

Rudolph Modesto Navari
Gastroenterology and Hepatology
University of Alabama, UK -

Andrew Hague
Department of Medicine
Universities of Bradford, UK -

George Gregory Buttigieg
Maltese College of Obstetrics and Gynaecology, Europe -

Chen-Hsiung Yeh
Oncology
Circulogene Theranostics, England -
.png)
Emilio Bucio-Carrillo
Radiation Chemistry
National University of Mexico, USA -
.jpg)
Casey J Grenier
Analytical Chemistry
Wentworth Institute of Technology, USA -
Hany Atalah
Minimally Invasive Surgery
Mercer University school of Medicine, USA -

Abu-Hussein Muhamad
Pediatric Dentistry
University of Athens , Greece

The annual scholar awards from Lupine Publishers honor a selected number Read More...


