Lupine Publishers Group
Lupine Publishers
Menu
ISSN: 2637-4609
Research Article(ISSN: 2637-4609) 
Wetland Conservation and Protection; Implications for Sustainable Flood Disaster Management in a Critical Urban Fringe Area of Port Harcourt Volume 2 - Issue 3
Umeuduji JE, Chuku C* and Chukwu Okeah GO
- Department of Geography and Environmental Management, University of P ort Harcourt, Nigeria
Received: March 19, 2018; Published: March 27, 2018
*Corresponding author: Chuku C, Department of Geography and Environmental Management, University of Port Harcourt, Nigeria
DOI: 10.32474/AOICS.2018.02.000136
Abstract
The study investigated the perception of indigenous people to wetland conservation and protection in Rumuagholu community in Obio/Akpor L.G.A of Rivers State. Experimental and survey research design were adopted in the study. Three hundred and sixty two respondents were randomly selected as the sample size for the study. Data for the study were collected using questionnaire while field measurements were obtained through satellite imagery as to ascertain the extent of wetlands in the community before and presently. Tables were used in the presentation of the result of the study. The study revealed that the people in the area do not practice wetland conservation and protection, Wetland distribution in Rumuagholu community has both spatial and temporal variation. It also revealed that wetland within the period of the study lost 10.64% its original state moving from 11km2 to 6km2 and that Loss of biodiversity in the Rumuagholu Community is a major effect of wetland loss. The study recommended the need to encourage effective urban planning mechanism that will help curtail the excessive use of wetlands, and that Government should as a matter of urgency buy up the remaining wetlands to forestall its conversion to other uses because of its role in flood management and water provision as well as eco tourism.
Keywords: Wetland; Conservation; Protection; Flood; Disaster; Management
Introduction
Wetland ecosystems are the most diverse and productive ecosystems on Earth and includes marshes, lakes, rivers flood basin, ponds, estuarine deltas, rice filed marine water areas where the depth at low tide does not exceed 6m (convention on wetland 1971) as cited in Wonodi [1]. Wetlands are important elements of Nigeria's watershed systems [2-4]. A great deal of the hydrological and water resources problems currently experienced in Nigeria are the resultant effects of wetland degradation in the country. The challenges posed by the degradation can better be understood and better appreciated when viewed against the backdrop of the benefits derivable from the wetlands. The current use and management of water and wetland resources is dominated by the construction of large dams to store much of the available water for hydropower, irrigation and urban water supply. This practice, which serves to exacerbate the climate variability and change impacts, has often left too little for maintaining the traditional wetland function downstream and caused significant stream flow regime change in most of the major wetlands in Nigeria.
Wetlands are among the most productive ecosystems in the world; compared to rain forest and coral reefs. It is widely recognized that wetlands provide several ecosystem services that contribute to human well-being. The major ecosystem that wetlands provide include fish, fiber, water supply, water purification climate regulation, flood regulation, coastal protection, recreational opportunities and tourism in [5]. According to the United States Environmental Protection Agency (USEPA), 2016, wetlands are among the most productive ecosystems in the world, comparable to rain forests and coral reefs. An immense variety of species of microbes, plants, insects, amphibian's reptiles, birds, fish and mammals can be part of a wetland ecosystem. Physical and chemical features such as climate, landscape shape, geology, the movement and abundance of water help to determine the plants and animals that inhabit each Wetland which play very important role in the overall functioning of the ecosystem.
Problem statement
Population growth and associated anthropogenic interferences have depleted the rate of flow of ecosystem services. The loss of ecosystem services damages the health and well-being of individuals and local communities and diminishes their development prospects [5]. The rate at which wetlands are converted to other uses without recourse to their value in recent time has become an issue of global concern. This problem is of serious concern to many countries where ethnic communities are highly dependent on wetland resources. The problem is particularly severe in countries that have weak policy and management strategies, negatively affecting the conservation and protection of wetlands. The destruction of wetlands has devastating effect on both man and environment, this is because wetlands play important role in the control of flooding and erosion which cannot be underestimated as these provides avenue for the discharge and control of excess water on the face of the earth, thereby helping to protect man's environment.
UNEP (2007) alerts that globally, wetlands have been reduced by 50%. It is estimated that one third of all endangered species are dependent on wetlands [3]. Though, Nigeria contributes less to the global green house effect, the country remains the most vulnerable to the adverse effects of global warming and climate change [6]. Climate change is expected to impact adversely on wetland functions through change in hydrology, biogeochemistry and biomass accumulation. Particularly, climate change is expected to cause melting of sea ice, rise in sea levels, change in oceanic circulation patterns, species extinction, salt water intrusion, loss of habitat, higher storm frequency and intensity, flooding in the coastal regions, amongst others [7]. The combined adverse effects of mineral exploitation and climate change are enormous, hence the need for serious studies to protect wetlands. Strategy for preparedness and adaptation to impacts of climate change on water resources and wetlands is very desirable. Population growth and associated anthropogenic interferences has also depleted the rate of flows of ecosystem services with these devastating activities on the increase wetlands are at risk of total extinction. Orji [8] stated that "the values attached to wetlands where they exist are due to the role it plays in the promotion of ecological balance and biodiversity existence".
According to Obiefuna [9] "Wetlands also provides ecological services and goods without which hitch to the ecosystem and human habitation, which helps in flood water storage and distribution alongside recharging of the aquifer and improvement of water quality, its aesthetic value and others". Mitsch [10] assert that in absence of Wetlands, access to potable water in many nations of the world will be highly expensive since it will require treatment of water before use, hence leading to increase poverty and inaccessibility to potable water". The destructive activities on wetlands have also given rise to floods, which have become more devastating to communities where the Wetlands have been destroyed and also leading to displacement of animals, food supplies along with livelihoods. Noting the importance of wetlands, in relation to man’s continuous existence, there is need to conserve, preserve and protect ecosystem from complete loss, hence this necessitated the need for this study which is to examine the perception of indigenous people to Wetland conservation and protection in Rumuagholu Community in Rivers State. Arising from the above the study set out to achieve the following objectives;
a) Ascertain the level of awareness of wetland conservation and protection in Rumuagholu Community.
b) Ascertain the extent of wetland conservation and protection in Rumuagholu.
c) Identify the factors affecting the conservation and protection of Wetlands in Rumuagholu community.
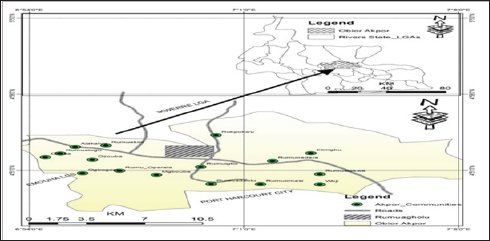
Find out the effect of the non conservation and protection of Wetland on the people of Rumuagholu community (Figure 1).
Figure 1: Obio/Akpor L.G.A Showing Rumuagholu community.
Materials and Methods
The study adopted the experimental and survey research design in the conduct of the study; here questionnaire was used alongside (GIS) satellite imageries of the area for 1986 and 2016 which were used and classification done to ascertain the extent of wetland loss in the area as the instrument for data collection. A total of 362 respondents were sampled from the three sub communities that make up the community as the sample population for the study. The Data for this study was presented using tables and maps.
Results and Discussion
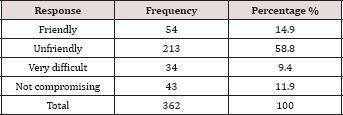
The result of the study is presented in tables and discussed alongside (Table 1). This is as shown below; In response to knowledge about wetland conservation and Protection, 119 respondents representing 32.9% of the study population stated that they have knowledge while 243 respondents representing 67.1% of the population said they do not have. As revealed on (Table 2), the practice of wetland conservation and protection in the area is quite not known this as reported shows that 65 respondents representing 17.9% of the study population agreed to the practice while 297 respondents representing 82.1% of the study population agreed that wetland conservation and protection is not practiced in the area (Table 3). The attitude of the people towards wetland conservation and protection revealed that 54 respondents representing14.9% of the population have a friendly attitude towards wetland conservation and protection, 213 respondents representing 58.8% of the population have an unfriendly attitude towards wetland conservation and protection, also 34 respondents representing 9.4% of the population have a very difficult attitude towards wetland conservation and protection and lastly, 43 respondents representing 11.9% of the population have a non compromising attitude towards wetland conservation and protection.
Table 1: Knowledge about Wetland Conservation and Protection.

Source: Researchers field Work (2017).
Table 2: Practice of Wetland Conservation and Protection is done in the area.

Source: Researchers field Work (2017).
Table 3: Attitude towards wetlands Conservation and Protection.
Source: Researchers field Work (2017).
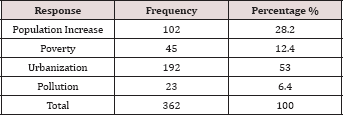
Factors responsible for Wetland loss in the community as revealed on (Table 4) showed that a total of 102 respondents accounting for 28.2% identified population increase as a factor responsible for wetland loss. 45 respondents representing 12.4% of the population identified that poverty is a factor responsible for wetland loss. Urbanization was also identified by 192 respondents representing 53% as the factor responsible for wetland loss in the area. Lastly pollution inputs into wetland were identified by 23 respondents representing 6.4% as the factor responsible for wetland loss in the area. The major cause of wetland loss in the study area as revealed on (Table 5) showed that 102 respondents representing 28.1% of the study population agreed that lumbering was the major cause of wetland loss in the area. 237 respondents representing 65.5% of the population agreed that urbanization is the major cause of wetland loss in the area
Table 4: Factors responsible for Wetland loss in the Area.
Source: Researchers field Work (2017).
Table 5: Major cause of Wetland loss in the Area.

Source: Researchers field Work (2017).
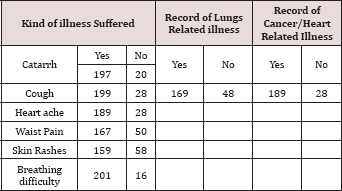
On the effect of wetland loss on the community as revealed on (Table 6) showed that 126 respondents representing 34.8% of the study population identified that loss of biodiversity was an effect of wetland loss on the community. Loss of the artistic beauty of the area revealed that 87 respondents representing 24% agreed to this emphasizing that loss of the artistic beauty is an effect of wetland loss in Port Harcourt. 78 respondents representing 21.5% of the study population agreed that the effect of wetland loss in Port Harcourt is urban flooding which generates stagnant waters, hence sets in increase in mosquito in the area. Loss of livelihood sources was also identified as one of the effect of wetland loss in the area, here 71 respondents representing 19.6% of the study population agreed.
Table 6: Effect of Wetland Loss on the Community.
Source: Researchers field Work (2017).
Distribution of Wetland in Rumuagholu in 1986
From the classified satellite imagery obtained for this study, three land cover types were identified which are, the urban, wetland and vegetation. As observed from Figure 2, it is seen that within the period 1986, the presence of all the land cover was much. In this case the urban accounted for 17.02% of the total area, wetland accounted for 23.04% and vegetation accounted for this accounted for 59.57% of the total land area. The spread of the different land cover type could be seen virtually in every part of the community as seen in the satellite imagery in parchments (Table 7).
Figure 2: Land Cover Map of Rumagholu Community 1986.
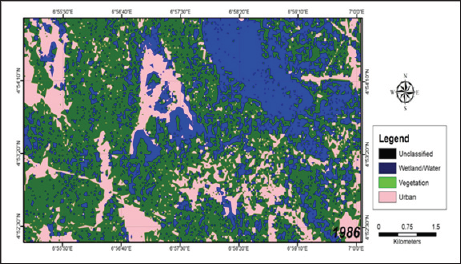
Table 7: Distribution of Wetlands in Rumuagholu in 1986.

Source: Researchers field work (2017).
Distribution of Wetland in Rumuagholu in 2016
In the year 2016, the distribution of wetland as observed from Figure 3, revealed that urban space increased accounting for a 29.88% increase, the wetland s reduced in the year 2016, from 23.40% of the total land area to 12.8% accounting for a loss of 10.6% of its original size in 1986 as compared to 2016. The case of vegetation as a land cover class was not different from that of the wetland area. 2016 land cover classification for vegetation revealed that vegetation reduced from 59.57% in 1986 to 38.2% accounting for 21.37% loss in the area. As also revealed, the wetlands were more spread within the Northern axis of the city than the Northern axis of the city in the case of both the forested and the non forested wetlands (Table 8). The non forested which is more in abundance in North accounted for 72.63km2 of the total land area representing 40.62% of the total wetland in the area while the forested wetland which is more pronounced in the southern axis accounted for 106.15km2 of the total land area representing 59.37%. Hence, the extent of distribution in space was less as compared to that of the 1986 where virtually every area had a parchment of either the forested or the non forested wetland. This is as shown in the table below.
Figure 3: Land Cover Map of Rumagholu Community 2016.
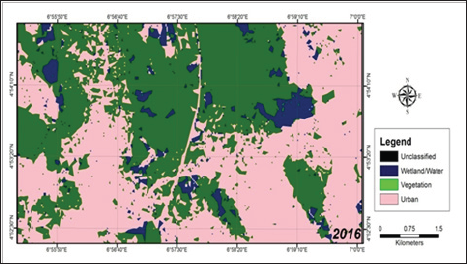
Table 8: Distribution of Wetlands in Rumuagholu in 2016.

Wetland Changes and Loss in Rumuagholu from 1986 to 2016
Land cover analysis for wetland changes and loss in Port Harcourt between 1986 and 2015, reveals that for the forested Wetland, from the analysis the year 1985 had a total coverage area of 121.58 km2 representing 19.23% of the total area (Table 9). The year 2000 which is fifteen years after had a total of coverage area of 106.15km2 representing 16.79% of the total area. In The forested wetland also for the year 2015, revealed that the area covered a total of 78.81km2 representing 12.47%. In the case of Non forested wetland, in the year 1985 had a total coverage area of 106.08 km2 representing 16.78% of the total area. The year 2000 which is fifteen years after had a total coverage area of 72.63 km2 representing 11.49% of the total area, the year 2015, revealed that non forested wetland had an area coverage of 53.69 km2 representing 8.50% of the total area. Water bodies as revealed showed that in the year 1985 had a total coverage area of 226.02km2 representing 35.75% of the total area. The year 2000 which is fifteen years after had a total coverage area of 197.9 km2 representing 31.30% of the total area, the year 2015, revealed that water bodies had an area coverage of 183.31 km2 representing 28.99% of the total area.
Table 9: Land Cover of Rumuagholu within 1986 to 2016.

Source: Researchers analysis (2016).
Other uses which include other land cover as revealed showed that in the year 1985 had a total coverage area of 178.53km2 representing 28.24% of the total area. The year 2000 which is fifteen years after had a total coverage area of 255.53km2 representing 40.42% of the total area, the year 2015, revealed that other uses had an area coverage of 316.4km2 representing 50.04% of the total area. This is as shown on the tables below from (Table 10) above, wetland loss and changes in Port Harcourt from 1985 to 2015, respectively, the following results were obtained. Forested wetland with 121.58km2, 106.15 and 78.81km2 recorded -42.77km2 change in area extent during a period of 30 years and a -6.77% change. The Non forested Wetland had 106.08km2, 72.63km2 and 53.69km2 and recorded -52.39 km2 change in area extent with -8.29% change. The Water Bodies had 226.02km2, Table 10: Wetland Loss and Changes in Rumuagholu within 1986 197.9km2 and 183.31km2 and recorded -42.71km2 change in area extent with -6.76% change. Other uses had 178.58km2, 255.53 km2 and 316.4km2 and recorded 137.9km2 change in area extent with 21.8 % change. The findings arising from this study includes the following;
Table 10: Wetland Loss and Changes in Rumuagholu within 1986 to 2016.

Source: Researchers analysis (2016).
a) Wetlands distribution in Port Harcourt has both spatial and temporal variation.
b) Forested wetland was more in the Southern part of Port Harcourt than in the Northern part.
c) Forested wetland within the period of the study lost 42.77km2 of its original state.
d) The Non-forested wetland lost 52.39km2 of its original size from 1985-2015.
e) A total of 95.16km2 of wetland both forested and non-forested was lost within 1985-2015.
f) Population increase and urbanization are the factors mainly responsible for wetland loss in Port Harcourt.
g) Consistent flooding in the city of Port Harcourt is as a result of wetland loss.
Conclusion and Recommendations
The study revealed the extent of changes in land cover from 1985-2016 with emphasis on wetlands. Wetland as observed have both spatial and temporal variations but it is of much importance to mention that wetlands in Port Harcourt are diminishing at a very fast rate. The study have also shown that within the period under review there is concrete evidence of wetland loss which have its effect resulting in flooding within the city as the wetland which usually serves as a reservoir has reduced and hence in effective to render this service.
Arising from the findings of this study, it is therefore recommended that;
a) Proper enlightenment and education to the people of Port Harcourt should be done on the importance of Biodiversity, tourism management, forest resources and wetlands functions and the need for its conservation and management.
b) Wetlands management and conservation board should be set up as a means to harnessing it benefits and reducing its degradation.
c) Efforts should be geared towards proper urban planning and management for effective housing provision instead of the conversion of wetlands.
References
- Wonodi C (2016) Analysis of wetland dynamics in Port Harcourt. An unpublished M.Sc Dissertation, submitted to the department of Geography and Environmental Management, University of Port Harcourt.
- Oluocha NO, Okeke IC (2004) Implications of wetlands, degradation for water resources management: lessons from Nigeria. Geojournal 16(2): 151-154.
- Asibor G (2009) Wetlands: values, uses and challenges. A paper presented to the Nigerian environmental society at the petroleum training institution. Nigeria.
- Chidi OH, Ominigbo OE, (2010) Climate changes and coastal wetlands: Nigeria in perspective. International Journal of environmental issues 7(2): 21-223.
- Millennium Ecosystems Assessment (2005) Ecosystems and human wellbeing: wetland and synthesis. World Resources.
- Bonfis L, Pascale Braconnot, Nathalie de Noblet, Sylvie Joussaume (2001) Hot desert albedo and climate change: mid,’ 1-tolocene monsoon in North Africa. International journal of climate change 4: 3724-3737.
- Dietrich V (2005) Biodiversity and climate change Asian/institute of technology press.
- Orji G, Pepple GT (2015) Wetland Inventory and Mapping for Ikorodu Local Government Area, Lagos. Sofia, Bulgaria, 17-21.
- Obiefuna JN, Nwilo PC, Atagbaza AO, Okolie C (2013) Spatial changes in the wetlands of Lagos/Lekki. Journal of Sustainable Development vol 6.
- Mitsch W, Gosselink JG, Tore Soderqvist, Kerry Turner R (2007) The values of wetlands: landscapes and institutional perspectives. Ecological Economics 35 (200) 25-33.

Top Editors
-

Mark E Smith
Bio chemistry
University of Texas Medical Branch, USA -

Lawrence A Presley
Department of Criminal Justice
Liberty University, USA -

Thomas W Miller
Department of Psychiatry
University of Kentucky, USA -

Gjumrakch Aliev
Department of Medicine
Gally International Biomedical Research & Consulting LLC, USA -

Christopher Bryant
Department of Urbanisation and Agricultural
Montreal university, USA -

Robert William Frare
Oral & Maxillofacial Pathology
New York University, USA -

Rudolph Modesto Navari
Gastroenterology and Hepatology
University of Alabama, UK -

Andrew Hague
Department of Medicine
Universities of Bradford, UK -

George Gregory Buttigieg
Maltese College of Obstetrics and Gynaecology, Europe -

Chen-Hsiung Yeh
Oncology
Circulogene Theranostics, England -
.png)
Emilio Bucio-Carrillo
Radiation Chemistry
National University of Mexico, USA -
.jpg)
Casey J Grenier
Analytical Chemistry
Wentworth Institute of Technology, USA -
Hany Atalah
Minimally Invasive Surgery
Mercer University school of Medicine, USA -

Abu-Hussein Muhamad
Pediatric Dentistry
University of Athens , Greece

The annual scholar awards from Lupine Publishers honor a selected number Read More...


