Lupine Publishers Group
Lupine Publishers
Menu
ISSN: 2637-4609
Research Article(ISSN: 2637-4609) 
Thermodynamic and Spectroscopic, Characterization of A Weakly Polar Liquid Crystalline Compound Influenced Polyvinyl Pyrrolidone Capped Gold Nanoparticles Volume 5 - Issue 3
Bhupendra Pratap Singh1, Samiksha Sikarwar2, Shivangi Tripathi1, Rajiv Manohar1* and Kamal Kumar Pandey3*
- 1Liquid Crystal Research Laboratory, Department of Physics, University of Lucknow, India
- 2School of Physical and Decision Sciences, Babasaheb Bhimrao Ambedkar University, India
- 3Shri JNMPG College, India
Received:June 24, 2021 Published:July 23, 2021
*Corresponding author:Kamal Kumar Pandey, Rajiv Manohar, Shri JNMPG College, India. Liquid Crystal Research Laboratory, Department of Physics, University of Lucknow, India
DOI: 10.32474/AOICS.2021.05.000214
Abstract
The dispersion of colloidal polyvinyl pyrrolidone (PVP) capped gold nanoparticles (GNPs) in an azoxybenzene-based nematic liquid crystal (NLC), namely 4,4’- di pentyl azoxy benzene (D5AOB) has been studied. The present study reported the differential scanning calorimetry (DSC), polarized light microscopy, UV-Vis’s absorption spectroscopy, photoluminescence (PL) and Fouriertransform infrared spectroscopy (FTIR) of GNPs doped NLCs. Three different concentrations of GNPs have been dispersed in pure D5AOB viz 0.25, 0.5, and 1.0 wt%. It has been observed that, with the increase the GNPs concentration, crystal to nematic phase (Cr-Ne) transition temperature does not change sufficiently but nematic to isotropic temperature decrease significantly. This study reported that the 76% and 46% enhancement of UV-Vis’s absorbance and photoluminescence (PL) intensity respectively with the suitable amount of GNPs dispersion in D5AOB. The increase in the surface area of GNPs has been attributed to increase in the PL intensity, resulting in increased emissions due to increased scattering of excitation.
Keywords:Colloidal gold nanoparticles; Nematic liquid crystals; Differential Scanning Calorimetry (DSC); UV-Vis’s absorbance; Photoluminescence; Fourier Transform Infrared Spectroscopy (FTIR).
Introduction
Liquid crystals (LC) are the organic molecules charming and mysterious in nature. Part of their attraction comes from the magic phenomena of their dance with light. Nematic liquid crystals (NLCs) have rich properties about their fundamental and practical applications [1-6]. Dispersing of inorganic nanoparticles (NPs) (metallic and non-metallic) in liquid crystals (LCs) had been employed for the significant changes in the electro-optical and spectroscopic properties of mesogens. LCs are unique materials with extraordinary, electro-optical and dielectric properties, which are widely used in storage and display devices. A variety of nanoparticles have been used to further enhance the fundamental properties of NLCs. It has been shown that by dispersing NPs in LCs, the dielectric and electro-optical parameters can be enhanced and tuned. Recently, NPs have been of significant interest to the display industry for their potential to influence device applications because of their unique electrical [7] and optical [8-10] properties. Many researchers had executed numerous types of NPs such as ZnO, TiO2, Fe2O3 [11-13], carbon nanotubes (CNTs) [14-16] and quantum dots (QDs) [17-19] dispersed in LC. They had studied the LC polymer with the dispersion of gold nanoparticles (GNPs) for refining the alignment of molecules and found the remarkable change in optical and optomechanical properties [20]. Gharbi et al. [21] studied the blue phase (BP) LC with the dispersion of cubic crystal GNPs and observed that the addition of the functionalized GNPs lowers the transition temperatures. They had found a wide range of BP with the dispersion of GNPs. The impact of gold nanorods (GNRs) on the dielectric and electro-optic properties of the ferroelectric liquid crystal (FLC) had also been examined [22]. It was reported that the dispersion of GNRs in FLCs lead to an increase of the internal electric field in the LC layer. The switching time and rotational viscosity decreased with the addition of GNPs in pristine FLC. A remarkable improvement in the electro-optical parameters of a polymer-dispersed liquid crystal (PDLC) with the dispersion of 12 nm diameter size of spherical GNPs [23]. Optical transmission of PDLC is increased at certain voltage and frequency with the suspension of GNPs. However, the different shape, size, and nature of NPs dispersed in LCs can capture the ions, enhance the alignment, and tune the properties of LCs [24-29]. Many researchers have been reported the effects of NPs on the properties of nematic, and the remarkable experimental results were used in the development of display technology. In this way, good quality devices with faster switching [30, 31] and low power consumption [32, 33] as explained by the screen effect mechanism [34, 35] were produced.
Despite the progress towards understanding the NP-NLC composites, the effect of NLCs on the skin depth, optical density, stretching frequency corresponding to different groups/chains etc, thermal ordering of molecules, transmittance of light vector and photoluminescence as a function of the GNPs concentration, relative to the LC director have not been systematically studied in detail. This paper describes the results of our investigations of the thermodynamic and spectroscopic parameters of weakly polar nematic LC 4,4’- di pentyl azoxy benzene (D5AOB) with the dispersion of GNPs at the different concentrations. The excellent optical properties have been observed as enhanced UV-Vis’s absorbance, optical density, and photoluminescence as well as lower skin depth of weakly polar nematic LC in the presence of GNPs. These properties can play the key role for the development of potential optical devices and optical sensors. There are also changes in vibrational band in skeletal vibrations in the fingerprint region that may be useful in electro-optic as well as photonic applications.
Materials
In the present work, we have used 4,4’- di pentyl azoxy benzene (D5AOB) LC (Frinton Laboratories, USA) as a host material and GNPs as a guest material in nano-nematic composites. The D5AOB LC has negative dielectric anisotropy (Δε = 0.30) nature and phase sequence exhibits as Crystal ↔ 22ºC↔ Nematic (N) ↔ 65ºC ↔ Isotropic (I). The molecular structure of D5AOB is shown in Figure1. The dialkylazoxy benzenes (DnAOB) are approximately symmetric in the central part as well as symmetric at the end groups with a non-polar conformation. LC molecules have an advantage in the structure of D5AOB, which is the deviation of the long molecular axis from the direction of the magnetic field orientation. The magnitude of the dipole moment and angle between the dipole and long molecular axis of D5AOB is 1.70 D and 64.9º, respectively [36]. Experimental measurements were performed on the suspension of the D5AOB nematic LC dispersed with polyvinyl pyrrolidone (PVP) functionalized GNPs. In this work, we have used GNPs are spherical in shape and having a diameter of 13±2 nm with UV absorption peak at 530 nm [37].
Dispersion of Gold NPs in D5AOB liquid crystal:
Three proper concentrations (0.25%, 0.5% and 1.0% wt/wt) of GNPs were dispersed with a fixed weight of pure D5AOB LC to form nano-nematic composites. The proper dispersion of NP in nematic LC was performed by the ultrasonication method. Polarized optical micrographs have been taken to ensure homogeneous dispersion of GNPs in nematic LC. Calibrated sample cells were filled with pure D5AOB and nano-nematic composites. The filled sample cells are heated from isotropic to room temperature for a couple of minutes.
Characterization of pure and nano-nematic composites:
The thermodynamic study has been carried out with the help of differential scanning calorimeter (DSC) of NETZSCH model DSC- 200-F3-Maiahaving temperature range from 170°C to 600°C (with an accuracy of 0.1 K) is used to study the phase transition scheme of pure LC and its composites. Phase transition temperature Tr(°C), phase transition enthalpy ΔH (joule/gm) and phase transition entropies ΔS (joule/gm°K) for both Isotropic to nematic and nematic to crystalline state calculated from DSC thermograph for pure and GNPs doped systems in cooling cycle at the scan rate of 5°C/min in sample mode. ELICO double beam UV-VIS spectrophotometer SL 210 has been used to study the UV-visible absorption spectrum of pure LC and its composites. It is a double beam spectrophotometer with 1.8 nm bandwidth having a wavelength range from 190 nm to1100 nm. The instrument consists of pre aligned Deuterium Lamp (D2), Tungsten (W) Halogen Lamp along with Silicon photodiode as the detector. Concave holographic grating with 1200 lines/mm is used as monochromator in this instrument. It has an accuracy of ± 0.5nm. Quartz cuvettes of 10 mm path length are utilized to execute the measurement. AGILENT Fluorescence spectrophotometer have been used to study the photoluminescence spectrum of pure and GNPs doped systems. The instrument is equipped with Xenon lamp of power 13 Watt (Cathodeon AXE 3u), 80 flashes/second and pulse width ~2μsec. To get a high-quality data, a slit width arrangement of 5 nm has been used in this experiment. It also has a wide excitation range from 220-600 nm. A fiber-optic probe issued to measure the fluorescence in case of sample cell. All the measurements can be performed in scan mode by using cuvettes.
Fourier transform infrared spectroscopy (FTIR) is an ideal method to examine IR vibration bands. Shimazu IR Affinity-1 spectrophotometer has been used to record the IR spectra of LCs and its composites. The instrument has a high S/N ratio (≈30000:1) and a Michelson interferometer with 30° incident angle. In this study the scan wavenumber ranging from 450to 4000 cm-11with the resolution of 8 cm-1.
Results and Discussion
Differential Scanning Calorimetry (DSC) studies
DSC thermograms show interesting results (Figure 2). It has been observed that the height and width of the peaks for both nematic to isotropic phase transition temperature and nematic to crystalline state changes with the concentration of GNPs. Peak height has gradually decreased whereas width of the peak has increased in such a way that enthalpy change (ΔH) of the transition show continuous decrease (see Table 1) with the increasing concentration of GNPs. Here it is important to mention that ΔH for the nematic–crystal phase transition i.e., enthalpy of the crystallisation has also decreased with the increasing concentration of GNPs but here changes are small as compared to the nematic–Iso phase transition. Entropies of the transitions (ΔS) which represent change in order (or disorder) have also been determined for both phase transitions and are listed in (Table 1). While going from Cr to Iso phase, ΔH and hence ΔS is positive at transitions and consequently order is decreasing (or disorder is increasing) and is least (disorder is maximum) in the isotropic liquid phase. It is worth to mention that, in the case of pure nematic phase, ΔH for Iso–nematic phase transition is significantly large as compared to Iso–nematic phase transition of GNPs doped composites. It means pure D5AOBis highly ordered (rigid) structure as compared to GNPs doped composites which is also synchronised with our previously published work [3]. If we assume that Isotropic phase is completely disordered (it can be taken other way also i.e., crystal phase is perfectly ordered) then magnitude ΔH at Iso-nematic phase transition will yield relative order (rigidity) of the nematic phase as compared to that of the Iso phase. Low magnitude of ΔH will represent GNP doped nematic LC phase of low rigidity as compared to the pure D5AOB where ΔH is comparatively high at the Iso- nematic phase transition. For this reason, it can be assumed that 1.0 wt% GNPs doped composite phase i.e., 3rd composite has least rigid as compared to the pure D5AOB [38].
Figure 2: Differential scanning calorimetry (DSC) thermograms for the pure and dispersed samples during cooling cycle at the scan rate of 5°C min.
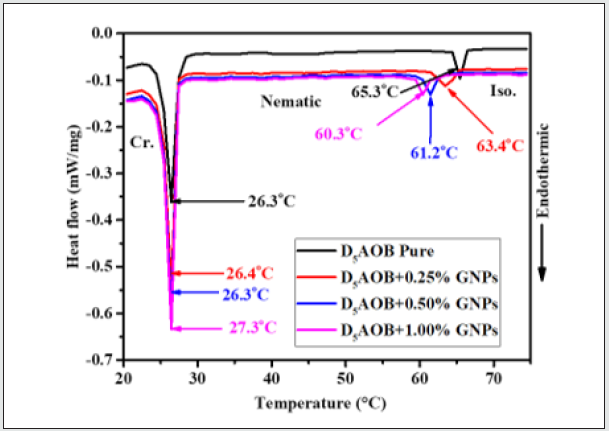
Table 1: The phase transition temperature Tr (°C), phase transition enthalpy ΔH (joule/gm), and phase transition entropies ΔS (milli- joule/gm°K), for both Isotropic to nematic and nematic to crystalline state calculated from DSC thermograph for pure and GNPs doped systems in cooling cycle at the scan rate of 5°C/min.

Optical study
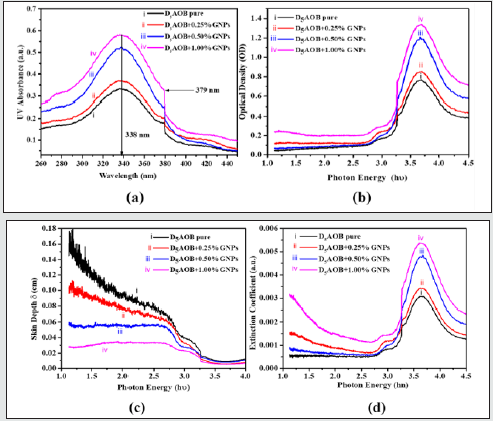
To design the potential photonic devices, the spectroscopic properties need much more attention. The interaction of photons with NLC molecules in presence of nano-environment plays a significant role in the fabrication of electro-optical applications. UV-Visible absorption spectra have been performed to observe the absorption of white light by pure nematic LC and nanonematic composites and shown in figure 3(a). From the figure, it has been found that absorption is higher for composite than pure nematic LC. The absorbance peak is found at 336 nm for pure and nano composites. It has been noticed that there is no shift in absorbance peak for nano composites. Maximum absorbance is found for 1.0% wt/wt nano-nematic composite system. A better explanation possibly is as follows: The strong band corresponding to the wavelength 336 nm (λ = 336nm) has good agreement with the mechanism of trans-cis isomerization, which is the main photochemical mechanism of azoxybenzene derivatives. Band corresponding to wavelength 336 nm can be assigned to π −π * transition of D5AOB trans-isomers same as the other materials of this class and it dominates at the room temperature. The increase in absorbance may be related to an increase in the n −π * absorption band of cis isomers, which is characterized by stronger absorption in this spectral region than trans-isomers [39]. The increase in absorption may also be due to the coupling between the light source and the electromagnetic radiation associated with the free electrons of the GNP. GNPs show different optical, electro-optical and chemical properties due to the number of free electrons in contrast to the bulk metal. An increment in the absorption is may also be due to surface plasmon resonance (SPR). The GNPs absorb most of the visible radiation. Due to strong interaction of visible radiation and free electrons cloud (which is on the outer boundary of the GNPs), indicating that there is a collective oscillation of free electrons. This phenomenon is called SPR. It depends on various parameters of the gold nanoparticles such as size, shape, dielectric constant as well as the surrounding medium [40]. Optical density, skin depth and extinction coefficient are the intrinsic optical properties of nematic LCs. Hence calculate them to explore those intrinsic optical features by using experimentally observed UVvis absorbance data. The systematic explanation perhaps is the following. Applying the Beer-Lambert Law, as follows:

In which,

Where, α signifies the absorption coefficient, t is the thickness of the LC layer in the sandwiched sample holder and A is the absorbance of the material. The optical density (OD) is defined as the absorption coefficient times thickness of LC layer i.e., OD = αt. An electromagnetic wave when passes through a system, it is constituting bulk NLC molecules reverberate at random frequencies, to resonate with travelling beam frequency. Throughout this vehement phenomenon, the energy profile is redistributed based on the vibrational frequency of the molecules. The re-emission of photonic energy during the vibrational motion of the molecules is called optical density of the material. The definition of OD signifies the higher the optical dense material slower the transmission of electromagnetic radiation through the medium. In the present investigation we observed the OD as 0.765, 0.852, 1.203 and 1.338 for pure, 0.25, 0.5 and 1.0 wt% GNPs doped nematic LC respectively see Figure 3(b). Penetration depth or skin depth is a measure of how deeply light can penetrate a medium. It is defined as the depth at which the optical density of photonic energy inside the medium falls to (about 37%) of its original value. Skin depth (δ) and the absorption coefficient (α) have inverse proportionally i.e., δ=1/α. Skin depth of pure and GNPs doped composite systems with the variation of photonic energy depicted in (Figure 3(c)). The figure confirms that the skin depth decreases with increase in the concentration of GNPs in nematic LC, which but obvious compliments the OD results. Hence the GNPs doped nematic LC composites behaves as shielding agent for the transmission of the electromagnetic radiation. Since, metals are conductors. Inside a conductor in electrostatic equilibrium, the electric field is equal to zero. So, metals act as protect shields and block electromagnetic radiations. But this is not only the reason if so then skin depth must be zero for GNPs. When frequencies get to the UV range, the particle properties of photons become important and you have the photoelectric effect, where photons have enough energy that when they deposit that energy in a metal it is sufficient to knock an electron out. One more thing we keep in mind there is very few numbers of GNPs (≤1 wt%) in LC media so the skin depth is not only corresponding to the metal NPs though LC-GNPs composite system [41].
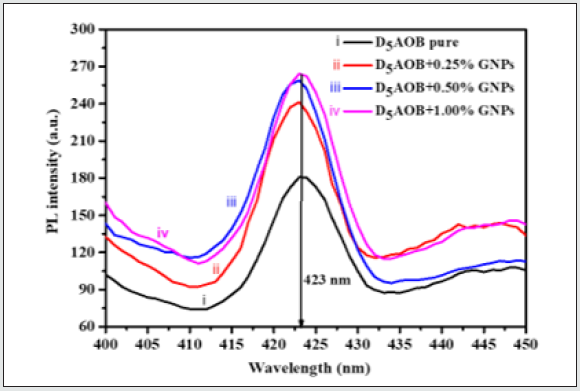
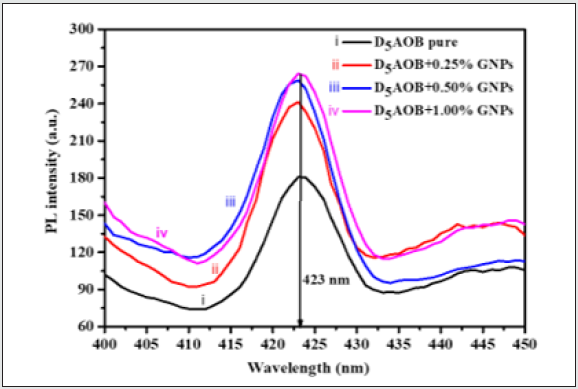
The extinction coefficient of pure and LC-GNPs composite system as a function of photonic energy shown in Figure 3(d). The extinction of attenuation coefficient is a measure of the damping of the electromagnetic wave as it passes into a medium. It comes out of the fact that the refractive index is complex and can be expressed as n-ik; where n is the real part of the refractive index (and tells us about velocity in the medium) and k is the extinction coefficient. The absorption coefficient α, allows us to measure how much light is absorbed and is related to k by α = 4π k /λ . It essentially the reciprocal of how far the light travels into the solid. Variation of photoluminescence (PL) intensity of the pure and dispersed system as a function of wavelength is shown in Figure 4. We have performed the experiment for the pure and nano-nematic composites at the room temperature (35°C). The spectrum of emissions is recorded at a steady wavelength of 336 nm and a slit width of 5 nm. As, we increase the concentration of GNPs in pure nematic LC, increased PL intensity has been observed. For pure, 0.25%, 0.5% and 1.0% wt./wt GNPs dispersed nematic LC, we have observed PL intensity 180 a.u., 264 a.u., 257 a.u. and 239 a.u., respectively. We observed no significant shift in the peak of PL emission spectrum and all the peaks of the pure and dispersed system are situated at 423 nm. The increase in PL intensity is due to the GNPs enhanced surface area, which strengthens the excitation beam’s numerous reflections and outcomes in the resonance effect of the local surface plasmon. This effect becomes more evident with appropriate dispersion of GNPs in the nematic LC [42].
We have performed the fourier transformed infrared spectroscopy (FTIR) for the pure and nano nematic composites to analyse the structural change and stability as well as the effect of GNPs on the nematic LC. Fig. 5 demonstrates the FTIR spectra at room temperature of the pure and nano-nematic composites. The intensity band corresponding to wave number 2800-3000 cm-1 is due to C-H stretch bond and it demonstrates that the GNPs evolve the CH/CH2/CH3 extending vibrations. The distortion corresponding to the 1300-1800 cm-1 wave number may be due to C=O/C=C=N bending. Here, we observe that this distortion is increased for NPs dispersed system, which signifies the interaction of GNPs with the single bond elements present in pure nematic LC. The frequencies in the range 1400-700 cm-1 are skeletal frequencies arises from linear chain structures in the molecule and hence different absorption band in the infra-red spectra. In this observation, we also discovered a tiny vibrational band in skeletal vibrations in the fingerprint region. In this region, we obtain the vibrational band owing to single bond bending; this may be due to C-O /C-N/C-C [42].
Figure 3: Variation of (a) UV-Vis absorbance with the variation of wavelength and (b) Optical Density, (c) Skin Depth and (d) Extinction Coefficient with the function of photon energy (hυ) for pristine D5AOB, 0.25%, 0.5% and 1.0% wt/wt GNPs dispersed NLC.
Conclusions
In present work, we examined the impact of PVP capped gold nanoparticles on the entropy, enthalpy, photoluminescence, UVVis’s absorbance and FTIR of nematic LC. Several interesting and significant results, such as variation of phase transition temperature, enthalpy, entropy, photoluminescence, UV-absorbance and FTIR of weakly polar nematic liquid crystal (D5AOB) with the variation of dopant concentration (PVP capped GNPs), are obtained in the present work. Skin depth, optical density and extinction coefficient has been thoroughly investigated. The results show that the increasing the concentration of GNPs (up to≤1wt%) in nematic LCs increases the optical density and consequently decreases the skin depth. This is the desirable to produce high quality optical sensors and optical devices. Nematic to isotropic phase transition temperature (TNI), enthalpy change (ΔH) and entropy change (ΔS) monotonically reduces with the addition of GNPs consequently the orientational order parameter of LC-GNPs composite decreases. Furthermore, photoluminescence, UV absorbance and FTIR of pure nematic LC have been significantly influenced by the presence of GNPs. The change in UV-Vis’s absorbance and photoluminescence intensity of LC-GNPs composite was also investigated and observed the 76% and 46% enhancement respectively (Figure 5). The increase in the surface area of GNPs has been attributed to increase in the PL intensity, resulting in increased emissions due to increased scattering of excitation. The FTIR analysis of LC-GNPs composite system reveals a tiny vibrational band in the skeletal vibrations in the fingerprint region which may be expedient in electro-optic as well as photonic applications.
Acknowledgments
The author B. P. Singh is sincerely thankful for the INSPIRE Program of the Department of Science & Technology (DST), New Delhi [No. DST/INSPIRE Fellowship/2016/IF160572] for providing financial assistance in the form of INSPIRE Fellowship. Dr Rajiv Manohar and Dr K. K. Pandey thankful to research and development planning, higher education department, Uttar Pradesh (India) government to provide the assistance in the form of research project.
Conflicts of Interest
The article is original and has been written by the stated authors who are aware of its content and approve its submission. This article has neither been published previously nor under consideration for the publication elsewhere. We also declare “No conflict of interest exists”.
References
- Coursault D, Grand J, Zappone B, Ayeb H, Levi G, et al. (2012) Linear Self-Assembly of Nanoparticles Within Liquid Crystal Defect Arrays. Adv Mater 24(11): 1461-1465.
- Singh BP, Huang CY, Singh DP, Palani P, Duponchel B, et al. (2021) Journal of Molecular Liquids 325: 115130.
- Singh BP, Sikarwar S, Agrahari K, Tripathi S, Gangwar RK, et al. (2021) Journal of Molecular Liquids 325: 115172.
- Hsu CJ, Singh BP, Antony M, Selvaraj P, Manohar R, et al. (2020) Liquid crystal lens with doping of rutile titanium dioxide nanoparticles. Optics Express 28(15): 22856-22866.
- Singh BP, Pathak G, Roy A, Hegde G, Tripathi PK, et al. (2019) Liquid Crystals 46 (2019) 1808.
- Misra AK, Tripathi PK, Pandey KK, Singh BP, Manohar R, et al. (2020) Journal of Dispersion Science and Technology 41: 1283.
- Garnett EC, Liang W, Yang P (2007) Growth and Electrical Characteristics of Platinum-Nanoparticle-Catalyzed Silicon Nanowires. Advanced Materials 19(19): 2946-2950.
- Shipway AN, Katz E, Willner I (2000) Nanoparticle arrays on surfaces for electronic, optical, and sensor applications. ChemPhysChem 1(1): 18-52.
- Kim DG, Kim SH, Ki HC, Kim HJ, Ko HJ, et al. (2010) Optical characteristics of surface plasmon resonance based on ZnO and metallic nanograting structures. SPIE 7608.
- Misra AK, Singh BP, Chandraker S, Pandey KK, Tripathi PK, et al. (2019) Optical Materials 93: 19.
- Yuan K, Li F, Chen L, Li Y, Chen Y, et al. (2012) Plasmonic–Molecular Resonance Coupling: Plasmonic Splitting versus Energy Transfer. The Journal of Physical Chemistry C 116(16): 14088-14095.
- Tang CY, Huang SM, Lee W (2011) Journal of Physics D: Applied Physics 44: 355102.
- Zhang W, Liang X, Li C, Li F, Zhang L, et al. (2018) Liquid Crystals 45: 1111.
- Wu Y, Cao H, Duan M, Li E, Wang H, et al. (2018) Liquid Crystals 45: 1023.
- Shukla RK, Chaudhary A, Bubnov A, Raina KK (2018) Multi-walled carbon nanotubes-ferroelectric liquid crystal nanocomposites: effect of cell thickness and dopant concentration on electro-optic and dielectric behaviour. Liquid Crystals 45(11): 1672-1681.
- Peterson MSE, Georgiev G, Atherton TJ, Cebe P (2018) Dielectric analysis of the interaction of nematic liquid crystals with carbon nanotubes. Liquid Crystals 45(3): 450-458.
- Doke S, Sonawane K, Raghavendra Reddy V, Ganguly P, Mahamuni S, et al. (2018) Low power operated highly luminescent ferroelectric liquid crystal doped with CdSe/ZnSe core/shell quantum dots. Liquid Crystals 45(10): 1518-1524.
- Shcherbinin D, Konshina E (2017) Ionic impurities in nematic liquid crystal doped with quantum dots CdSe/ZnS. Liquid Crystals 44(4): 648-655.
- Singh G, Fisch MR, Kumar S (2017) Tunable polarised fluorescence of quantum dot doped nematic liquid crystals. Liquid Crystals 44(3): 444-452.
- Chandran A, Prakash J, Gangwar J, Joshi T, Srivastava AK, et al. (2016) Low-voltage electro-optical memory device based on NiO nanorods dispersed in a ferroelectric liquid crystal. RSC Advances 6(59): 53873-53881.
- Gharbi MA, Manet S, Lhermitte J, Brown S, Milette J, et al. (2016) Reversible Nanoparticle Cubic Lattices in Blue Phase Liquid Crystals. ACS Nano 10(3): 3410-3415.
- Podgornov FV, Haase W (2018) Chiroptic response of ferroelectric liquid crystals triggered with localized surface plasmon resonance of achiral gold nanorods. Applied Physics Letters 112(2):
- Hinojosa A, Sharma SC (2010) Possible mechanism(s) behind recently observed effects of incorporating gold nanoparticles into a polymer-dispersed liquid crystal. Applied Physics Letters 97: 081114.
- Kaur S, Singh SP, Biradar AM, Choudhary A, Sreenivas K, et al. (2007) Enhanced electro-optical properties in gold nanoparticles doped ferroelectric liquid crystals. Applied Physics Letters 91(2):
- Wang L, Li Q (2016) Liquid-Crystal Nanostructures: Stimuli-Directing Self-Organized 3D Liquid-Crystalline Nanostructures: From Materials Design to Photonic Applications. Advanced Functional Materials 26(1): 1-2.
- Feng X, Sosa-Vargas L, Umadevi S, Mori T, Shimizu Y, et al. (2015) Discotic Liquid Crystal-Functionalized Gold Nanorods: 2- and 3D Self-Assembly and Macroscopic Alignment as well as Increased Charge Carrier Mobility in Hexagonal Columnar Liquid Crystal Hosts Affected by Molecular Packing and π–π Advanced Functional Materials 25(8): 1180-1192.
- Pezzi L, De Sio L, Veltri A, Placido T, Palermo G, et al. (2015) Photo-thermal effects in gold nanoparticles dispersed in thermotropic nematic liquid crystals. Physical Chemistry Chemical Physics 17(37): 20281-20287.
- Roy A, Singh BP, Yadav G, Khan H, Kumar S, et al. (2019) Effect of gold nanoparticles on intrinsic material parameters and luminescent characteristics of nematic liquid crystals.Journal of Molecular Liquids 295: 111872.
- Jayoti D, Malik P, AIP Conference Proceedings 1953 (2018) 100085.
- Garbovskiy Y (2016) Switching between purification and contamination regimes governed by the ionic purity of nanoparticles dispersed in liquid crystals. Applied Physics Letters 108 (12): 121104.
- Podgornov FV, Gavrilyak M, Karaawi A, Boronin V, Haase W, et al. (2018) Mechanism of electrooptic switching time enhancement in ferroelectric liquid crystal/gold nanoparticles dispersion. Liquid Crystals 45(11): 1594-1602.
- Scheffer TJ, Nehring J (2008) Accurate determination of liquid‐crystal tilt bias angles Journal of Applied Physics 48(5): pp. 1783.
- Yukou D, Naoki T (2007) Bulletin of the Chemical Society of Japan 80 (2007) 2446.
- Blake P, Brimicombe PD, Nair RR, Booth TJ, Jiang D, Graphene-based liquid crystal device. Nano Lett 8(6): 1704-1708.
- Baik IS, Jeon SY, Lee SH, Park KA, Jeong SH, et al. (2005) Electrical-field effect on carbon nanotubes in a twisted nematic liquid crystal cell. Applied Physics Letters 87(26): 263110.
- Oka A, G Sinha, C Glorieux, J Thoen (2004) Liquid Crystals 31: 31.
- Gangwar RK, Dhumale VA, Kumari D, Nakate UT, Gosavi SW, et al. (2012) Materials Science and Engineering: C 32: 2659.
- Mishra M, Kumar S, Dhar R (2014) Effect of dispersed colloidal gold nanoparticles on the electrical properties of a columnar discotic liquid crystal. RSC Advances 4(107): 62404-62412.
- Piryatinskiĭ YP, Yaroshchuk OV, Dolgov LA, Bidna TV, Enke D, et al. (2006) Fluorescence of the nematic liquid crystal 5CB in nanoporous glasses. Optics and Spectroscopy 100: 394-399.
- Choudhary A, Singh G, Biradar AM (2014) Advances in gold nanoparticle–liquid crystal composites. Nanoscale 6 (2014) 7743-7756.
- Roy A, Tripathi S, Mahabaleshwara M, Srinivasulu RK Gangwar, et al. (2020) Optimization of the dielectric and optical parameters of 1,2,4-oxadiazole ferroelectric mesophase with the suspension of PVP capped gold nanoparticles. Optical Materials 107: 110021.
- FXW, Robert M Silverstein, David J Kiemle (2005) Spectrometric identification of organic compounds. 7th (eds). John Wiley & Sons 1-512.

Top Editors
-

Mark E Smith
Bio chemistry
University of Texas Medical Branch, USA -

Lawrence A Presley
Department of Criminal Justice
Liberty University, USA -

Thomas W Miller
Department of Psychiatry
University of Kentucky, USA -

Gjumrakch Aliev
Department of Medicine
Gally International Biomedical Research & Consulting LLC, USA -

Christopher Bryant
Department of Urbanisation and Agricultural
Montreal university, USA -

Robert William Frare
Oral & Maxillofacial Pathology
New York University, USA -

Rudolph Modesto Navari
Gastroenterology and Hepatology
University of Alabama, UK -

Andrew Hague
Department of Medicine
Universities of Bradford, UK -

George Gregory Buttigieg
Maltese College of Obstetrics and Gynaecology, Europe -

Chen-Hsiung Yeh
Oncology
Circulogene Theranostics, England -
.png)
Emilio Bucio-Carrillo
Radiation Chemistry
National University of Mexico, USA -
.jpg)
Casey J Grenier
Analytical Chemistry
Wentworth Institute of Technology, USA -
Hany Atalah
Minimally Invasive Surgery
Mercer University school of Medicine, USA -

Abu-Hussein Muhamad
Pediatric Dentistry
University of Athens , Greece

The annual scholar awards from Lupine Publishers honor a selected number Read More...


