Lupine Publishers Group
Lupine Publishers
Menu
ISSN: 2637-4609
Review Article(ISSN: 2637-4609) 
Structures and Electrical Properties of Some Biologically Active Nucleic Acid Constituents Volume 3 - Issue 5
MS Masoud1*, MSh Ramadan1, AH Elsayed2, AM Sweyllam2 and MH Al-Saify3
- 1Chemistry Department, Faculty of Science, Alexandria University, Alexandria, Egypt
- 2 Physics Department, Faculty of Science, Alexandria University, Alexandria, Egypt
- 3 Sidi Kerir Petrochemicals Company, Alexandria, Egypt
Received: September 10, 2018; Published: September 25, 2018
*Corresponding author:MS Masoud, Chemistry Department, Faculty of Science, Alexandria University, Alexandria, Egypt
DOI: 10.32474/AOICS.2018.03.000172
Abstract
Zinc II, cadmium II and mercury II complexes derived from barbituric acid (BA), 5-nitrobarbituric acid (NBA), phenobarbital (PB) and 2-thiouracil (TU) were synthesized. The analytical results assigned the formation of complexes with the stoichiometries 1:1 and 1:2. The infrared spectral measurements assigned, and bands. The tetrahedral geometries are given for these complexes. The capacitance (CP) and the dielectric constant of the complexes are decreased with increasing the applied frequency and increased with increasing temperature. The behavior of the dielectric loss (”) indicated a polar polarization mechanism. The loss tangent (tan ) is decreased with increasing frequency and increased with increasing temperature while the impedance (Z) is mostly decreased with increasing both of frequency and temperature. Cole-Cole diagrams for the complexes at different temperatures reveal non-Debye type of the complexes. The relaxation time (t) for each relaxator becomes smaller as the temperature increases. In most complexes, the conductivity – temperature relationship is characterized by a phase transition temperature. Two pathways for the conduction of electricity may be expected at lower and upper temperature regions: n * and * transitions, respectively. The relative permittivity, dielectric loss and conductivity values for the complexes revealed semiconducting features based mainly on the hopping mechanism. The lower values of the activation energy (E) may be understood assuming that the metal ion forms a bridge with the ligands, thus facilitating the transfer of current carriers with some degree of delocalization in the excited state.

Keywords: Ligands and Complexes; IR Spectra; Dielectric Properties; Electrical Conductivity; Cole-Cole Diagrams and Activation Energy
Introduction
In today’s age of molecular biology purines and pyrimidines are probably best known as the basic constituents of the nucleic acids which are biomolecules that store genetic information in cells or that transfer this information from old cells to new cells. A number of pyrimidines were tested for their ability to inhibit nuclear and mitochondrial (uracil- deoxyribonucleic acid (DNA) glycosylase) activities also, 2-thiouracil, a ribonucleic acid (RNA) synthesis inhibitor, reduces the fertility of photoperiod sensitive genic male- sterile rice. Some nucleobase analogous were screened as inhibitors of dihydrouracil dehydrogenase (DHU dehydrogenase) from mouse liver. 5-Nitrobarbituric acid was identified as a potent inhibitor [1]. Since most living systems contain metal ions which are essential for proper functioning, question arises as to study the effect of such metal ions on nucleic acids. Any elucidation of metal ions effects on the pyrimidine nucleus could possibly lead to a better understanding of complex biological processes occurring in living system. Transition metals possess great biological activity when associated with certain metal-protein complexes which participate in the transport of oxygen and electronic transfer reactions [2]. Platinum group metal complexes of nucleic acid bases and their derivatives attracted considerable attention because of their antitumor and antibacterial activity [3]. The biological activity of cisplatin is due to its ability to bind the guanine-cytosine of the DNA strand and stop the replication process [4]. Cisplatin has been used in treating several human tumors of the genito-urinary type [5].
DNA strands can curl up to produce some amazing structures, and they can bind to metal ions. DNA has served as an ingenious storage device for genetic data for more than three billion years. But only few years ago, it has also emerged as a powerful material for building complex structures at the nanometer scale. Masoud and coworkers published a series of papers about pyrimidine complexes, the most recent references are cited [6-12]. So, in a sequel of continuation, the present paper is focused to study the complexing properties and electrical applications of some biologically active nucleic acid constituents (barbituric acid, 5-nitrobarbituric acid, phenobarbital, and 2-thiouracil).
Experimental
A- Synthesis of Complexes
The required metal salts were dissolved and mixed with the required weight of the ligand solutions. The selected ligands are shown in the following (Scheme 1).
Barbituric acid (BA), 5-nitrobarbituric acid (NBA), phenobarbital (PB), and 2-thiouracil (TU).
The following complexes were formed:
a) Zn(HL)2, Cd(HL)2.2H2O,• HgL.H2O, Hg(HL)2 (obtained from barbituric acid).
b) ZnL.2H2O, • CdL.2H2O (obtained from 5-nitrobarbituric acid).
c) ZnL.H2O, CdL.H2O (derived from 2-thiouracil).
d) Cd(HL)2.H2O derived from phenobarbital).
The products were separated by filtration then dried.
B- Analysis
I. Metal ion content
The complexes were digested and decomposed with aqua regia. The contents of Zn2+, Cd2+ and Hg2+ were determined by the usual complexometric titration procedures [13].
II. Carbon, hydrogen, nitrogen and sulfur contents were analyzed as usual.
C- Instruments and Working Procedures
Infrared Spectrophotometer
The spectra of ligands and their complexes were recorded using Perkin-Elmer Spectrophotometer model 1430 covering the frequency range 4000-200cm-1, by the KBr disc method.
Dielectric and Electrical Conductivity Measurements
i Four test parameters including impedance |Z|, phase angle θ, parallel equivalent static capacitance CP and loss tangent tan δ were measured for the complexes Zn(BA)2, Cd(BA)2.2H2O, Zn(NBA).2H2O, Cd(PB)2.H2O and Zn(TU).H2O in the solid state at constant voltage 0.80 volt. The measurements were taken at different temperatures (26-190°C) and variable frequencies (4 kHz-100 kHz) using HIOKI “3532-50 LCR HITESTER” instrument.
ii The complexes were prepared in the form of tablets at a pressure of 4 tons/cm2.The tablets were hold between two copper electrodes and then inserted with the holder vertically into cylindrical electric furnace. The potential drop across the heater was varied gradually through variable transformer to produce slow rate of increasing the temperature to get accurate temperature measurements using a pre-calibrated Cuconstantan thermocouple attached to the sample.
iii The dielectric constant ε, the dielectric loss , real part of impedance Z′, imaginary part Z″, the conductivities σa.c. the relaxation times τo , τ and the activation energies ΔE of the complexes were calculated [14] and correlated with the structures.
Results and Discussion
Mode of Bonding and Stereochemistry of the Prepared Complexes
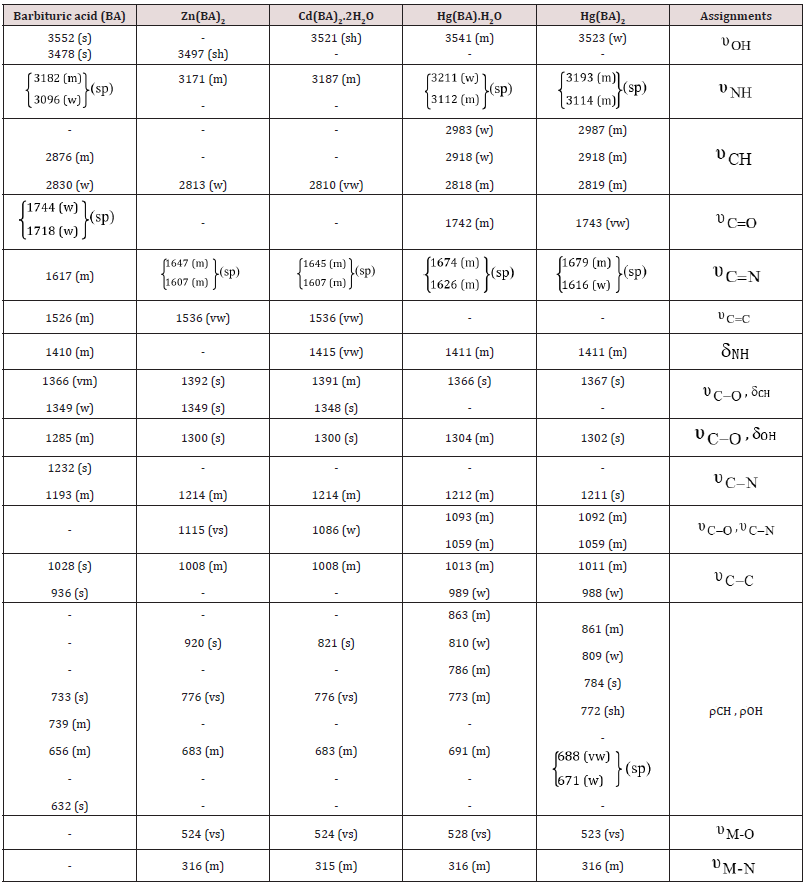
The IR spectra of the free ligands and their metal complexes were studied, usually, a charge transfer takes place from the ligand to the metal ion resulting in a decrease in the force constant of the bond reflecting a red shift of the band position. In some cases, a blue shift occurs for a reverse process, i.e. electrons are donated from the metal ion to the coordinated groups leading to increase the bond order of the groups bonded to the metal ion [15]. Most of the prepared complexes contain water. Generally, lattice water absorbs at 3550-3200cm-1 (asymmetric and symmetric OH stretchings) [16], and at 1630-1600cm-1 (HOH bending). Also, the rocking and metaloxygen stretching modes will become infrared active if the metaloxygen bond is sufficiently covalent. The presence of these bands in aqua complexes was reported at 880-850cm-1 and assigned to the rocking mode of coordinated water [17]. Infrared data illustrated the following main points
a) (BA) gave four IR bands [18], due to  with the presence of an intramolecular hydrogen bonds OH--
-N. (Table 1).
m = medium, s = strong, sh = shoulder, sp = splitted, vs = very strong, vw = very weak, w =weak.
b) Shifts of the band of the free ligand occurred upon
complexation, due to the existence of coordinated water
molecules or M-O and hydrogen bond formations [19],
However,  is assigned.
c) The shifts or disappearance of both the  bands, (Table 1) suggest that these groups are strongly
involved in the structural chemistry of the complexes. This is
supported either by the probable existence of M-N bands or the
free ligand may be subjected to keto
 enol tautomerism
[20,21].
d) New IR bands of the complexes appeared at (528-
523cm-1) and (316-315cm-1) assigned as  , respectively. The
  bands of BA
are shifted on complexation, indicating M-O interaction.
e) Barbituric acid is of bidentate or tridentate bonding according to the complex stoichiometries, (Scheme 1) The bidentate chelation is suggested to be through N(1) and C(2) O while the tridentate interaction is via C(2)O, N(3) and C(4)O.
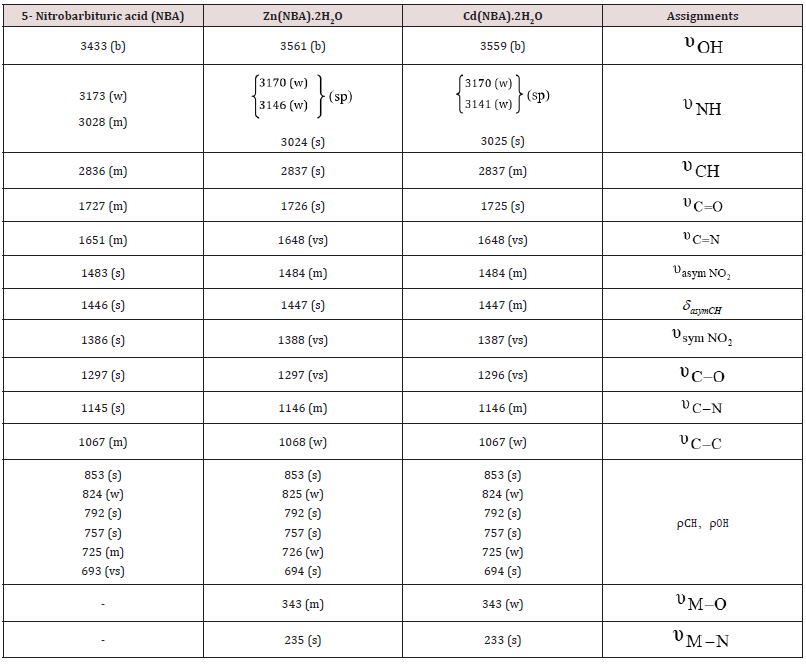
In Case Of NBA, (Table 2) The Infrared Data, Illustrated the Following Main Points:
a) The broad band at 3433cm-1 in the free ligand is shifted
to 3561 and 3559cm-1 for ZnII and CdII complexes, respectively
[22]. Two  bands for the free ligand at 3173 and 3028cm-1
are identified. On complexation, the former band for the
ligand becomes doublet at (3170, 3146cm-1) and (3170, 3141
cm-1) for ZnII and CdII complexes, respectively. However, the
latter
  band is shifted to 3024 and 3025cm-1 for ZnII and
CdII complexes, respectively.
b = broad, m = medium, s = strong, sp = splitted, vs = very strong, w = weak.
b) The medium CH υ band at 2836cm-1 for the free ligand excluded the possibility of the formation of an organometallic compound. However, the band in the free ligand (NBA) is not remarkably affected on complexation suggesting that the C=O in position (6) is still exist in the complexes.
c) The observed medium C N υ = band in the free ligand at 1651cm-1 may be due to tautomerism. It is shifted (-3cm-1) for both ZnII and CdII complexes in strong feature. Such data suggest that the nitrogen atom of the pyrimidine ring formed by tautomerism is bonded to the metal ion.
d) The nitro group is not involved in coordination.
Generally, for PB the  bands are shifted
on complexation with the creation of new
  band at 1616cm-1.
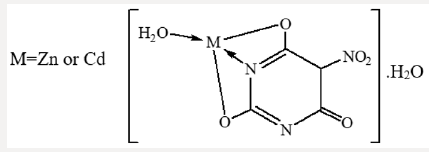
In case of thiouracil (TU), the NH group either participates in bond formation with the metal ion or tautomerised with the adjacent C=S and C=O groups to form the enol-thiol tautomers. The latter view is verified by the presence of C N υ = , C O υ − and bands at 1626, 1390 and 1001cm-1, respectively [23]. 2-Thiouracil acts as dianionic and tridentate chelator through C(2)S, N(3) and C(4)O. From the previous findings, together with the elemental analyses, the following structures for NBA complexes are given: (Scheme 2)
B- Dielectric and Electrical Conductivity Measurements
Dielectric Measurements
For a parallel-plate condenser in which a dielectric tablet fills the space between the plates, the capacitance is given by [26]:
where o ε is the permittivity of a vacuum and its value is approximately 8.854 × 10⁻¹² F m-1,
ε is the dielectric constant of a dielectric, A and d are the area and thickness of the tablet, respectively.
The complex dielectric permittivity, ε* (ω) is given as follows [27]:
where ε′(ω) and (ω) are the real and imaginary parts of the
complex permittivity, respectively. ω is the angular frequency, ω =2Πf and i = 
where θ is the phase shift.
The loss tangent, tan
The real and imaginary parts of the complex impedance are given by:
where Z′ and Z″ are the real and imaginary parts of the impedance, respectively.
Figure 1: The dielectric parameters (Z, CP, , , , , tan ) ln f relationships for Zn(BA)2 complex at different temperatures 30°C, 50°C , 70°C, 90°C, 110 °C, 130°C, 150°C, 170°C and 190°C.
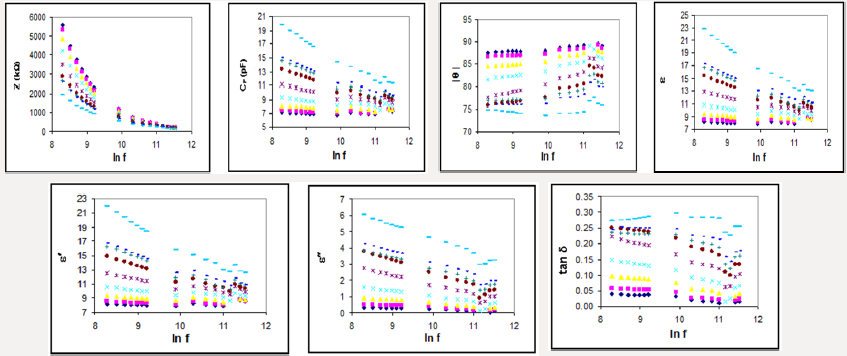
Dispersion arising during the transition from full orientational polarization at zero or low frequencies to negligible orientational polarization at high radio frequencies is referred to as dielectric relaxation. The rate of decay and build-up of the orientational polarization, as given by the relaxation time τ, will depend upon the thermal energy of the dipoles as well as upon the internal or molecular friction forces encountered by the rotating dipoles. The dielectric parameters are given in terms of temperature and frequency changes, e.g. Zn(BA)2 (Figure 1). The more spotlight points could be given as follows:
I. The capacitance (CP) and the dielectric constant decreased with increasing the applied frequency in some different ranges which probably due to that the polarization does not occur instantaneously with the application of the electric field.
II. The variation of the permittivity values with increasing temperature at certain constant frequency revealed small dielectric constant at lower temperatures, where the molecules are rigid, i.e. less oriented forces. By increasing the temperature, the number of molecules capable of rotating about their long axes increased with higher permittivity values. The behavior of the dielectric loss values, (Figure 1), indicated a polar polarization mechanism [28], where its values are affected by both temperature and frequency.
III. The relative permittivity and dielectric loss values for the complexes, (Figure 1), revealed semiconducting features based mainly on the hopping mechanism [29].
IV. The loss tangent (tan δ) is decreased with increasing frequency and increased with increasing temperature in most cases, (Figure 1).
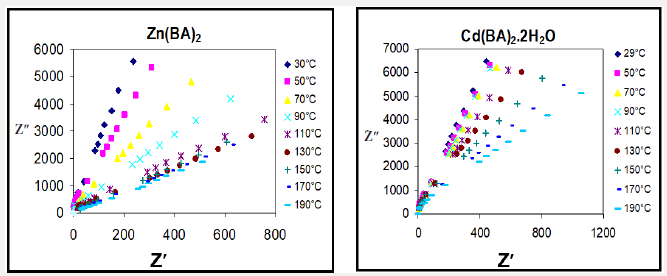
V. The impedance (Z) is mostly decreased and illustrated for Zn(BA)2 and Cd(BA)2.2H2O as two different examples at different temperatures, (Figure 2).
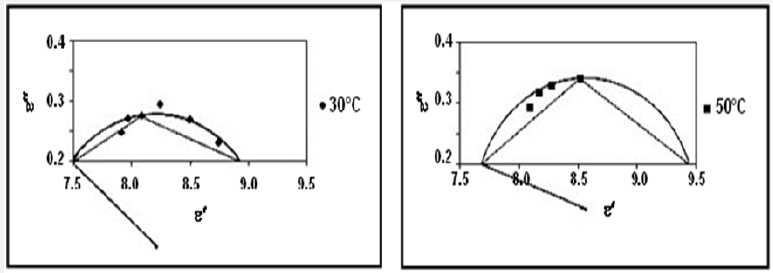
The evaluation of experimental dielectric data is much facilitated by certain graphical methods of display, which permit the derivation of parameters by geometrical construction. The earliest and most used of these methods consists of plotting (ω) for certain frequency against ε′(ω) at the same frequency, in cartesian coordinates or in the complex plane. For a dielectric with a single relaxation time the Cole-Cole plot is a semi-circle which provides an elegant method of finding out whether a system has a single relaxation time or more [30]. The semi-circle diagram has been used to determine the distribution parameter α [31], which measures the width of distribution of relaxation time and evaluated by measuring the angle between the real part of dielectric constant and radius of the circle. Also, the macroscopic relaxation time to and the molecular relaxation time τ can be determined [30,32]. If the centers of semi-circles lie ε′(ω) axis, α is zero (Debye type). Otherwise the centre is below ε′(ω) axis and α ≠ 0 (non-Debye type). Two intersections between the real axis ε′(ω) and the circular arc, give the relative permittivity at zero frequency (static dielectric constant s) and that at infinite frequency approaching the frequencies of light oscillators (optical dielectric constant ε∞) [32]. A point on the semi-circle defines two vectors u and v. v is the distance on the Cole-Cole diagram between the static dielectric constant es and the experimental point, u is the distance between that point and the optical dielectric constant ε∞. Cole and Cole generalized the representation of a Debye dielectric by a circular arc plot in the complex plane so that it is applied to a certain type of distributions of relaxation times, so
The extent of the distribution of relaxation times increases with increasing parameter α. On the other hand, the value of to decreases with increasing temperature. The molecular relaxation time τ could be determined based on the following equation [30]:
The temperature dependence of τ can be expressed for thermally activated processes as [32]:
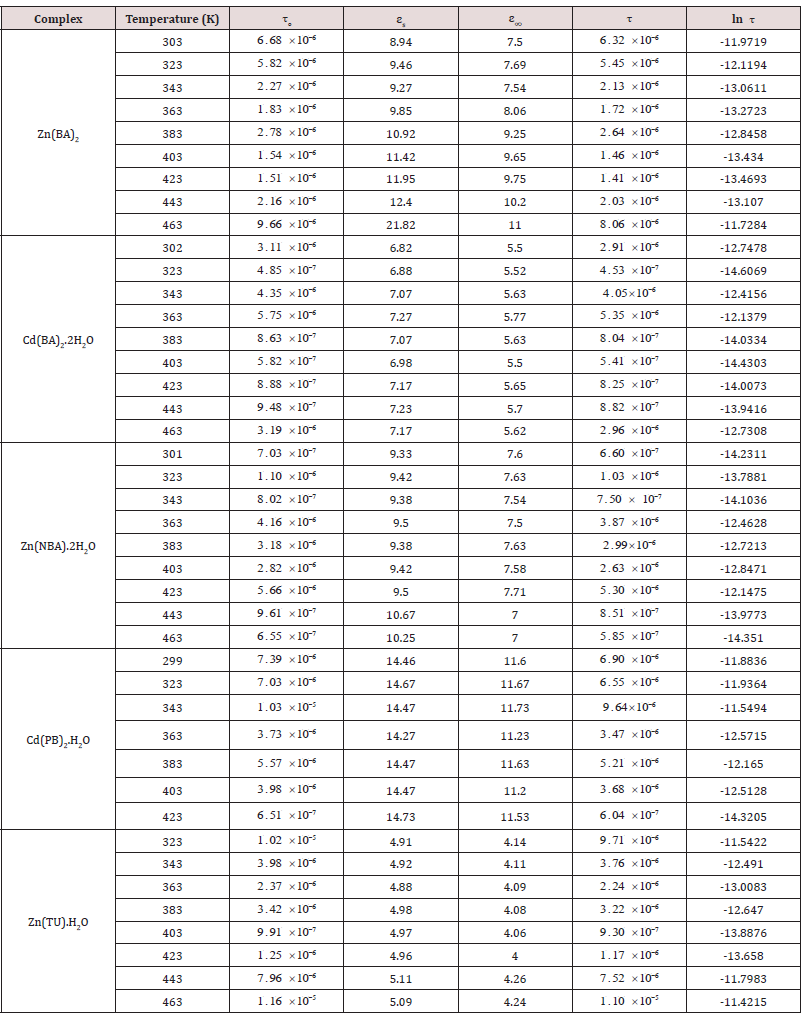
where to is a constant characteristic relaxation time and represents the time of a single oscillation of a dipole in a potential well, Eo is the energy of activation for the relaxation of the dipole, k is the Boltzmann constant and τ represents the average or most probable value of the spread of the relaxation times. A representative Cole-Cole diagrams for Zn(BA)2 complex at 30 and 50°C, (Figure 3), reveal non-Debye type of the complex. The dielectric data obtained from the analysis of Cole-Cole diagrams for different complexes are collected in Table 3. The change of central metal ion from Zn to Cd in the complexes results mainly in a decrease of the relaxation time values. to for Cd(PB)2.H2O complex is much higher than that for Cd(BA)2.2H2O complex at the same temperature in most cases, (Table 3). One must focus the attention that the molecular orientation of Cd(PB)2.H2O gave its high restriction. So, this complex is probably associated in its molecular structure.
Table 3: The dielectric data obtained from the analysis of Cole-Cole diagrams for different complexes.
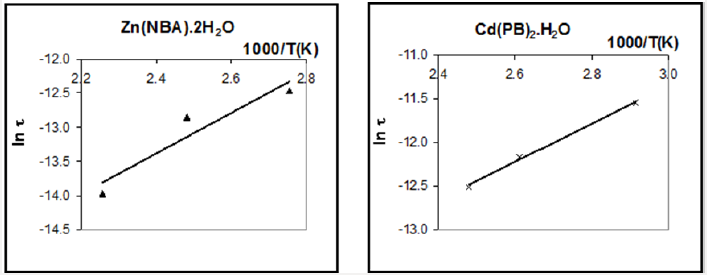
The variation of ln τ as a function of reciprocal absolute temperature for different complexes, (Figure 4), showed the above relation for Zn(NBA).2H2O and that for Cd(PB)2.H2O assigned that as the temperature increases, the relaxation time for each relaxator becomes smaller in some ranges. The activation energies for the relaxation processes of different complexes are given in Table 4.
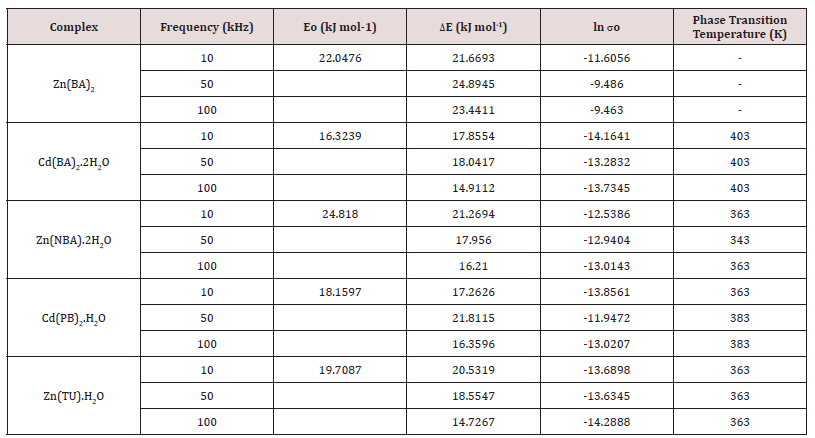
Table 4: The activation energy data (E) and ln o values for the complexes at different frequencies.
Electrical Conductivity Measurements
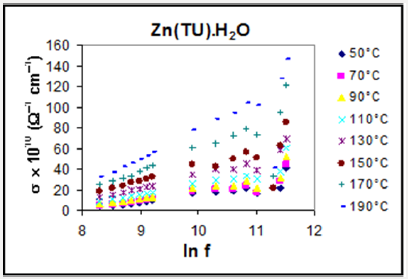
The frequency dependence of a. c. conductivity for the complexes at different temperatures is illustrated in Figure 5. The behavior shows that the a. c. conductivity increases with increasing the frequency. In the present complexes, the conductivities have a magnitude close to that of semiconductors, where the electrons in the orbitals are not of sufficient mobility to be promoted. The study of the conduction mechanism of organic materials leads to an increasing use of these materials in commercial devices such as solar energy panels, scintillation counter and also in some technological applications such as photocopy process. The electrical conductivity of substances at a given frequency varies exponentially with the absolute temperature according to the Arrhenius relation [33]:
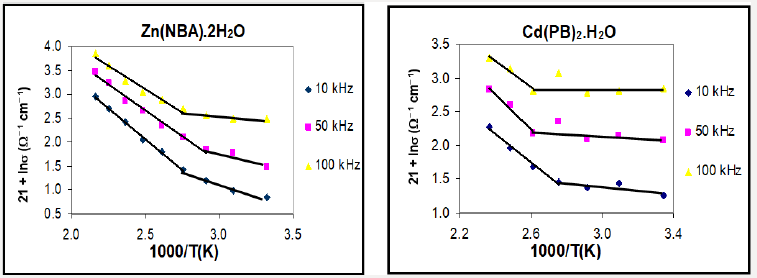
where σ is the electrical conductivity at an absolute temperature T, so is the pre-exponential factor, ΔE is the activation energy and k is the Boltzmann constant. Therefore, the temperature dependence of the electrical conductivity is characterized by the two constants: the activation energy (ΔE) and the pre-exponential factor (so). The variations of ln σ as a function of reciprocal absolute temperature for Zn(NBA)2.2H2O and Cd(PB)2.H2O complexes at different frequencies are illustrated in Figure 6. The activation energy data and ln so values for the complexes are given in Table 4, from which the ΔE values are in harmony with those calculated from relaxation processes. For the complexes, the curves are characterized by breaks at a transition temperature. So, the behavior is nearly the same till the phase transition temperatures (343-403K) followed by large increase in conductivity by further increase of temperature. This can be ascribed to a molecular rearrangement or different crystallographic or phase transitions [34,35]. The magnitude of the conductivities of the complexes, along with the values of the energy gaps indicated slight semiconducting properties. The most realistic description of the complexes involves an interaction of the metal orbitals with the ligands to give new molecular orbitals (MO), which are delocalized over the whole molecular complex. In view of the high degree of covalency in the M-O and M-N bonds, it is no longer permissible to distinguish the central metal from the ligands, the complexes must be regarded as individual entities.
The conductivity for amorphous semiconductor could be interpreted with an intrinsic two-carrier model which originates with thermally assisted hopping conduction [29]. The relationship between molecular structure and electrical properties was deduced. On the basis of electronic transition within molecules, two pathways for the conduction of electricity may by expected. The first conducting process occurring in the lower temperature region is attributed to n → π* transitions which require less energy to be performed. While in the upper temperature region, conduction could be attributed to π → π* transitions which need more energy to participate in electronic conduction. The observed increment of conduction in the upper temperature region may be attributed to interactions between n → π* and π → π* transitions. The lower temperature range is the region of extrinsic semiconductor where the conduction is due to the excitation of carriers from donor localized level to the conduction band. In the upper temperature range, the intrinsic region is reached where carriers are thermally activated from the valence band to the conduction band. This behavior can be explained as follows: the upper temperature range may be attributed to the interaction between the electrons of d-orbitals and the p-orbitals of the ligand. This interaction will lead to small delocalization of the p-electronic charge on the ligand which tends to increase the activation energy. The presence of d-electrons in a narrow energy band leads to magnetic ordering and degeneracy of d-bands with respect to the orbital quantum number, which is only partially lifted in a crystal field [36].
In all complexes, during temperature increase, an additional increase in electrical conductivity occurs. This is a useful criterion for ascertaining the nature of the metal-ligand bonding [37], so
a) The electrical conductivities increased by increasing the molecular weight of the complexes
b) The activation energy decreased with increasing the atomic number of the metal, which indicates that the presence of holes in the system has little effect on the mobility of charges [38].
The lower values of ΔE may be understood assuming that the metal ion forms a bridge with the ligands, thus facilitating the transfer of current carriers with some degree of delocalization in the excited state during measurements. Meanwhile, this leads to an increase of the electrical conductivity with a decrease in energy of activation [39].
References
- FNM Naguib, MH El Kouni, S Cha (1989) Structure-activity relationship of ligands of dihydrouracil dehydrogenase from mouse liver. Biochem Pharmacol 38(9): 1471-1480.
- M Tümer, H Köksal, S Serin, M Digrak (1999) Antimicrobial activity studies of mononuclear and binuclear mixed-ligand copper(II) complexes derived from Schiff base ligands and 1,10-phenanthroline. Trans Met Chem 24(1): 13-17.
- H Okuno, T Shimura, T Okada, T Tomohiro, M Kodaka, et al. (1991) Kayaku Gijutsu Kenkyusho Hokoku 103: 247-663.
- PJ Stone, AD Kelman, FM Sinex (1974) Specific binding of antitumour drug cis-Pt(NH3)2Cl2 to DNA rich in guanine and cytosine. Nature 251: 736-737.
- CFJ Barnard, MJ Cleare, PC Hydes (1986) Chem Britain pp.1001.
- MS Masoud, EA Khalil, AM Hindawey, AE Ali, EM Fawzy (2004) Spectroscopic studies on some azo compounds and their cobalt, nickel and copper complexes. Spectrochim. Acta 60A: 2807-2817.
- MS Masoud, EA Khalil, AM Hafez, AF El-Husseiny (2005) Electron spin resonance and magnetic studies on some copper(II) azobarbituric and azothiobarbituric acid complexes. Spectrochim Acta 61(5): 989-993.
- MS Masoud, AA Ibrahim, EA Khalil, A El-Marghany (2007) Spectral properties of some metal complexes derived from uracil-thiouracil and citrazinic acid compounds. Spectrochim Acta 67(3-4): 662-668.
- MS Masoud, EA Khalil, AM Ramadan (2007) J Anal Appl Pyrolysis 78: 14.
- MS Masoud, D Awad, MA Malalawi, OM Sadek (2014) Chemico-Biological interactions 208: 37.
- MS Masoud, AE Ali, MY Abd El-Kaway (2014) Thermal properties of mercury(II) and palladium(II) purine and pyrimidine complexes. J Therm Anal Calorim 116(1): 183.
- MS Masoud, MF El-Shahat, AS El-Kholany (2014) Physicochemical studies of the reaction of 99mTc with 5,5‘-diethyl barbituric acid, adenine, D-glucose and thiobarbituric acid at different temperatures. Spectrochim. Acta 127: 216-224.
- A Vogel (2004) Textbook of Quantitative Chemical Analysis. (4th edn).
- AK Jonscher (1983) Dielectric Relaxation in Solids. Chelsea Dielectric London, UK.
- AA Soayed, OF Hafez, SA Abou El-Enein (2004) Bull Fac Sci Alex Univ 43 (1,2): 41.
- PJ Lucchesi, WA Glasson (1956) J Am Chem Soc 78, 1347.
- I Gamo (1961) Bull Chem Soc Jpn. 34: 1430-1433.
- MS Masoud, GB Mohamed, YH Abdul-Razek, AE Ali, FN Khairy (2002) J Kor Chem Soc 46(2): 99.
- MS Masoud, SA Abou El-Enein, IM Abed, AE Ali (2002) Synthesis and characterization of amino alcohol complexes. J Coord Chem 5(2): 153- 178.
- IL Finar (2002) Stereochemistry and the Chemistry of Natural Products. Organic Chemistry (5th Edn.), Pearson Education (Singapore) Pte. Ltd., Indian Branch, 482 FIE Patparganj, Delhi, India, 2.
- MS Masoud, AA Soayed, AE Ali, OK Sharsherh (2003) J Coord Chem 56(8): 725.
- MS Masoud, A Kh Ghonaim, RH Ahmed, SA Abou El-Enein, AA Mahmoud (2002) J Coord Chem 55(1): 79.
- Masoud MS, Abd El-Hamid OH, Zaki ZM (1994) 2-Thiouracil-based cobalt (II), nickel (II) and copper (II) complexes. Trans Met Chem 19: 21-24.
- M Gupta, MN Srivastava (1991) Bull Soc Chim Fr 859, CA, 116: 165.
- FA Cotton, G Wilkinson, PL Gaus (1995) Basic Inorganic Chemistry. (3rd Edn.), Hamilton Printing, USA.
- HM Rosenberg (1997) The Solid State. (3rd Edn.), Oxford Univ Press, UK.
- H Fröhlich (1949) Theory of Dielectrics. Oxford Univ Press, London, UK.
- MS Masoud, AM Hafez, M Sh Ramadan, AE Ali (2002) J Serb Chem Soc 67(12): 833.
- JM Thomas (1977) Chemistry in Britain 13(5): 175.
- KS Cole, RH Cole (1941) Dispersion and Absorption in Dielectrics I. Alternating Current Characteristics. J Chem Phys 9: 341
- Masoud MS, Ali AE, Mohamed RH, Abd El-Zaher Mostafa M (2005) Dielectric relaxation spectroscopy of heteronuclear cobalt(II)-copper(II) complex of 1-phenyl-3-methyl-5-pyrazolone. Spectrochim Acta 62(4-5): 1114-1119.
- B Tareev (1979) Physics of Dielectric Materials. Mir Publishers, Moscow, Russia.
- DC Olson, VP Mayweg, GN Schrauzer (1966) Polarographic Study of Coordination Compounds with Delocalized Ground States. Substituent Effects in Bis- and Trisdithiodiketone Complexes of Transition Metals. J Am Chem Soc 88(21): 4876-4882.
- F Gutmann, A Netschey (1962) Electrical Properties of Chlorpromazine. J Chem Phys 36: 2355.
- F Gutmann, H Keyzer (1965) Electrical conduction in chlorpromazine. Nature 205(926): 1102-1103
- Masoud MS, Khalil EA, El-Shereafy E, Abou El-Enein SA (1990) Thermal and Electrical Behaviour of Nickel (II) and Copperoi) Complexes of, ~-Acetylamino -2-HYDROXY-5-MET Hyl Azobenzene. J Thermal Anal 36: 1033-1038.
- MS Masoud, ZM Zaki, FM Ismail, AK Mohamed, Z für (1994) Phys Chem 185: 223.
- Masoud MS, Zaki ZM, Ismail FM (1989) Conducting Properties of Some New Azo-Nitroso Complexes. Thermochim Acta 156: 225.
- MS Masoud, EA Khalil, AM Ramadan, YM Gohar, A Sweyllam (2007) Spectral, electrical conductivity and biological activity properties of some new azopyrimidine derivatives and their complexes. Spectrochim Acta 67(3-4): 669-677.

Top Editors
-

Mark E Smith
Bio chemistry
University of Texas Medical Branch, USA -

Lawrence A Presley
Department of Criminal Justice
Liberty University, USA -

Thomas W Miller
Department of Psychiatry
University of Kentucky, USA -

Gjumrakch Aliev
Department of Medicine
Gally International Biomedical Research & Consulting LLC, USA -

Christopher Bryant
Department of Urbanisation and Agricultural
Montreal university, USA -

Robert William Frare
Oral & Maxillofacial Pathology
New York University, USA -

Rudolph Modesto Navari
Gastroenterology and Hepatology
University of Alabama, UK -

Andrew Hague
Department of Medicine
Universities of Bradford, UK -

George Gregory Buttigieg
Maltese College of Obstetrics and Gynaecology, Europe -

Chen-Hsiung Yeh
Oncology
Circulogene Theranostics, England -
.png)
Emilio Bucio-Carrillo
Radiation Chemistry
National University of Mexico, USA -
.jpg)
Casey J Grenier
Analytical Chemistry
Wentworth Institute of Technology, USA -
Hany Atalah
Minimally Invasive Surgery
Mercer University school of Medicine, USA -

Abu-Hussein Muhamad
Pediatric Dentistry
University of Athens , Greece

The annual scholar awards from Lupine Publishers honor a selected number Read More...


