Lupine Publishers Group
Lupine Publishers
Menu
ISSN: 2637-4609
Research Article(ISSN: 2637-4609) 
Identification of Modified and Unmodified Lipophilic B-Diketones Using Electrospray Ionisation Mass Spectrum (Esi-Ms) Volume 2 - Issue 1
Kaana Asemave*
- Department of Chemistry, Benue State University, Nigeria
Received: February 15, 2018; Published: March 01, 2018
Corresponding author: Kaana Asemave, Department of Chemistry, Benue State University, Nigeria
DOI: 10.32474/AOICS.2018.02.000127
Abstract
Identification of modified and unmodified lipophilic p-dketone was carried out successfully using positive ion mode of ESI-MS. The ESI-MS spectra were obtained using LC - Agilent 1260 Infinity with MS - Bruker micro OF time of flight MS in mass range of m/z 200-900, capillary voltage 4500V, nebuliser pressure 21.8 psi, dry gas flow 8L/min and dry gas temp 433K. Potassium adduct ion 503.4437m/z was found for the 14,16-Hentriacontanedione (Htd); whereas, the itaconate modified Htd (Ita) gave a confirmatory sodium species 645.5051m/z. The ion 589.4794 m/z was for potassium species of the singly added acrylate modified Htd (Mas). Meanwhile, the doubly added acrylate modified Htd (Mad) formed the potassium adduct ion of 675.5179m/z. However, protonated species for these molecules were not obtained.
Keywords: Electrospray ionisation mass spectrum (ESI-MS); Modified and unmodified lipophilic β-diketone
Introduction
Electrospray ionization mass spectroscopic technique (ESI- MS) has already been established as a powerful tool in the characterization of small and large molecules [1]. ESI concept was firstly introduced in 1968 by Dole [2]. It is a less energetic ionization technique, where a sample is protonated in gas phase to form cationic species; not radical (as is the case of impact ionization approach), [3] thus causing little or no fragmentation of the parent compound. It is pertinent to make do with ESI-MS because, in some cases, the column in GC is not suitable for detecting very high molecular weight organic compounds. Literature report has it that, ESI-MS method is reliable, robust and much less time consuming than the GC methods [4]. Importantly, ESI-MS is simple, fast, accurate, sensitive and straightforward technique for the analyzing compounds [5,6]. Alternative techniques for analyses of compounds such as NMR need further processing and requisite expertise to enable the identification of a compound.
Thus, the interfacing of electrospray ionization with modern mass spectrometers has been applied to estimating the molecular weights of many compounds [6]. It is useful to determine molecular weight of organic molecules even at femtomole level. Hence, Knepper [4] also reported electrospray mass spectrometry as a simple, sensitive and quick method for the determination of polar organic traces in water samples without derivatization. Electrospray ionization mass spectrometry was used to develop a rapid, sensitive and accurate method for determination and identification of hepatotoxic microcystins, cyanobacterial cyclic heptapeptides [5]. Poon [6] reported a simple, fast and sensitive way of identification of anticancer drugs and their analogues consisting of organic and organometallic compounds using ESI- MS. The studies suggested that ESI-MS is an effective technique for identification of organometallic and small organic compounds [6] Loss of fragments were observed from the ESI-MS spectra of the anticancer drugs. Kaltashov [7] investigated the structure, dynamics and function of metalloproteins with ESI-MS.
This method has also been used to identify major phenolic compounds present in strawberry fruits [8]. Sun [9] reported the application of ESI-MS in the identification of non-phenolic compounds in red wines as well. Phenolic compounds profile in wild edible greens was also detected with ESI-MS as reported by Barros [10] Identification of phenolic compounds in rapeseed meals were ascertained with ESI-MS [11]. In this studies, the molecular weight were predominantly detected in the form of [M+H]+ [11]. ESI-MS was also applied successfully for the qualitative analysis of green tea extract [12]. Quantitative analysis of docetaxel in polymeric matrices of poly (lactide-co-glycolide) and poly (lactide-co-glycolide)- poly (ethylene glycol) nanoparticles has been reported using ESI-MS [13]. It was observed that there was more intense formation of [M+H]+ than [M+Na]+ [13]. In as much as ESI-MS has become a global method for qualitative and quantitative analyses, there are no literature on the ESI-MS analyses of lipophilic β-diketones and there derivatives. Hence, this paper reports the identification of 14, 16-hentriacontanedione (Htd), acrylate modified Htd (Ma) and itaconate modified Htd (Ita) for the first time.
Material and Methods
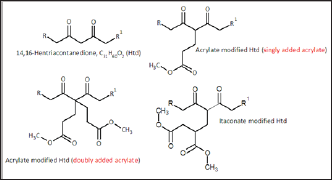
About 20 mg of each sample was prepared in methanol: water (1:1). Their ESI-MS spectra were obtained using LC - Agilent 1260 Infinity with MS - Bruker micrOTOF time of flight MS in mass range of m/z 200-900 positive ion mode, capillary voltage 4500V, nebuliser pressure 21.8 psi, dry gas flow 8 L/min and dry gas temp 433K. The following chemicals in Figure 1 whose ESI-MS spectra were studied were prepared and purified prior to these studies.
Figure 1: The lipophilic β-diketone and its derivatives.
Results and Discussion
Figure 2: ESI-MS(+) for the Htd.
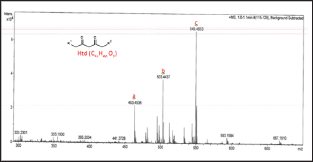
Figure 3: ESI(+)-MS of Ita.
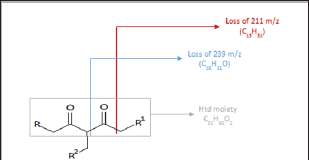
The unmodified Htd was firstly identified using the ESI-MS technique. Proton, potassium and copper adduct species of the Htd have been identified in the ESI-MS spectrum shown in Figure 2 and further described in Table 1 below. Copper is accounted for in this spectrum since it comes from the cuprous acetate used to isolate the long chain Htd. Aravindhan [14] reported Na species ofthe metal and azo-metals complexes of embelin in their ESI-MS analysis [14]. In a similar vein, the modified Htd were identified with this technique. The ESI (+)-MS of the itaconate modified Htd obtained is presented in Figure 3 and the peaks are interpreted/ assigned in Table 2. The ESI (+)-MS of this itaconate modified 14,16-hentriacontanedione (Ita) had minor peaks (i.e. less intense peaks), 407.2757 m/z and 379.2460 m/z in addition to the major sodium adduct peak, 645.5051m/z (M+Na)+. The 407.2757 m/z ion is due to loss of 239 (C16H31O) from the product peak (645.5051m/z). However, if the loss of C16H31O occasioned from the parent molecule of Ita (622m/z), then 383m/z will be produced. This fragment 383 m/z would have combined with Na+ to produce 407.2757m/z. Then, 379.2460m/z may have come from losses of 211 (C15H31) and 32 (MeOH) from the Ita (622m/z). Alternatively, loss of CO (28) from the 407.2757m/z ion could also form 379.2460m/z. Loss of CO in such compounds has been previously reported by Brent [15] see Figure 4 which describes the possible fragmentation pattern of the lipophilic β-diketone derivatives.
Table 1: ESI-MS(+) interpretation of the Htd.

Table 2: The major ESI-MS peaks and interpretation for the Ma and Ita.

Figure 4: Proposed dissociation (fragmentation) of Htd derivatives as found in ESI-MS(+).
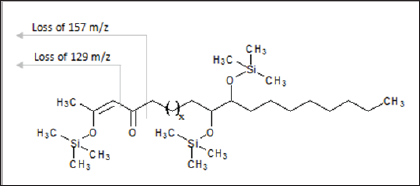
Similarly, sodium and potassium adducts were seen in the ESI- MS of the acrylate modified p-diketone (Ma) as presented in ESI- MS of Figure 5. The ESI (+)-MS spectrum of Ma had major peaks; 589.4794m/z and 675.5179m/z for potassium adducts of singly [Ms+K]+ and doubly [Md+K]+ added acrylate products respectively; then 659.5216m/z as sodium species of doubly added methyl acrylate product. Please refer to Table 2 for detail descriptions. The minor peaks 421.2924m/z, 449.3213m/z and 479.2984m/z in the ESI-MS of the Ma are likely due to formation of these species; [Md-239+Na]+, [Md-211+Na]+ and [Md- 239+2Na+K-2H]+. In all these spectra, protonated species [M+H]+ common in ESI(+)- MS were absent as it has been similarly reported [16] Although other researchers have confirmed predominant formation of protonated species in such studies [11,13]. Furthermore, Ramaroson- Raonizafinimanana [17] had also observed similar fragmentation of such lipophilic β-diketones as it was found in the mass spectrum of 2,4-diketone silyl ether derivatives described in Figure 6. According to Leenheer [16] the ESI (+)-MS of fulvic acid has been shown to loss CO, COO, H2O, carbon and proton. Furthermore, Brent [15] reported losses of COO (m/z 44), H2O (m/z 18), CO (m/z 28) or combinations of losses CO and H2O (m/z 46), COO and H2O (m/z 62) in coupled IC/ESI-MS/MS characterization of branched aliphatic monoacids, branched and straight chain aliphatic diacids. These show that group of atoms could be lost even from soft ESI-MS technique. Thus in addition to the to the product peaks, 407.2757 m/z and 379.2460 m/z; 421.2924 m/z, 449.3213 m/z and 479.2984 m/z were observed in the Ita and Ma molecules respectively.
Figure 5: ESI (+)-MS of the Ma.
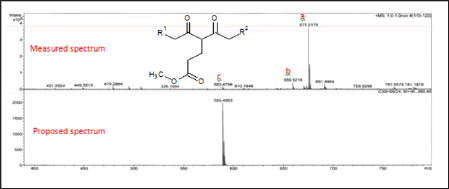
Figure 6: Fragmentation of long chain 2,4-diketone silyl ether derivatives.
Conclusion
Identification of modified and unmodified lipophilic p-dketone was carried out successfully using positive ion mode of ESI-MS. Potassium adduct ion 503.4437m/z [M+K]+ was found for the 14,16-Hentriacontanedione (Htd); the itaconate modified Htd (Ita) gave a confirmatory sodium species 645.5051m/z [M + Na]+. The ion 589.4794m/z [Ms + K]+ was for potassium species of the singly added acrylate modified Htd (Mas). Meanwhile, the doubly added acrylate modified Htd (Mad) formed the potassium adduct of 675.5179m/z [Md+K]+. However, protonated species for these molecules were not obtained.
Acknowledgements
We thank the TET Fund Nigeria for the grant.
References
- Laughlin S, Wilson WD (2015) May the Best Molecule Win Competition ESI Mass Spectrometry. Int J Mol Sci 16(10): 24506-24531.
- Dole M, Mack LL, Hines RL, Mobley RC, Ferguson LD (1968) Molecular Beams of Macroions. Chem Phys 49(5): 2240-2249.
- Parsons AF (2003) Keynotes in organic chemistry. Blackwell publishing.
- Knepper TP, Werner A, Bogenschütz G (2005) Determination of synthetic chelating agents in surface and waste water by ion chromatography mass spectrometry. J Chromatogr A 1085(2): 240-246.
- Yuan M, Namikoshi M, Otsuki A (1999) Electrospray Ionization Mass Spectrometric Analysis of Microcystins, Cyclic Heptapeptide Hepatotoxins Modulation of Charge States and [M+H] + to [M+Na] + Ratio. J Am Soc Mass Spectrom 10(11): 1138-1151.
- Poon GK, Bisset GMF, Mistry P (1993) Electrospray Ionization Mass Spectrometry for Analysis of Low Molecular Weight Anticancer Drugs and Their Analogues. J Am Sos Mass Spectom 4(7): 588-595.
- Kaltashov IA, Zhang M, Eyles SJ, Abzalimov RR (2006) Investigation of structure, dynamics and function of metalloproteins with electrospray ionization mass spectrometry. Anal Bioanal Chem 386(3): 472-478.
- Seeram NP, Lee R, Scheuller HS, Heber D (2006) Identification of phenolic compounds in strawberries by liquid chromatography electrospray ionization mass spectroscopy. Food Chem 97(1): 1-11.
- Sun J, Liang F, Bin Y, Li P, Duan C (2007) Screening Non-colored Phenolics in Red Wines using Liquid Chromatography/Ultraviolet and Mass Spectrometry/Mass Spectrometry Libraries. Molecules 12(3): 679-693.
- Barros L, Dueñas M, Ferreira ICFR, Carvalho AM, Santos Buelga C: Phenolic compounds profile in wild edible greens from Portugal obtained by HPLC-DAD-ESI/MS.
- Yang S, Arasu MV, Chun J, Jang Y, Lee Y, et al. (2015) Identification and Determination of Phenolic Compounds in Rapeseed Meals (Brassica napus L.). J Agric Chem Environ 4(1): 14-23.
- Savic IM, Nikolic VD, Savic IM, Nikolic LB (2014) The Qualitative Analysis Of The Green Tea Extract Using Esi-Ms Method. Adv Technol 3: 30-37.
- Rafiei P, Michel D, Haddadi A (2015) Application of a Rapid ESI-MS/MS Method for Quantitative Analysis of Docetaxel in Polymeric Matrices of PLGA and PLGA-PEG Nanoparticles through Direct Injection to Mass Spectrometer. Am J Anal Chem 6(2): 164-175.
- Aravindhan R, Sreelatha T, Perumal PT, Gnanamani A (2014) Synthesis characterization and biological profile of metal and azo-metal complexes of embelin. Complex met (Taylors Fr. 7-79).
- Brent LC, Reiner JL, Dickerson RR, Sander LC (2014) Method for characterization of Low Molecular Weight Organic Acids in Atmospheric Aerosols Using Ion Chromatography Mass Spectrometry. Anal Chem 86(15): 7328-7336.
- Leenheer JA, Rostad CE, Gates PM, Furlong ET, Ferrer I (2001) Molecular Resolution and Fragmentation of Fulvic Acid by Electrospray Ionization/ Multistage Tandem Mass Spectrometry. Anal Chem 73(7): 1461-1471.
- Ramaroson Raonizafinimanana B, Gaydou EM, Bombarda I (2000) Long Chain Aliphatic β-Diketones from Epicuticular Wax of Vanilla Bean Species Synthesis of Nervonoylacetone. J Agric Food Chem 48(10): 4739-4743.

Top Editors
-

Mark E Smith
Bio chemistry
University of Texas Medical Branch, USA -

Lawrence A Presley
Department of Criminal Justice
Liberty University, USA -

Thomas W Miller
Department of Psychiatry
University of Kentucky, USA -

Gjumrakch Aliev
Department of Medicine
Gally International Biomedical Research & Consulting LLC, USA -

Christopher Bryant
Department of Urbanisation and Agricultural
Montreal university, USA -

Robert William Frare
Oral & Maxillofacial Pathology
New York University, USA -

Rudolph Modesto Navari
Gastroenterology and Hepatology
University of Alabama, UK -

Andrew Hague
Department of Medicine
Universities of Bradford, UK -

George Gregory Buttigieg
Maltese College of Obstetrics and Gynaecology, Europe -

Chen-Hsiung Yeh
Oncology
Circulogene Theranostics, England -
.png)
Emilio Bucio-Carrillo
Radiation Chemistry
National University of Mexico, USA -
.jpg)
Casey J Grenier
Analytical Chemistry
Wentworth Institute of Technology, USA -
Hany Atalah
Minimally Invasive Surgery
Mercer University school of Medicine, USA -

Abu-Hussein Muhamad
Pediatric Dentistry
University of Athens , Greece

The annual scholar awards from Lupine Publishers honor a selected number Read More...


