Lupine Publishers Group
Lupine Publishers
Menu
ISSN: 2637-4609
Review Article(ISSN: 2637-4609) 
Biological Studies, Synthesis, Structural, Spectral Characterization and Co-Ordinate Mn (II), Fe (II), Zn (II) (II) Complexes Containing 2-Hydroxy-1- Naphthaldehydeand n,n’-Dimethyl-1,3-Propanediamine Volume 2 - Issue 3
Kadhiravan S1*, Elavarasn A2, Murugaiah K1, Venkatachelam R1, Sivajiganesan S1 and Kasi Gopinath1
- 1Department of Chemistry, AVVM Sri Pushpam College, India
- 2Department of packaging, Yonesei University, South Korea
Received: January 27, 2018; Published: April 05, 2018
*Corresponding author: Kadhiravan S, APG and Research Department of chemistry, AVVM Sri Pushpam College Poondi Thanjavur, Tamilnadu, India
DOI: 10.32474/AOICS.2018.02.000140
Abstract
A new Manganese (II), Iron (II), Zinc (II), complex, has been and characterized by elemental analysis, UV-Vis, FT-IR and Binding of this Mn (II), Fe (II), Zn (II) complex with calf thymus DNA was investigated by UV-Visible absorption, fluorescence spectroscopy techniques. The intrinsic binding constants Kb of complex with CT-DNA, BSA obtained from UV-Vis absorption studies were 1.75X1 05,1.98X105and2.38X105M-1.
Keywords: Mn (II); Fe (II); Zn (II)Complexes; DNA; BSA Binding
Introduction
Metal chelates are capable to tolerate their antitumor effects by binding to DNA. DNA binding alters the replication of DNA by inhibiting the growth of the tumor cells, which is the basis of designing new and more effective antitumor drugs. Among the DNA binding modes, intercalation is the most significant one because it always leads to cellular degradation [1]. Intercalation is the insertion of small molecules between stacked base pairs of the double helix structure of DNA. It leads to subsequent disruption of base stacking in the double helix by creating interference in hydrogen bonding or vander Waals interactions and results in the destabilization of double helix conformation of DNA. Thus, the consequence of intercalation include inhibition of transcription, prevention of DNA synthesis, structural changes of DNA, disturbances in cellular processes and finally cell death. More consideration has been paid on DNA intercalation, since the other DNA binding need more investigation for structure-function relationship. The groove binders along with intercalations can also be used for the treatment of bacterial, fungal infections and cancer.
Overall, compounds bearing antioxidant activity have been found to possess anticancer, anti-inflammatory, anti-hypertensive and many other biological activities [2,3]. The biological aspects of metallic ligands depend upon the ease of cleaving the bond between the metal ion and the ligands. It is well known that the metals present in complexes generally accelerate the drug action and the efficacy of therapeutic agents and that the pharmacological efficiencies of drug-based metal complexes depend upon the nature of the metal ion and the ligands [4]. The present work is the continuation of our previously reported work to obtain some novel complexes where the 4-chlorophenyl and 4-methoxyphenyl substituted 4-hydroxycumarin azo-analogues are conjugated with different transitional metals with an intention to produce target molecules possessing good antimicrobial properties [5,6].
Synthesis of Complexes
[Mn(L1).NCS] (1)
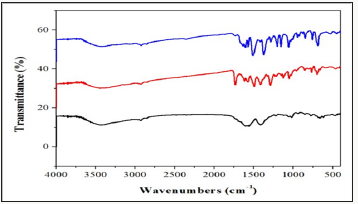
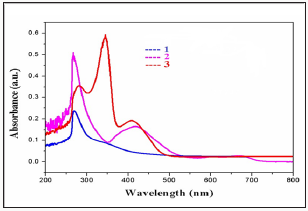
To a solution of 2-hydroxy-1-naphthaldehyde (0.144g, 0.84mmol) in methanol (10ml), sodium hydroxide (0.03g, 0.84mmol) was added and the resulting solution was stirred for 15 min at room temperature. CoCl2.6H2O (0.20g, 0.84mmol) in methanol (10ml) followed by N,N’-dimethyl-1,3-propanediamine (0.08g, 0.84mmol) in methanol (10ml) were added to the solution. To the reaction mixture ammonium thiocyanate (0.081 g, 0.84mmol) are added, followed by stirring for 3 h. The black colored precipitate that formed. Yield: 59 %; m.p. 143 °C (dec). Anal. Calc. (%) for C14H19N3MnOS: C, 54.84; H, 5.14; N, 11.29; S, 8.61. Found (%): C, 54.58; H, 5.32; N, 11.06; S,8.40. FT-IR (KBr, ν, cm-1 spectrum peaks: 3417br, 2928s, 2818s, 2065s, 1617s, 1541s, 1506s, 1437s, 1393s, 1361s, 1340s, 1309s, 1258s, 1192s, 1160s, 1143s, 1054s, 976s, 862s, 827s, 751s, 653s, 525s, 516s, 505s (br, broad; s, sharp). UV-Vis in DMF [λmax/nm (εmax/mol-1 cm-1)]: 279(511), 364(3040), 395(26), 664(2). ESI-MS (CH3OH) m/z (%): 378(38%). Conductivity (ΛM/S cm2 mol-1) in DMF: 11. The complexes [Fe(L1). NCS] (2) and [Zn(L1). NCS] (3) were synthesized by following the above procedure using cobaltous chloride instead of using Zinc chloride (1.99g, 0.84mmol) and Iron chloride (0.14g), respectively.
[Fe (L1).NCS] (2)
Brown colour solid, Yield: 55 %. (0.17g). m.p. 148 °C (dec). Anal. Calc. (%) for C14H19N3FeOS: C, 54.87; H, 5.15; N, 11.29; S, 8.61. Found (%): C, 58.58; H, 5.33; N, 11.06; S, 8.41. FT-IR (KBr, ν, cm–1spectrum peaks: 3411br, 2095s, 1618s, 1570s, 1538s, 1507s, 1484s, 1456s, 1446s, 1418s, 1394s, 1362s, 1342s, 1252s, 1215s, 1189s, 1156s, 1140s, 1094s, 1053s, 1026s, 966s, 860s, 830s, 752s, 711s, 652s, 584s, 578s, 572s (br, broad; s, sharp). UV-Vis in DMF [λmax/nm (εmax/mol-1 cm-1)]: 270(237), 338(3630), 358(3900), 425(2505), 645 (75). ESI-MS (CH3OH) m/z (%): 378(15%) [M+]. Conductivity (ΛM/Scm2 mol-1) in DMF: 14.
[Zn(L1).NCS] (3)
The white colored precipitate that formed was DMF and kept for crystallization. Five days later rod- shaped green crystals are obtained. Yield: 61%. (0.18g). m.p. 143 °C (dec). Anal. Calc. (%) for C34H38Zn2N6O2S2: C, 54.18; H, 5.04; N, 11.15; S, 8.51. Found (%): C, 53.12; H, 5.22; N, 10.92; S, 8.30. FT-IR (KBr, ν, cm–1spectrum peaks: 3388br, 3055s, 2943s, 2916s, 2054s, 1632s, 1540s, 1508s, 1445s, 1437s, 1425s, 1354s, 1334s, 1306s, 1216s, 1180s, 1137s, 1102s, 1083s, 1060s, 1035s, 975s, 931s, 857s, 822s, 688s, 647s, 607s, 530s, 511s, 465s, 459s (br, broad; s, sharp). UV-Vis in DMF [λmax/nm (εmax/ mol-1 cm-1)]: 229(431), 267(862), 385(611), 634(6). ESI-MS (CH3OH) m/z (%): 382(28%) [M+]. Conductivity (ΛM/S cm2 mol-1) in DMF: 15.
FT-IR and UV-Vis spectroscopy
The infrared spectrum of the ligands showed strong band at 3390cm-1which are due to the v (NH) for complex 2. Thus, the v (C=N) band of the ligands was observed at 1648 and 1656cm-1. Furthermore, the complexes exhibited weak bands between 532 – 558cm-1 which are attributed toν(M-N). However, the spectrum of the ligands showed strong band at 1511 and1496cm 1 which attributed toν(C=O). While, the ν(C-O) appeared at 1062 and 1120cm -1 in the spectra of the free ligand. Moreover, the spectra of the complexes exhibited weak bands between435-480 cm-1which is attributed to the ν(M-O) [7] (Figure 1). The electronic spectrum of complexes (Figure 2) bands at 266–289-*transition and 314–396nm due to then→π*transition of the complexes and while the visible region show weak peaks at 536 and 599 due to the d-d transition 3A2g→ 3T2gforNi+2 complex [8].
Electrochemical studies
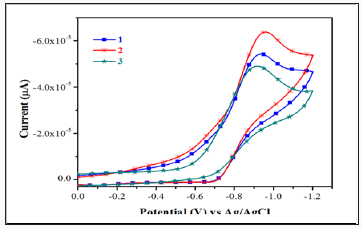
The electrochemical behavior of the complexes has been studied using cyclic voltmmetry with potential the range of 0 to -1.2V for copper (II) complexes in dimethyl form amide containing 10-1M tetra (n-butyl) ammonium pre chlorate. Cyclic voltammograms for all copper (II) and complexes (scanrate 50mVs-1)are displayedin (Figure 3). The quasi-reversible reduction wave at-1.0902 and- 0.8777 V forcomplexes1 &2 respectively.
UV–Vis absorption spectral studies
Electronic absorption spectroscopy is an efficient method to examine the binding mode of DNA with metal complexes. The absorption spectra of complexes 1–3 were recorded for a fixed concentration of free metal complex with increasing concentrations of CTDNA. DNA is the essential carrier of genetic information which was concerned with most cancers resulting from DNA damage; therefore, DNA binding is one of themos critical steps for the action of a large number of metal based anticancer drugs [9]. Electronic absorption spectroscopy is one of the most powerful experimental techniques for probing metal ion–DNA interactions. Binding of the macromolecule leads to changes in the electronic absorption spectrum of the metal complex. Electronic absorption spectroscopy is usually used to determine the binding strength and the mode of DNA binding with small molecules [10]. A variety of small molecules interact reversibly with DNA, primarily through three modes:
i. Electrostatic interactions,
ii. Binding Interactions with grooves of DNA double helix; and
iii. Intercalation between the stacked base pairs of native DNA [11].
The UV–Vis spectra of the complex in the presence and absence of CT-DNA were monitored over the wavelength range of 230–300nm as shown in (Figure 4). Arrow shows the changing absorbance upon increase of DNA concentration. With increasing concentration of CT-DNA ate fixed complex concentration (1.0×10⁻⁵M). Hyper chromicity at about 275(19%) nm for complex 1 and 278(23%)nm for complex 2 are observed. This strong hyperchromism, along with minor blue shift (8nm) for complex 1 and no significant observed for complex 2 indicates strong interaction of the complex with CTDNA mainly through groove binding [12]. It is known that the hyper chromicity of the UV absorbance band is caused by the un winding of the double helix as well as its un stacking and the concomitant exposure of the bases; whereas, red-or blue-shift indicates that the complex may have some effect on DNA [13]. In order to compare the binding strength of the complex with CT-DNA, the intrinsic binding constants Kb are obtained by monitoring the changes in absorbance for the complex with increasing concentration of DNA.
The binding constant, Kb, has been determined from the spectroscopic titration data using the equation [14]. [DNA]/ (εa-εf) =[DNA/(εb-εf)]+1/Kb(εb-εr), Where ε a is the extinction coefficient observed for the charge trans for absorption a given DNA concentration ,εf the extinction coefficient of the complex free in solution ,εb the extinction coefficient of the complex when fully bound to DNA, Kb the equilibrium binding constant, and [DNA] gives Kb as the ratio of the slope to the intercept. Kb is obtained from the ratio of slope to the intercept from the plots of [DNA]/ (εa-εf)vs[DNA]. The Kb value of complex1-3is1.75X105,1.98X105 and 2.38X10⁵M-1 respectively. From the binding constant values, It is clear that the complexes are moderate binders and complexes shows the highest binding affinity amongst them.
Fluorescent spectral studies
To understand the interaction pattern of the complex with DNA more clearly, fluorometric competitive binding experiment was carried out using ethidiumbromide (EB) as a probe that shows no apparent emission intensity in buffer solution because of solvent quenching. However, EB emits intense fluorescent light in the presence of DNA due to its strong intercalation between the adjacent DNA base pairs. A competitive binding of small molecular to CT-DNA could result in the displacement of EB or quenching of the bound EB by the complex decreasing its emission intensity. The interaction of chiff base complexes with calfthymus DNA were studied by monitoring the changes in the extrinsic fluorescence of EB at varying concentration of the tested complex Figure 5 shows the representative fluorescence emission spectra of the DNA–EB complex. The molecular fluorophore, EB, emits fluorescence in the presence of CT-DNA due to its strong intercalation between the adjacent DNA base pairs [15]. Addition of second molecules, which binds to DNA more strongly than EB, can decrease the DNA-induced EB emission [16].
Figure 5: Fluorescence emission spectra of the EB-DNA in presence of complexes 1-3. In 5mM Tris HCl/50m MNaClbuffer(pH7.2).

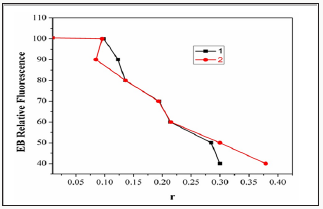
Two mechanisms have been proposed to account for this reduction in the emission intensity: the replacement of molecular fluorophores, and/or electron transfer [17]. The addition of the complex to DNA pretreated with EB causes appreciable education in the emission intensity. The intensity of the emission band at 598nm of the DNA-EB system increased (upto 14%oftheEB-DNA fluorescence intensity for complex1and36%for complex2, (Figure 6). This behavior can be analyzed through the Stern-Volmer equation [18],
Figure 6: Plot of EB relative fluorescence intensity at λem=598nm (I/I0(%))vsr(r= [complex]/[DNA]) for complexes1 &2. in buffersolution (5 mMHCl/50mMNaClat pH 7.2).
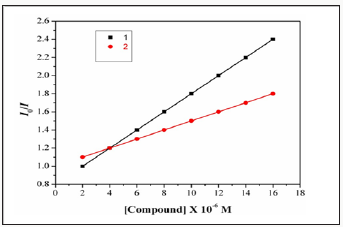
I0/I=1+Ksvr,
Where I0 and I are the fluorescence intensities in the absence and the presence of complex.KsvisalinearStern- Volmerquenchingconstant,is the ratio of the totalconcentration of complex to that of DNA. The quenching plot illustrates that the quenching of EB bound to DNA by the complexis in good agreement with the linear Stern-Volme requation, which also indicated that the complex binds to DNA. In the plot of I0/Ivs [Complex]/[DNA], Ksv is given by the ratio of the slope to intercept. From the in set in (Figure 7 & 8), the Ksv value for complexes 1&2 is 2.45X10⁴ and 2.79X10⁴M1. Such a value of quenching constant suggests that the interaction of the complex with DNA is strong [19].
BSA binding Studies
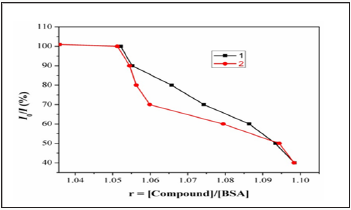
Fluorescence spectroscopy is an effective method to examine the interactions between metal complexes and BSA. Here we investigated the binding affinity of the nickel (II) Complexes 1&2 with BSA under physiological conditions. The effect of Ni(II) complexes 1&2 on the BSA fluorescence intensity is shown in (Figure 9), from which we can see clearly that BSA had a strong fluorescence emission band around 353nm by fixing the excitation waveleng that 295nm. The addition of Ni (II) complexes to the solution of BSA resulted in the quenching of its fluorescence emission without any shift, possibly due to changes in the secondary/tertiary structure of BSA in the phosphate buffer, affecting the orientation of the tryptophan residues of BSA. Under the same experimental conditions and the SA fluorescence spectra have been corrected before the experimental data processing [20]. Addition of complex 1 to BSA results in fluorescence intensity decrease upto 28% of the initial fluorescence intensity of BSA for complex 1and 17% for complex 2, as calculated after the correction of the initial fluorescence spectra (Figure 9) due to possible changes in protein secondary structure of BSA indicating the binding of the complex to BSA [21]. The value of the Stem-volme rquenching constant (Ksv,M-1) and the quenching constant (kq,M-1s-2) for complex interacting with BSA as calculated byStern-Volmerquenching equation [22-24]:
Figure 9: Plot of % relative fluorescence intensity at em=355nm (I/I0(%)vsr(r= [complexes]/[BSA]) for complexes 1 &2in buffer solution (150 mMNaCland 15 mM Trisodium citrate at pH 7.4).
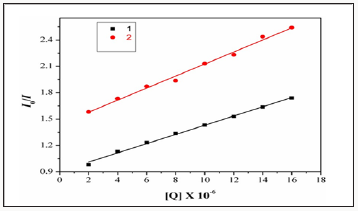
Where I0= the initial tryptophan fluorescence intensity of SA, I=the tryptophan fluorescence intensity of SA after the addition of the quencher, kq=the quenching rate constants of SA, Ksv=the Stern-Volmer quenching constant, 0= the average lifetime of SA without the quencher, [Q]=the concentration of the quenche rrespectively, for complexes 1 &2 in buffer solution (150mM NaCl and 15mM Trisodium citrate at pH 7.4). And taking as fluorescence life time (0) of tryptophan in SA at around 10-8s, the Stern-Volmer quenching constant (Ksv,M-1) can be obtained from the slope of the diagram I0/I vs [Q] (Figure 10), and subsequently the approximate quenching constant (kq, M-1s-1) maybe calculated. The calculated values of Ksv and kq for the interaction of the complex with BSA are given in.
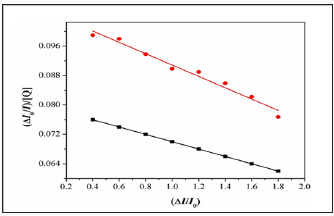
It indicate a good BSA binding propensity of the complex exhibiting the highest BSA quenching ability. The kq values are higher than diverse kinds of quenchers with the existence of a static quenching mechanism [23]. Using the Scat chard equation [24]. where n is the number of binding sites per albumin and K is the association binding constant, K (M-1), may be calculated from the slope of plots of (I0/I)/[Q]vs(I/I0) (Figure 11) and n is given by the ratio of the y intercept to the slope. The K values of the complex 1 for albumins, being in the value given. The Stern-Volmer equation applied for the interaction with BSA in (Figure 10) shows that the curves have fine line a r relationships (r=0.9715- 9876). The calculated values of Ksv and kq are given in which indicates the irgood BSA binding propensity with complex. Therefore, the study of the binding to albumins may reveal useful information concerning future application.
Conclusion
We have synthesized and characterized the Manganese (II), Iron(II) and Zinc(II) complexes(1-3). The electro chemical properties of the complexes 1-3 show two irreversible waves at-0.75&-0.85 and-0.27&-0.39, respectively. The DNA binding properties of the complexes 1-3 show hyper chromism with Kb value of 1.75X10, 1.98 X10⁵ and 2.38X10⁵M-1 respectively. The complex 1 show better DNA binding agent than the complex 2 and 3. These studies for man important rationale for drug design and warrant further in vivo experiments and pharmacological assays.
References
- Pravin N, Devaraji V, Raman N (2015) International journal of biological macromolecules Int J Biol Macromol 79: 837-855.
- Gurumoorthy P, Mahendiran D, Prabhu D, Arulvasu C, Rahiman AK (2015) Mixed-ligand copper (II) phenolate complexes: Synthesis, spectral characterization, phosphate-hydrolysis, antioxidant, DNA interaction and cytotoxic studies. J Mol Struct 1080: 88-98.
- Kumaravel G, Raman N, Mater C (2017) A treatise on benzimidazole based Schiff base metal(II) complexes accentuating their biological efficacy: Spectroscopic evaluation of DNA interactions, DNA cleavage and antimicrobial screening. Biol Appl 70: 184-194.
- Siddiqi ZA, Khalid M, Kumar S, Shahid M, Noor S (2010) Antimicrobial and SOD activities of novel transition metal complexes of pyridine-2, 6-dicarboxylic acid containing 4-picoline as anauxiliary ligand. Euro J Med Chem 45(1): e264-e269.
- Sahoo J, Paidesetty SK (2015) Antimicrobial activity of novel synthesized coumarin based transitional metal complexes. J Taibah Univ Med Sci 10: E306-e319.
- Sahoo J, Mekap SK, Paidesetty SK (2016) Antimicrobial activity of novel synthesized coumarin based transitional metal complexes J TaibahUnivSci 9: 1-10./
- Tabassum S, Ahmad M, Afzal M, Zaki M, Bharadwaj PK (2014) Synthesis and structure elucidation of a copper (II) Schiff-base complex: in vitro DNA binding, pBR322 plasmid cleavage and HSA binding studies. Journal of Photochemistry and Photobiology B:Biology 140: 321-331.
- Lerman LS (1961) Structural considerations in the interaction of DNA and acridines. J Mol Biol 3: 18-30.
- Lerman LS (1961) Structural considerations in the interaction of DNA and acridines. J Mol Biol 3: 18-30.
- Mancin F, Scrimin P, Tecilla P, Tonellato U (2005) Artificial metallo nucleases. Chemical Communications 20: 2540.
- Song YL, Li YT, Wu ZY (2008) Synthesis, crystal structure, antibacterial assay and DNA binding activity of new binuclear Cu(II) complexes with bridging oxamidate. J Inorg Biochem 102(9): 1691-1619.
- Hirohama T, Kuranuki Y, Ebina E, Sugizaki T, Arii H, et al. (2005) Copper (II) complexes of 1,10-phenanthroline-derived ligands: studies on DNA binding properties and nuclease activity. J Inorg Biochem 99(5): 1205- 1219.
- Wolfe A, Shimer GH (1987) Polycyclic aromatic hydrocarbons physically intercalate into duplex regions of denatured DNA. Meehan T Biochemistry 26(20): 6392-6396.
- Sallam SA, Orabi AS, Abbas AM (2011) J Mol Struct 1006: 272.
- Olmsted J, Kearns DR (1977) Mechanism of ethidium bromide fluorescence enhancement on binding to nucleic acidsBiochemistry 16(16): 3647-3654.
- Baguley BC, Lebret M (1984) Biochemistry 23: 937.
- Pasternack RF, Cacca M, Keogh B, Stephenson TA, Williams AP, Gibbs FJ (1991) J Am Chem Soc 113: 6835.
- Karastogianni S, Samara CD, Ioannou E, Raptopoulou CP, Litina DH, Girousi S (2013) J Inorg Biochem 118: 48.
- Liu J, Zhang TX, Lu TB, Qu LH, Zhou H, Zhang QL, Ji LN (2002) J Inorg Biochem 91: 269.
- Tabassum S, Asim A, Arjamand F, Afzal M, Bagchi V (2012) Synthesis and characterization of copper (II) and zinc(II)-based potential chemotherapeutic compounds: their biological evaluation viz. DNA binding profile, cleavage and antimicrobial activity. Eur J Med Chem 58: 308-312.
- Wang F, Yin H, Cui J, Zhang Y, Geng H, Hong M (2014) J Organomet Chem 759: 83.
- Tsiliou S, Kefala LA, Perdih F, Turel I, Kessissoglou DP, et al. (2012) Cobalt(II) complexes with non-steroidal anti-inflammatory drug tolfenamic acid: Structure and biological evaluation. Eur J Med Chem 132(48): 132-142
- Zampakou M, Akrivou M, Andreadou EG, Raptopoulou CP, Psycharis V, et al. (2013) Structure, antimicrobial activity, DNA- and albumin-binding of manganese(II) complexes with the quinolone antimicrobial agents oxolinic acid and enrofloxacin. J Inorg Biochem 121: 88-99.
- Rajendiran V, Karthik R, Palaniandavar M, Evans HS, Periasamy VS, et al. (2007) Mixed-ligand copper(II)-phenolate complexes: effect of coligand on enhanced DNA and protein binding, DNA cleavage, and anticancer activity. Inorg Chem 46(20): 8208-8221.

Top Editors
-

Mark E Smith
Bio chemistry
University of Texas Medical Branch, USA -

Lawrence A Presley
Department of Criminal Justice
Liberty University, USA -

Thomas W Miller
Department of Psychiatry
University of Kentucky, USA -

Gjumrakch Aliev
Department of Medicine
Gally International Biomedical Research & Consulting LLC, USA -

Christopher Bryant
Department of Urbanisation and Agricultural
Montreal university, USA -

Robert William Frare
Oral & Maxillofacial Pathology
New York University, USA -

Rudolph Modesto Navari
Gastroenterology and Hepatology
University of Alabama, UK -

Andrew Hague
Department of Medicine
Universities of Bradford, UK -

George Gregory Buttigieg
Maltese College of Obstetrics and Gynaecology, Europe -

Chen-Hsiung Yeh
Oncology
Circulogene Theranostics, England -
.png)
Emilio Bucio-Carrillo
Radiation Chemistry
National University of Mexico, USA -
.jpg)
Casey J Grenier
Analytical Chemistry
Wentworth Institute of Technology, USA -
Hany Atalah
Minimally Invasive Surgery
Mercer University school of Medicine, USA -

Abu-Hussein Muhamad
Pediatric Dentistry
University of Athens , Greece

The annual scholar awards from Lupine Publishers honor a selected number Read More...


