
Lupine Publishers Group
Lupine Publishers
Menu
ISSN: 2638-5945
Research Article(ISSN: 2638-5945) 
Metformin Treatment Represses Vascular Endothelial Growth Factor Gene Transcription in MCF-7 Breast Cancer Cells Volume 1 - Issue 3
Mohamed Alalem*1,2 and Bimal K Ray1,2
- 1Department of Veterinary Pathobiology, University of Missouri USA
- 2Genetics Area Program, University of Missouri, USA
Received: April 15, 2018; Published: April 19, 2018
Corresponding author: Mohamed Alalem, Department of Veterinary Pathobiology and Genetics Area Program, University of Missouri- Columbia, MO 65211, USA
DOI: 10.32474/OAJOM.2018.01.000115
Abstract
Background/Aim:Targeting angiogenesis preferentially in cancer is a promising approach to improve treatment efficacy and safety. The aim of this study is investigate potential upregulation of Krüppel like factor-4(KLF-4) by inhibition of mammalian target of rapamycin (mTOR) to repress vascular endothelial growth factor (VEGF) expression in breast cancer cells. Materials and Methods: Using Western blot; bandshift assay; and Chloramphenicol acetyltransferase assay, we assessed the effect of different mTOR inhibitors on the level of mTOR pathway proteins and on KLF-4/ serum amyloid activating factor (SAF-1) SAF-1 DNA binding and consequently VEGF gene expression in MCF-7breast cancer cells. Results: mTOR inhibition increased KLF-4 level in breast cancer cells, but this inhibition, except for metformin, elicited rebound upregulation of mTOR signaling proteins. Thus metformin produced a sustained increase in KLF-4 level and concomitant disruption of SAF-1 binding to VEGF promoter with consequent inhibition of VEGF expression.
Conclusion:Repurposing metformin as a potential neoadjuvant and antiangiogenic treatment could provide the basis for more effective and safer antiangiogenic treatment.
Keywords: Metformin, mTOR, VEGF, Breast cancer
Introduction
One of the invasive characteristics of a solid tumor is its ability to form new blood vessels to sustain its growth through angiogenesis [1]. Besides mediating local tumor growth, angiogenesis also promotes tumor dissemination by providing a conduit for tumor cells to access bloodstream and settle in distal organs as metastatic foci [2], which are, in turn, growth-restricted without angiogenesis [3]. Several reports showed that increased angiogenesis in cancer adversely affects patients prognosis [4]; therefore, angiogenesis is a promising target for cancer treatment. Angiogenesis is regulated by delicate balance between proangiogenic and anti angiogenic molecules. Vascular endothelial growth factor (VEGF) is one of the main proangiogenic molecules secreted by breast cancer cells. Over expression of VEGF proteins is notably a characteristic of positive estrogen-receptor (ER+) status in breast tumor cells and is strongly correlated with the stage of the tumors [5].
One of the contributing factors for over expression of VEGF protein is the over expression of the VEGF gene, which is unregulated in many cancer conditions [6] including ER+ breast cancer cells [7]. The incidence of ER+ subtype of breast cancer is on the rise recently and they represent the main subset of breast tumors nowadays [8]. High VEGF expression in the ER+ breast cancer cells in particular has been shown to promote invasiveness and metastasis of these cells [9]. Antiangiogenic treatment strategies for breast cancer treatment may include monoclonal anti-VEGF antibody, bevacizumab [10], or anti- VEGF receptor (VEGFR) treatment [11]. Although bevacizumab has been approved by the FDA for the treatment of metastatic breast cancer, clinical trials have shown controversial results regarding the efficacy of this treatment and its safety for this indication [10,11].
Antiangiogenic agents in general impose risk of various adverse effects, which may involve life-threatening bleeding disorders, wound-healing complications and cardiotoxicity [12,13]. These side effects could be possibly attributed to the inadvertent action of these agents on healthy vasculatures, while the low effectiveness of the treatment could be possibly attributed to the use of these agents at late stages in breast cancer when the tumor is unlikely to benefit from treatment. Invasive variants of breast neoplasia are known to express VEGF copiously even at early stages of their course [14]. Trials are now underway exploring several antiangiogenic approaches at early stages of breast cancer. Although this strategy may improve treatment efficacy, the risk of side effects is expected to be even higher with the prolonged administration of the current antiangiogenic treatment [12].
In spite of being a hall mark for tumor invasiveness, angiogenesis occurs also in normal tissues and it is known to be triggered by various types of cellular stress [4]. Undoubtedly, hypoxia is a potent stimulus for VEGF production [15]; however, it may not be the only mechanism [16,17] nor the main one in breast cancer cells [7]. In breast cancer angiogenesis occurs at early stages prior to the transformation of breast cells to malignancy [3]. This indicates that VEGF expression in these cells at early stages may occur via another mechanism independent of hypoxia. Therefore, the goal of research, nowadays, is to explore other potential mechanisms of targeting angiogenesis specifically in breast cancer cells at early stages. This study aims at exploring other potential mechanism mediating VEGF expression in breast tumors besides hypoxia. One of these mechanisms could be the upregulation of serum amyloid activating transcription factor (SAF-1), which is over expressed in some breast tumors and competes with the antiangiogenic Krüppel like factor-4 (KLF-4) to regulate VEGF gene expression in breast cancer cells [7].
Evidence shows that inhibition of mammalian target of rapamycin (mTOR) in vascular smooth muscle cells (VSMC) induces KLF-4, which results in antiproliferative effects in these cells [18]. Therefore, our hypothesis was that inhibition of mTOR in breast cancer cells could, similarly, upregulate KLF-4 level and consequently counteract the angiogenic potentials of these cells.
Materials and Methods
Cell lines and reagents: MCF-7 cell lines were obtained from ATCC, cultured, and stored following the ATCC protocol of authentication by short terminal repeat analysis. The cells were maintained in DMEM/high glucose medium supplemented with 7% FBS. Insulin, chymostatin, leupeptin, pepstatin A, metformin, and the catalytic mTOR inhibitor (PP242) purchased from Sigma Chemical Co.
Western blot analysis: MCF-7 cells were freeze-thawed in lysis buffer containing cocktail of protease and phosphatase inhibitors. Protein amount in cell lysates were measured by NanoDrop spectrophotometer. Equal protein amount was fractionated in SDS-PAGE, transferred to PVDF transfer membrane (PerkinElmer) and immunoblotted. Anti-bodies utilized are anti- (mTOR, pmTOR (Ser-2448), pP70S6K (T-389), β-Actin antibodies (Cell Signaling Technology), KLF-4 (Santa Cruz Biotechnology), and SAF-1 (prepared previously in the lab as described in [19]. Blots were developed with ECL (Pierce Thermo Scientific). B and densitometry was measured by (AlphaView imaging software, FluorChem Q system, ProteinSimple) and semi-quantitative data normalized for β- actin.
Nuclear extract preparation: electrophoretic mobility shift assay. Nuclear extracts were prepared from MCF-7 cells according to a method previously described by [20], and electrophoretic mobility shift assay was performed using the method described by Ray and colleagues [21]. The VEGF DNA–sequences from -135 to +29 was end-labeled by using 32P-dCTP and used as the probe.
Plasmid constructs: The reporter plasmid 1.2 VEGF-CAT3 was constructed by cloning VEGF promoter sequence (-1,179 to +21) into pBLCAT3 plasmid vector. The used VEGF promoter sequence included SAF-1 binding site I with the sequence (5´-CCCCTATCCTCGCGCCGGTCCGTGGTCGGTGTC-3´) and SAF-1 binding site II with the sequence (5´-ATGCTTCTCCTACTAGTT-3´).
Transfection analysis: The MCF-7 cells were transfected with reporter plasmid DNA (0.5 mg) together with pSVβ-gal (Promega Corporation) plasmid DNA (0.5 mg) by using METAFECTENE PRO (Biontex Laboratories). The pSVβ-gal DNA was used for efficient transfection and cell extracts normalization for chloramphenicol acetyltransferase (CAT) assay. After 24 hours, the cells were harvested, and CAT and β-galactosidase activities were measured according to protocols adopted from [22].
Chloramphenicol acetyl transferase (CAT) assay: Following transfection of cells with reporter plasmid 1.2 VEGF-CAT, empty vector or pBLCAT3 as described previously CAT assay was performed. In each transfection assay, pSV ß-gal (Promega) DNA was added for normalization of transfection efficiency.
Statistical analysis: Correlation was calculated using Pearson product moment correlation (r, and p<0.05 was considered statistically significant). Differences in the mean values were analyzed by One-way Analysis of Variance ANOVA with posthoc Holm-Sidak method. Results represent the average of three independent experiments (n=3; mean ± SD, and *P <0.05 was considered statistically significant), Data analyzed by (Sigmaplot software program 12.3 from Systat Software, Inc., San Jose California, USA).
Results
mTOR inhibition resulted in an increase in the level of KLF-4 protein in the ER+, MCF-7, breast cancer cells particularly with metformin treatment. Treatment of the MCF-7 cells with PP242 and metformin both resulted in an increase in KLF-4 expression in these cells as demonstrated by the results of immunoblot assay in Figures 1A &1B, respectively. These results show that both PP242 and metformin exerted a comparable effect in terms of their ability to inhibit mTOR phosphorylation. However, PP242 and metformin has different effects on the level of total mTOR protein. PP242 elicited an apparent rebound increase in the total mTOR protein level in a dose dependent manner, metformin, on the other hand, was not associated with such rebound up regulation of mTOR even after 24 hours of treatment as shown by the trend line in Figure 1. A and B, respectively. In fact, metformin treatment was associated with a slight decrease in total mTOR protein level.
Figure 1: Effect of mTOR inhibition on KLF-4 level in ER+ MCF-7 breast cancer cells. A. MCF-7 cells were treated with insulin 1μM for 1hr with and without the catalytic mTOR inhibitor, PP242, in the following concentrations (3, 9, 12, and 15μM) for 4hrs. 100μg of the total cell lysate was fractionated in SDS-PAGE, transferred to PVDF membrane and stained with Ponceau S stain for verification of equal protein loading then immunoblotted for KLF-4, pmTOR and total mTOR protein levels. A line-graph representation shows the dose-dependent changes of the protein levels as determined by band densitometry analysis. B. MCF-7 cells were treated with insulin 1μM for 1hr and metformin 50mM for the following durations (0, 12, and 24hrs). 100μg of the total cell lysate was fractionated in SDS-PAGE, transferred to PVDF membrane and stained with Ponceau S stain to ensure equal protein loading then immunoblotted for KLF-4, pmTOR and total mTOR protein levels. The time-dependent changes of protein levels following metformin treatment are illustrated in the accompanying line-graph as determined by band densitometry analysis. The correlation between protein levels and dose or time-dependent treatment was calculated using Pearson product moment correlation (r, p<0.05 for statistical significance).
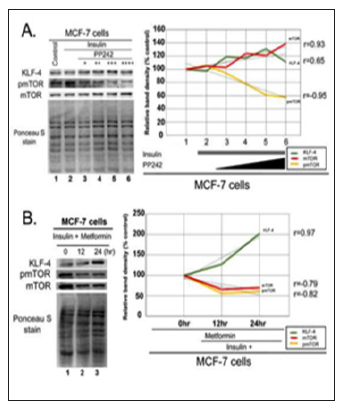
Figure 2: Effect of mTOR inhibition on the status of total proteins in mTOR pathway. A.MCF-7 cells were treated with insulin 1 μM for 1 hour in the presence and absence of PP242 (0, 3, 9, 12, or 15 μM) for 4 hrs. B. MCF-7 cells were treated with insulin 1 μM for 1 hour in the presence or absence of metformin 75mM for 8 hrs or rapamycin 100nM for 8 hrs.100 μg total MCF-7 cell lysate was fractionated in SDS-PAGE, transferred to PVDF transfer membrane, which are immunoblotted for pP70-S6K to assess the effect of treatment on mTOR activity, then the membranes were stripped and re-blotted for ß- actin to verify equal loading.
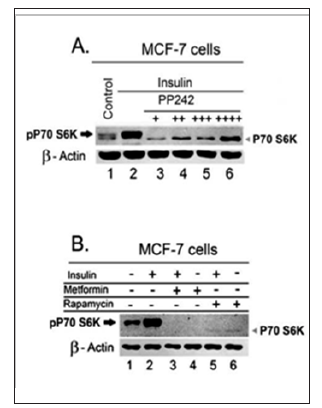
Different mTOR inhibitors elicit a different degree of apparent rebound upregulation of total proteins in mTOR pathway. One of the possible compensatory mechanisms to mTOR inhibition could be the upregulation of the total proteins in mTOR pathway. To verify the effect of the mTOR inhibitors on mTOR activity and level of total proteins in mTOR pathways, we assessed the effect of treatments on the phosphorylation of the downstream target of mTOR, pP70-S6K. Both PP242 and metformin resulted in a comparable inhibition of the phosphorylation of P70-S6K as shown in Figure 2. A and B, respectively. Consistent with previous results, PP242 treatment, similarly, showed a reciprocal increase in a band consistent with total P70-S6K protein moiety as indicated by the arrowhead in Figure 2, A. In contrast, metformin and rapamycin showed no or less increase in this band as shown by the arrowheads in Figure 2.B, lanes 3, and 4 as well as lanes 5, and 6, respectively.
Metformin treatment resulted in a noticeable change in the binding of DNA-protein complexes to the VEGF promoter region. Band-shift assay of MCF-7 cells using a DNA probe of the VEGF promoter containing (GC)-rich region, as illustrated in Figure 3A, was performed to verify the effect of mTOR inhibition on the binding of zinc finger transcription factors. Metformin markedly affected protein-DNA complexes as manifested by the significant decrease in the density of the band (a) at high metformin concentration as shown by the black arrows in lane 10 Figure 3B, and lane 10´ in Figure 3B´. Based on our previous research findings, the band (a) likely corresponds to SAF-1 and/or Sp1 and band (b) represents KLF-4 (7). This suggests that metformin treatment not only up regulates KLF-4 level in MCF-7 cells, but also affects the binding of SAF-1 as well. In accordance with these findings, WB analysis of MCF-7 cells for SAF-1 shows that metformin treatment induced an increase in a band consistent with different SAF isoforms as indicated by the arrows in Figure 3C.
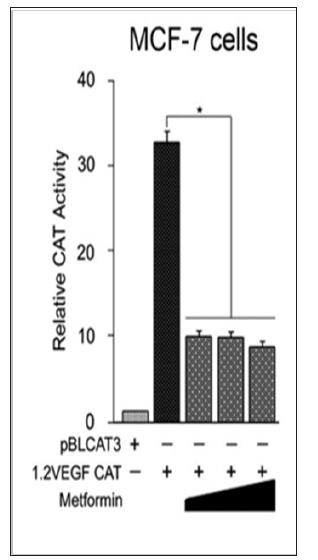
Metformin treatment transcriptionally inhibits VEGF gene expression in the ER+ breast cancer cells. Increased KLF-4 protein level in MCF-7 cells by metformin treatment, Figure 1B, coincided with a marked decrease in the DNA- protein complex SAF-1/Sp1 and an increase in KLF-4 as shown in Figure 3B. These findings suggest a consequent alteration in VEGF gene expression in MCF- 7 cells following metformin treatment. Therefore, our next step was to explore as whether metformin treatment would result in an inhibition of transcription of VEGF gene in MCF-7 breast cancer cells. To test this hypothesis, CAT assay was performed on MCF- 7 cells with and without treatment with metformin. As shown in figure 4, metformin treatment resulted in a significant inhibition of the transcription of VEGF gene.
Figure 3: Effect of metformin treatment on the proteins complexes binding to the VEGF promoter. A. A schematic representation of the VEGF promoter region and transcription factors binding sites. HIF-1- binding site is located distal to a (GC)-rich region on the VEGF promoter. The (GC) region is known binding site for zinc finger transcription factors including SAF-1, Sp1 and KLF-4. Increased levels of SAF-1 drive VEGF expression, while increased levels of KLF-4 inhibit VEGF expression. B. MCF-7 cells were treated with insulin (0.0, 0.5.1.0, 2.0, and 4.0 μM) for 1 hour, metformin (0, 10, 25, 50, or 75 mM) for 4 hrs. Total cell extracts (10μg of protein) were incubated with 32P-labeled VEGF promoter containing sequences from (- 110 to + 20). Resulting DNA protein complexes (a, and b) were fractionated in a 6% nondenaturing polyacrylamide gel. Migration positions of putative protein-DNA complexes are indicated. B′. Band-shift assay was duplicated for the indicated correspondent lanes for the verification of results. C. WB of MCF-7 cells treated with insulin 1μM for 1hr with and without metformin 75mM in a time-course of (0.0, 0.5, 1.0, 4.0, 8.0 hrs). 100μg of total cell lysates of MCF-7 cells was fractionated and immunoblotted for SAF-1. PVDF membranes were stained with Ponceau S stain for equal loading. Expected molecular weight of protein bands are indicated in Kilo Dalton (KD) on the left side.
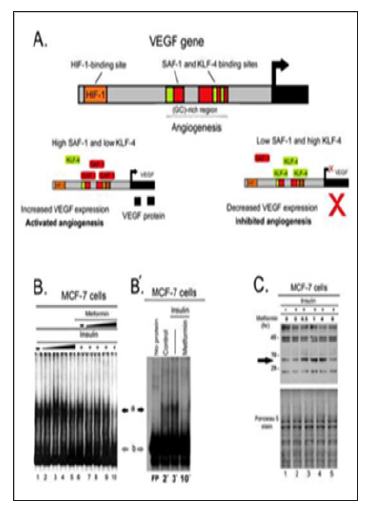
Figure 4: Effects of metformin on the VEGF gene expression in the ER+ MCF-7 breast cancer cells. MCF-7 cells were transfected with equal amounts (0.5 μg) of pBLCAT3 or 1.2 VEGF-CAT. 24hrs after transfection, cells were supplemented with increasing concentrations of metformin (25, 50 and 75 mM). Cells were harvested 24 hrs later and CAT activity was determined using equivalent amount of cell extracts. Relative CAT activity was determined by comparing the activities of transfected plasmids with that of pBLCAT3. Results are an average of three separate experiments and differences in mean values were assessed for statistical significance using one way ANOVA with *P < 0.05.
Discussion
Phosphatidylinositol 3 Kinase (PI3K)-mTOR signaling pathway is activated by growth factors to stimulate phosphorylation of mTOR and its downstream targets [23]. This pathway is activated in many cancer conditions to mediate tumor proliferation, migration and angiogenesis [24]. Activation of mTOR is linked also to emergence of resistance of breast tumors to chemotherapy and hormonal therapy [25]. mTOR inhibition shows beneficial effects in mitigating resistance to targeted and hormonal treatment in breast cancer [26]. Activation of mTOR upregulates VEGF expression in tumor cells even under normoxic conditions [27]. These factors together make mTOR pathway a promising potential target for breast cancer therapy particularly as an antiangiogenic treatment in breast cancer cells at early stages.
Several mTOR inhibitors have different mechanisms of action and consequently different effects, safety profile, and tolerability. Rapamycin is a specific allosteric mTOR inhibitor of mTOR, which inhibits the growth of a variety of epithelial cancers [28]. However, many cancers become refractory to rapalogs [29] due to activation of compensatory pathways [30]. PP242, is another mTOR inhibitor that competes with ATP to prevent mTOR activation [31]. Metformin, on the other hand, is an anti-diabetic biguanide, which inhibits mTOR activity and showed a beneficial effect in breast cancer cells by decreasing MTOR gene expression [32] as well as stimulating mTOR protein degradation [33]. Metformin has a relatively safe profile and tolerability [34]; therefore, it is a strong candidate for repurposing as an anticancer agent.
PP242 and metformin increased the level of KLF-4 protein. Despite the comparable effect of those two mTOR inhibitors on the mTOR activity. Metformin treatment exhibited stronger and more sustained increase in KLF-4 level even after prolonged time of treatment compared to the PP242 treatment in which KLF-4 level waned by the concomitant waxing of total mTOR level. The role of the active form of mTOR in tumorigenesis is well-established [35]; however, the role of total mTOR protein in these processes is still less characterized. Rebound upregulation of total proteins in mTOR signaling pathway could impose a risk of resistance to treatment. Rebound increase in the total level of mTOR protein in MCF-7 cells following PP242 treatment is evidenced from the incremental increase in the total mTOR protein with the treatment.
This dose-dependent upregulation of total mTOR protein level could be also responsible for the dose-dependent waning of KLF-4 level associated with the PP242 treatment. In contrast, metformin treatment was rather associated with a concomitant time-dependent decrease in the total level of mTOR protein. In addition, PP242 treatment showed also a concomitant increase in a band consistent with the total P70-S6K protein in MCF-7 cells, while rapamycin treatment induced a slight increase in this band, metformin treatment, on other hand, showed no increase in total P70-S6K. Metformin alters the profile of DNA-protein
complexes binding to VEGF promoter in MCF-7 cells. The first step of VEGF expression starts at the transcription level of VEGF gene. A constellation of cis-regulatory elements has been identified within the 5′-flanking promoter region of VEGF gene including binding sites for hypoxia inducible factor-1 (HIF-1) and specificity protein-1 (Sp1), which are known to mediate VEGF gene expression in different cancer cells [36].
Hypoxia leads to induction of HIF-1, which drives VEGF expression and promotes angiogenesis in the hypoxic tissues [37]. However, many cancer cell types can express high levels of VEGF under normoxic conditions [27] and even in the absence of HIF-1 [6]. The promoter region of VEGF gene contains a (G+C)-rich region proximal to HIF-1 binding site [36], which is known to interact with Sp1 to regulate VEGF expression in several cancer cells [16,38]. It serves as a binding site for SAF-1, which is elevated in breast cancer tissues compared to their normal counterparts. SAF-1 and KLF-4 competitively antagonize each other on their effect on VEGF gene expression [7]. KLF-4 binds to (C+G) regions in gene promoters [39-41] and acts generally as a tumor suppressor hence it is downregulated in several types of cancer [42-44] including breast cancer [7].
Band-shift assays of the profile of proteins binding to the promoter region of VEGF gene shows that treatment of MCF-7 cells with high concentration of metformin resulted in a noticeable change in DNA-protein complexes bound to the VEGF promoter, which suggests that metformin treatment not only upregulates KLF-4 level in MCF-7 cells, but also affects the binding and/or the expression of SAF-1 as well. In accordance with these findings, WB analysis of MCF-7 cells for SAF-1 shows that metformin treatment induced an increase in a band consistent with different SAF isoforms. In spite of being interesting, these results warrant further verification of the nature and role of these proteins in transcription of VEGF promoter. However, evidence shows that some splice variants of SAF protein may act as repressors of VEGF transcription [45]. These findings together suggest a role of metformin treatment in the modulation of the levels as well as VEGF-binding affinity of KLF-4 and SAF-1/Sp1 complexes in the ER+ MCF-7 breast cancer cells. Finally, CAT assay results show that metform in treatment resulted in a significant inhibition of the transcription of VEGF gene in the MCF-7 cells as shown in Figure 4, which would result in inhibition of the tumor’s angiogenic potentials.
Conclusion
mTOR inhibition upregulated KLF-4 in MCF-7 breast cancer cells, which was associated with repression of VEGF transcription in these cells. Our findings revealed also that the use of mTOR inhibitors, except metformin, prompted a reciprocal upregulation of total proteins in mTOR pathway in ER+ breast cancer cells, which makes metformin a promising candidate for adjuvant treatment of this type of breast cancer. These findings could provide a basis of novel therapeutic treatment modalities to counteract angiogenesis in the ER+ breast cancer, which imposes less risk of rebound upregulation and the consequent emergence of refractories to the treatment modality.
Authors’ Contributions
Conception and development of methodology: M. A, and B.R. Ray. Data acquisition: M.A. Analysis and interpretation: M. A, and B.R. Manuscript writing: M.A. Revision & study supervision: B.R.
Funding
This work was financially supported by the College of Veterinary Medicine Faculty Research Activity Grant and the Department of Veterinary Pathobiology for research assistantship (to M. Alalem).
References
- Nussenbaum F, Herman IM (201) Tumor angiogenesis: Insights and innovations. J Oncol.
- Zetter BR (1998) Angiogenesis and tumor metastasis. Annu Rev Med 49(1): 407-424.
- Schneider BP, Miller KD (2005) Angiogenesis of Breast Cancer. J Clin Oncol 23(8):1782-1790.
- Pang RWC, Poon RTP (2006) Clinical Implications of Angiogenesis in Cancers. Vasc Health Risk Manag 2(2): 97-108.
- Heer K, Kumar H, Read JR, Fox JN, Monson JRT, et al. (2001) Serum Vascular Endothelial Growth Factor in Breast Cancer. Clin Cancer Res [Internet] 17(11): 3491 LP-3494.
- Mizukami Y, Kohgo Y, Chung DC (2007) Hypoxia Inducible Factor- 1-Independent Pathways in Tumor Angiogenesis. Clin Cancer Res [Internet] 13(19): 5670-5674.
- Ray A Alalem M, Ray BK (2013) Loss of epigenetic kruppel-like factor 4 histone deacetylase (KLF-4-HDAC)-mediated transcriptional suppression is crucial in increasing vascular endothelial growth factor (VEGF) expression in breast cancer. J Biol Chem 288(38): 27232-27242.
- Li C, Malone K, Porter P, Weiss N, Tang NT, et al. (2003) Relationship between long durations and different regimens of hormone therapy and risk of breast cancer 289(23): 3254-3263.
- Pathak AP, McNutt S, Shah T, Wildes F, Raman V, et al. (2013) In Vivo “MRI Phenotyping” Reveals Changes in Extracellular Matrix Transport and Vascularization That Mediate VEGF-Driven Increase in Breast Cancer Metastasis. PLoS One 8(5): e63146.
- Lord S, Harris AL (2012) Angiogenesis - still a worthwhile target for breast cancer therapy? Breast Cancer Res (Suppl 4): S19-S19.
- Nagy JA, Dvorak HF (2012) Heterogeneity of the tumor vasculature: the need for new tumor blood vessel type-specific targets. Clin Exp Metastasis 29(7): 657-662.
- Derleth C, Mayer IA (2010) Antiangiogenic Therapies in Early-Stage Breast Cancer. Clin Breast Cancer (Suppl 1): E23-E31.
- Taugourdeau Raymond S, Rouby F, Default A, Jean Pastor MJ (2012) Bevacizumab-induced serious side-effects: a review of the French pharmacovigilance database. Eur J Clin Pharmacol 68(7): 1103-1107.
- Gasparini G (2000) Prognostic Value of Vascular Endothelial Growth Factor in Breast Cancer. Oncol (suppl 1): 37-44.
- Yang Y, Sun M, Wang L, Jiao B (2013) HIFs, angiogenesis, and cancer. J Cell Biochem 114(5): 967-974.
- Abdelrahim M, Smith R, Burghardt R, Safe S (2004) Role of Sp Proteins in Regulation of Vascular Endothelial Growth Factor Expression and Proliferation of Pancreatic Cancer Cells. Cancer Res 64(18): 6740 LP- 6749.
- Gonzalez Perez RR, Guo S, Watters A, Zhou W, Leibovich SJ (2010) Leptin upregulates VEGF in breast cancer via canonic and non-canonical signaling pathways and NFκB/HIF-1α activation. Cell Signal 22(9): 1350-1362.
- Wang Y, Zhao B, Zhang Y, Tang Z, Shen Q, et al. (2012) Krüppel-like factor 4 is induced by rapamycin and mediates the anti-proliferative effect of rapamycin in rat carotid arteries after balloon injury. Br J Pharmacol 165(7): 2378-2388.
- Ray A, Bal BS, Ray BK (2005) Transcriptional induction of matrix metalloproteinase-9 in the chondrocyte and synoviocyte cells is regulated via a novel mechanism: evidence for functional cooperation between serum amyloid A-activating factor-1 and AP-1. J Immunol 175(6): 4039-4048.
- Ray BK, Ray A (1997) Involvement of an SAF-like transcription factor in the activation of serum amyloid A gene in monocyte/macrophage cells by lipopolysaccharide. Biochemistry 36(15): 4662-4668.
- Ray BK, Shakya A, Ray A (2007) Vascular Endothelial Growth Factor Expression in Arthritic Joint Is Regulated by SAF-1 Transcription Factor. J Immunol 178(3): 1774 LP-1782.
- Sambrook J, Russell D (2001) Molecular cloning: a laboratory manual. (3rd edn.), Cold Spring Harbor Laboratory Press, USA.
- Ray A, Alalem M, Ray BK (2014) Insulin signaling network in cancer. Indian J Biochem Biophys 51(6): 493-498.
- Karar J, Maity A (2011) PI3K/AKT/mTOR Pathway in Angiogenesis. Frontiers in Molecular Neuroscience 4: 51.
- Margariti N, Fox SB, Bottini A, Generali D (2011) Overcoming breast cancer drug resistance with mTOR inhibitor, Could it be a myth or a real possibility in the short-term future? Breast Cancer Res Treat 128(3): 599-606.
- Mayer I (2013) Role of mTOR Inhibition in Preventing Resistance and Restoring Sensitivity to Hormone-Targeted and HER2-Targeted Therapies in Breast Cancer. Clin Adv Hematol Oncol 11(4): 217-224.
- Pore N, Liu S, Shu HK, Li B, Haas Kogan D, et al. (2004) Sp1 Is Involved in Akt-mediated Induction of VEGF Expression through an HIF-1 independent Mechanism. Mol Biol Cell 15(11): 4841-4853.
- Dowling RJO, Zakikhani M, Fantus IG, Pollak M, Sonenberg N (2007) Metformin Inhibits Mammalian Target of Rapamycin-Dependent Translation Initiation in Breast Cancer Cells. Cancer Res 67(22): 10804 LP-10812.
- Kurmasheva RT, Huang S, Houghton PJ (2006) Predicted mechanisms of resistance to mTOR inhibitors. Br J Cancer 95(8): 955-960.
- Hoang B, Benavides A, Shi Y, Yang Y, Frost P, et al. (2012) The PP242 Mammalian Target of Rapamycin (mTOR) Inhibitor Activates Extracellular Signal-regulated Kinase (ERK) in Multiple Myeloma Cells via a Target of Rapamycin Complex 1 (TORC1)/ Eukaryotic Translation Initiation Factor 4E (eIF-4E)/RAF Pathway and Activation is a mechanism of resisteance. J Biol Chem 287(26): 21796-21805.
- Feldman ME, Shokat KM (2010) New inhibitors of the PI3K-Akt-mTOR pathway: insights into mTOR signaling from a new generation of Tor Kinase Domain Inhibitors (TORKinibs). Curr Top Microbiol Immunol 347: 241- 262.
- Alalem M, Ray A, Ray B (2016) Metformin treatment decreases mTOR mRNA level in MCF-7 Breast Cancer Cells. Ibnosina J Med Biomed Sci 8(4).
- Alalem M, Ray A, Ray BK (2016) Metformin induces degradation of mTOR protein in breast cancer cells. Cancer Med 5(11): 3194-3204.
- Bailey CJ, Turner RC (1996) Metformin. N Engl J Med 334(9): 574-579.
- Yu G, Wang J, Chen Y, Wang X, Pan J, et al. (2009) Overexpression of phosphorylated mammalian target of rapamycin predicts lymph node metastasis and prognosis of chinese patients with gastric cancer. Clin Cancer Res 15(5): 1821-1829.
- Pagès G, Pouysségur J (2005) Transcriptional regulation of the Vascular Endothelial Growth Factor gene-a concert of activating factors. Cardiovasc Res 65(3): 564-573.
- Lin C, McGough R, Aswad B, Block JA, Terek R (2004) Hypoxia induces HIF-1α and VEGF expression in chondrosarcoma cells and chondrocytes. J Orthop Res [Internet] 22(6): 1175-1181.
- Deacon K, Onion D, Kumari R, Watson SA, Knox AJ (2012) Elevated SP-1 Transcription Factor Expression and Activity Drives Basal and Hypoxiainduced Vascular Endothelial Growth Factor (VEGF) Expression in Non- Small Cell Lung Cancer. J Biol Chem 287(47): 39967-39981.
- Atkins GB, Jain MK (2007) Role of Krüppel-Like Transcription Factors in Endothelial Biology. Circ Res 100(12): 1686 LP-1695.
- McConnell BB, Yang VW (2010) Mammalian Krüppel-Like Factors in Health and Diseases. Physiol Rev 90(4): 1337-1381.
- Schuetz A, Nana D, Rose C, Zocher G, Milanovic M, Koenigsmann J, et al. (2011) The structure of the Klf4 DNA-binding domain links to selfrenewal and macrophage differentiation. Cell Mol Life Sci 68(18): 3121- 3131.
- Shields JM, Christy RJ, Yang VW (1996) Identification and Characterization of a Gene Encoding a Gut-enriched Krüppel-like Factor Expressed during Growth Arrest. J Biol Chem 271(33): 20009-20017.
- Atkins GB, Jain MK (2007) Role of Krüppel-Like Transcription Factors in Endothelial Biology. Circ Res 100(12): 1686 LP-1695.
- Tiwari N, Meyer Schaller N, Arnold P, Antoniadis H, Pachkov M, et al. (2013) Klf4 Is a Transcriptional Regulator of Genes Critical for EMT, Including Jnk1. PLoS One 8(2): 57329.
- Ray BK, Murphy R, Ray P, Ray A (2002) a Splice Variant of SAF-1, Acts as a Negative Regulator of Transcription.J Biol Chem 48(46): 822-830

Top Editors
-

Mark E Smith
Bio chemistry
University of Texas Medical Branch, USA -

Lawrence A Presley
Department of Criminal Justice
Liberty University, USA -

Thomas W Miller
Department of Psychiatry
University of Kentucky, USA -

Gjumrakch Aliev
Department of Medicine
Gally International Biomedical Research & Consulting LLC, USA -

Christopher Bryant
Department of Urbanisation and Agricultural
Montreal university, USA -

Robert William Frare
Oral & Maxillofacial Pathology
New York University, USA -

Rudolph Modesto Navari
Gastroenterology and Hepatology
University of Alabama, UK -

Andrew Hague
Department of Medicine
Universities of Bradford, UK -

George Gregory Buttigieg
Maltese College of Obstetrics and Gynaecology, Europe -

Chen-Hsiung Yeh
Oncology
Circulogene Theranostics, England -
.png)
Emilio Bucio-Carrillo
Radiation Chemistry
National University of Mexico, USA -
.jpg)
Casey J Grenier
Analytical Chemistry
Wentworth Institute of Technology, USA -
Hany Atalah
Minimally Invasive Surgery
Mercer University school of Medicine, USA -

Abu-Hussein Muhamad
Pediatric Dentistry
University of Athens , Greece

The annual scholar awards from Lupine Publishers honor a selected number Read More...


