


Lupine Publishers Group
Lupine Publishers
Case ReportOpen Access 
Leveraging Distributed Energy Resources by Means of Energy Integration and Power Sharing: The Answer to Soaring Energy Bills Volume 2 - Issue 1
Received: September 16, 2022 Published: September 22, 2022
Corresponding author: Fernando Yanine, College of Engineering, Universidad Finis Terrae, Santiago 7500000, Chile
DOI: 10.32474/JBRS.2022.02.000129
Abstract
Soaring electricity bills and looming energy shortage are the latest inflation red lights. Leveraging Distributed Energy Resources (DER) by means of solar, energy storage, flexible loads plus energy integration and power sharing might be one of the answers to the current crisis from the electric power distribution side. This is not only important and sensible, but also urgent, especially in today’s world where electric tariffs are increasing as never before, and climate change perils are being felt everywhere. The plague of highcost energy bills and heating-ventilation and air conditioning rationing due to energy supply shortage, especially in Europe, has made the case for renewables and flexible consumption all the more relevant. Sustainable Hybrid Energy Systems (SHES) are key to furthering DER’s flexibility and can also be affordable if implemented by electric utilities for both rural and urban communities. DER may be implemented through power integration and sharing strategies supported by energy homeostasis control and energy management systems to reduce to a great extent the high cost of new installations to augment power capacity in new areas, but it can also further resilience and flexibility without compromising system’s stability, as some people erroneously argue. A new approach for developing grid-connected DER is presented. Consumer behavior becomes a key factor in this new scenario were DER, along with smart grid technology, will be the norm. Moreover, with the advancement of DER and the smart grid agenda, SHES will become widespread so as to maximize electric services and power supply availability at reduced prices while supporting the electric utilities’ goal of increased efficiency, resiliency and flexibility. This requires new and more modern legislation to allow more competitive players in the electric power distribution sector to ensure competitive pricing, reliable services while at the same time, ensuring the system’s overall sustainability.
Keywords: Electric tariffs; distributed energy resources; electric integration & planning; electric utility; energy homeostasis
Figure 1:

Introduction
The high cost of energy with soaring energy prices and energy shortage looming ahead are the scourge of the modern world threatening both the industrial sustainability and the living conditions of nations around the world. This plague is affecting both residential and industrial sectors worldwide and to make matters worse, the International Energy Agency (IEA) has estimated that global energy demand will grow by more than 25% towards 2040[1]. Thus, developing nations like Chile are moving steadfastly towards integrating more DER and planning transmission and distribution to leverage the country’s wealth of renewable energy, especially solar, to advance green energy consumption. Distributed Generation (DG) is defined as “an electric power source connected directly to the distribution network or on the consumer side of the meter” [2]. Albeit important and desirable in and of itself, in terms of expanding green, flexible energy consumption in large scale, the high cost of introducing additional capacity through new investments in power distribution infrastructure is also a deterrent for new projects [3]. Here is where the benefits of DER’s implementation for residential and industrial sectors by means of energy integration and power sharing management can make a big difference for consumers as well as for electric utilities [4,5]. Thus, to improve DER generation, two strategies are proposed to harness and maximize available resources. Specially designed microgrids leveraging DER, owned and operated by electric utilities [5]and independent, small-scale systems that can be integrated into urban or rural environments which can autonomously generate and store energy and be connected to the smart grid. However, the regulatory aspects have not been adequately and thoroughly addressed in many places still, something which hinders the advancement of DER implementation [6].
Some authors have suggested establishing Demand Side Management (DSM) systems together with dynamic pricing [7] as part of the solution. Other researchers have done extensive research on the subject, advocating for different schemes of energy consumption and energy sharing, made possible by novel energy management and power control systems based on energy homeostasis [8-10]. Both energy homeostasis management, along with energy integration and power sharing are key elements of this proposal and are essential to incentivize the production of renewable energy at different scales, coupled with the grid supply employing electric tariffs can enhance the adoption of DER and entice independent producers with micro and small projects, provided that there are appropriate economic incentives [8-10].
On the one hand, electric utilities are to clearly identify and characterize electric consumption profiles amongst their residential and industrial customers, so as to be able to distinguish those customers whose profiles are more intensive in power consumption than other customers, during specific daily hourly blocks, as well as their electricity consumption behavior during specific times of the year. This way, electric utilities are able to differentiate high power consumption customers, who are less flexible-whether residential or commercial/industrial-from those who are less intensive, and more flexible in their electricity consumption and exhibit a thriftier profile when it comes to power consumption [11-13]. In this regard, dynamic energy management and time-varying electricity pricing are key elements of DER deployment if those in charge of the project are to entice the target market allowing potential customers to draw the necessary incentives when considering green energy projects for residential customers [14]. For example, ENEL Distribucion S.A. in Santiago has a particular customer policy with a Demand Management Program (DMP) which is a service offered to commercial/industrial customers by the company that allows companies to manage their maximum demands during peak hours during the winter period (April to September), thus being able to disconnect from the electricity grid at the appropriate times and thus reduce their energy bill. This program is offered to companies with electricity tariffs BT4.3 and AT4.3 with high consumption due to their energy demand during rush hour periods. these companies can be disconnected from the network at peak times, or they have backup equipment to continue their operations, which is the case in most cases [15]. Those who maintain a more stable, thrifty and regular energy consumption - especially during peak hours of the day- and are also more flexible during some periods of the year when extreme demand for electricity occurs (i.e., periods of very hot weather or times when very cold weather that have an impact on electric cooling and heating demand, respectively) are rewarded by having access to lower electric tariffs [15].
1.1. Electric Tariffs, Electricity Consumption Profiles and Flexibility as Drivers of DER
It is important to state here that, in order for this to work whenever employing DER, for example a small photovoltaic plant with a set of batteries and a couple of alternators for fast electric dispatch installed in an industrial company that requires large power consumption during 12-hour shifts or a grid-tied small microgrid, installed in a large residential or commercial building, the changes in power versus energy consumption are to be continuously monitored and recorded by the power control and energy management system of the microgrid, and by the electric utility that operate them if that is the case. Such an arrangement must be tailored to fit the operations management models of the electric utility and abide by the regulations that exist in each country [13,14].
Taking the case of Chile as an example, in accordance with the provisions of the Electricity Law in force in Chile, the distribution tariffs for final customers are set every four years by the Ministry of Economy. This determination is made based on studies commissioned from expert consultants, both by companies and by the National Energy Commission (abbreviated CNE in Spanish), which is the regulatory body for the Chilean energy sector (https://www.cne.cl/tarificacion/electrica/valor-agregadode- distribucion/opciones-tarifarias-a-usuarios-finales/).The rate formulas are established through a Decree of the Ministry of Economy, which includes the various types of regulated rates to which customers can freely choose, depending on their monthly electricity consumption levels. In the Electricity Law in force in Chile there is Tariff BT1 which is the simplest rate. It only measures the energy consumed by the customer and there is no direct charge for the power demanded. You can opt for this rate if you have a low voltage supply and a connected power supply from the utility grid of less than 10 kW. This rate is the one chosen by the great majority of the electric utilities’ residential customers. In tariffs BT2 and AT2 charges for energy and power are separated. The energy is measured with a simple energy meter and the power is contracted by each client according to the client’s needs. It is controlled by a power limiter. The difference between the BT and AT rates is the supply voltage, the first corresponding to Low Voltage (up to 400 volts) and the second to High Voltage (Over 400 volts).
There are also several charges that comprise each fee from BT2 and AT2 onward. In tariffs BT3 and AT3, the charges for energy and power are also separated, as in BT2 and AT2. Both the energy and the demanded power are measured through a meter with a maximum demand recorder. The difference between the BT and AT rates is again in the voltage supply, the first corresponding to Low Voltage (up to 400 volts) and the second to High Voltage (Over 400 volts). The fee is also made of several charges. Finally, in tariffs BT4 and AT4 this rate separates the charges for energy and power supplied (maximum demand for the month) and power at peak hours. Please refer to Table 1 below. As the table above shows, there are three possible alternatives for clients. The difference between the BT and AT rates is in the voltage supply. The AT4.3 and BT4.3 tariffs are usually used by customers who have the possibility of reducing their demanded power during peak hours, hence are more flexible.
Table 1: Electricity Tariffs in Chilean Electricity Law and their Characteristics.

Likewise, as one can see with any electricity tariff system, and particularly in the case there are DER involved, there is the need to establish limits in energy and power consumption of the distributed energy systems being deployed and such limits must be clearly set within specific hours of the day, so as to condition electric consumption behavior on the part of customers. This is necessary to ensure supply availability by the system, especially when discussing green energy projects. Stanton (2015) in his “Distributed Energy Resources: Status Report on Evaluating Proposals and Practices for Electric Utility Rate Design” [16] gives a thorough account of the progress of these ongoing changes in the electricity distribution markets. He argues that some rate design proposals and recent actions are solely focused on solar PV generation and net energy metering (NEM) policies, suggesting that there is the need for exploring a wider, more diverse spectrum of both: different energy sources in conjunction with the grid supply and differentiated tariff options as well. In fact, it is particularly in differentiated tariff options scenarios where the opportunity lies, since solar energy coupled with storage are the only viable alternative, based on current costs figures, for worldwide implementation of micro, small and medium size DER systems that can be easily connected to the grid and operate in conjunction with it. This is because there is a wide spectrum of alternatives given the great diversity of energy consumption patterns that exist―even within clients’ profiles―in society, both in the residential and industrial/commercial sectors [16].
Bustos et al. (2019) [17] have correctly pointed out that sharp cost reductions of distributed energy resources (DER) will probably drive their deployment without the need for economic incentives― especially when using photovoltaic energy, which has become significantly affordable from its early days. Other authors argue that Dynamic Grid Parity Models (DGPM) combine learning curves with grid-parity, and state that DGPM are useful to assess the timeevolving competitiveness of generation technologies but fail to capture the residential end user’s choices and cost-benefit analysis that DER generation can yield, once they become feasible [18,19]. Hence, they propose as a particular case used as an example, a robust framework based on a local, optimally designed microgrid, combined with learning curves to assess the potential penetration of distributed energy resources in households [18]. Mont (2004) proposed an institutionalization of sustainable consumption patterns based on shared use of electricity [20] which makes much sense when discussing green energy projects with the deployment of DER connected to the grid.
Likewise, several other authors [21-27] have also done extensive research on the subject of learning curve analysis of solar photovoltaic systems as the chief DER implementation technology being incorporated as an on-grid renewable energy supply for the electric power distribution markets, particularly in the residential sector; as well as research on solar photovoltaic grid parity, addressing the various issues and challenges present today, as well as the status of the different PV markets. Grid parity for photovoltaic (PV) technology is defined as that point where the cost of PV-generated electricity equals the cost of electricity purchased from the grid, clearly a desired milestone. Achieving grid parity is a function of many variables, including the solar resource, which in Chile is phenomenal, along with local electricity prices, and other incentives. The dynamic grid-parity model [18-19], for example, enables to estimate where and when sustainable market segments are to be created by implementing PV electricity generation. Indeed, grid-parity is a very important milestone for further photovoltaic (PV) expansion.
To better understand this, one must learn that grid-parity models are based on Levelized Cost of Electricity (LCOE), coupled with the experience curve approach. The levelized cost of electricity measures the average net present cost of electricity generation for a generator over its lifetime. It is widely used for investment planning of power generation plants/units whatever their size and to compare different methods of electricity generation― renewables versus fossil fuels for example―on a consistent basis. LCOE also refers to the estimated revenue required to build and operate a generator over a specified cost recovery period [23]. Moreover, several assumptions are made regarding the drivers of dynamic grid-parity model such as the experience curve approach, PV industry growth, and PV system cost are all taken into account. The progress of the dynamic grid-parity model is measured by the learning curve or learning rate (LR) [18,19].
Likewise, variations in demand for electricity due to unforeseen circumstances can be counteracted by innovative tariff structured algorithms such as Multi-Time-Of-Use (Multi-TOU) and Multi- Critical-Peak-Pricing (Multi-CPP) [7,28]. Thus, for example, a community-based, multi-party microgrid, involving critical loads and generators of multiple owners becomes part of the business model [29].
In the proposed case study using energy homeostasis technology, the frequency footprint is a key part of the energy homeostasis model. As we all know, power is the rate at which electrical energy is being produced and/or consumed and it is measured in kilowatts (kW) or simply watts. Thus, an energy system that is supplying a certain amount of electric power to a particular load or a set of loads in a given community of residentsall of whom may quite well exhibit very different consumption patterns -has a distinct frequency in Hertz, which in fact acts as a frequency footprint of the power consumption being registered by the energy system. Electricity consumers, on the other hand, usually pay for their electrical energy consumption based on the amount of kilowatt hours (kWh) consumed -this is the equivalent to 1 kW of power expended over 1 hour of time. The reason for wanting to limit the rate at which energy is consumed may vary from time to time, based on the particular circumstances and/or contingencies like seasonality and harsh weather patterns. As an example, let’s take the case being addressed here, where an electric power distribution grid managed and operated by the local electric utility company has decided, in accordance with and under the prevision of current and future changes in the law that regulates the electric distribution industry, to set up a microgrid in a 10-storie building. This may come as a response to new legislation designed to further and incentivize the adoption of renewables and DER in both residential and commercial/industrial sectors. This particular microgrid operates grid-tied and has renewable (solar) and nonrenewable energy sources (typically a gas-operated microturbine and/or a diesel generator, which by law, exist in every midsize building in Chile) and a set of lithium-ion batteries for energy storage.
In the case of grid-connected or grid-tied DER system, operating in parallel with the grid, if the DER’s output power (the microgrid) increases, according to the load in the terminal of the connection point to the grid, then the frequency of the grid tends to increase. This effect can be detected with the inverter, whose control system keeps track of the frequency and the phase of the grid voltage. In the model being studied here, a hybrid tariff scheme is being proposed as a means to incentivize the microgrid’s green power consumption and, at the same time, to condition the electric power consumption of the community, in order to achieve a green energy profile consumption. Thus, the DER system computes its energy consumption charges for each customer using an hourly rate based on time-of-use (TOU) and an electric tariff based on the imbalance between electric power generation and consumption so as to incentivize collaboration in the community to maintain the power consumption within ranges that guarantee a reasonable price and consumption level for the overall community. There may also be power consumption limiting devices to ensure compliance with system capacity limitations or because of economic reasons that the community may choose to adopt. In fact, this is the essence of power management’s goal -to modify the community’s energy demand in a way that supports a particular purpose and guarantees a specific outcome. Below in Figure 1, a hybrid tariff scheme has been proposed. Simulation shows that for residential customers, the hybrid electric rate, devised to advance and promote green energy generation and consumption, is cheaper than the hourly or flat rate that is actually in effect today in Santiago, Chile. This encourages the behavior of customers to be aligned with the optimal functioning of the power system. As part of the control system, there is an energy homeostasis algorithm designed and simulated using MATLAB. The main aim of this research case which was presented to the local electric company for its potential adoption in future time, is to advance the development of a microgrid prototype, especially designed for residential buildings in Santiago, Chile. Santiago, being a very large metropolitan area, has hundreds of buildings in all parts of the city and its densification is ongoing. Under this scenario and using real customers’ demand data from the local electric company for simulation purposes, customers have the option to choose among the different tariff plans provided that they meet their respective requirements [8]. Customers with smart metering who are connected to the DER have the option of evaluating these different rates as a single customer, being able to access electricity supply with a substantial percentage of green energy from the microgrid (DER) at more convenient rates especially designed for them as a single package rather than as a single independent customer, as the traditional model stipulates. The DER’s energy integration and power sharing management are carried out by a supervisory control system based on energy homeostasis [11] operating efficiently and attaining a real Sustainable Hybrid Energy Systems (SHES) performance [8-13]. The analysis of the most convenient tariffs and cost sharing options among the customers of a 10-storie apartment building is performed in this study, which is organized as follows. Section II presents the case study and the parties involved with the green energy incorporation scenario. In Section III the case of clustered clients is analyzed following two possible criteria for sharing renewable production: equal sharing and merit-based sharing, which requires that customers commit to thriftiness in energy consumption. Section IV present the case of separate customers and its implications. Simulation results are presented in Section V. Concluding remarks come afterwards.
Figure 2: Microgrid connected to the electric power distribution grid with smart sensors to measure loads. Customers have a smart meter and the microgrid is registering his/her frequency footprint continuously.

Case Study
The study consists of 60 apartments which, along with the microgrid, comprise a sustainable block™ (SB) to be remotely managed by the electric company through its control network. This community is connected to the electrical grid installed and managed by the same electric company. The microgrid is especially designed to meet the needs of the community wherein a significant percentage of its total electricity consumption needs come from renewable energy. As a whole, the DER will make possible to attain the optimal rate that it is possible for the electric company to provide to its customers, subject to the energy system’s conditions and constraints. The arrangement is to provide economic benefits (incentives) for the residential customers of the sustainable block™ in exchange for maintaining an efficient, sustainable electricity consumption profile that ensures adequate levels of green power for the overall community provided that they abide by energy integration and power sharing rules that they willingly accept as part of the contract signed with the electric company. Besides the photovoltaic panels, the inverter and the diesel generator set or instead, a micro gas microturbine which is an extremely quiet, efficient and environmentally friendly device, the DER also comprises a Lithium-ion rechargeable battery bank with liquid thermal control that can achieve 4000-5000 cycles at 100% DOD. In order to define the appropriate size, simulations are performed using 0 to 150 kWh. In the case studied here, the selected panel type is a commercial one whose characteristics in standard test conditions (STC) (i.e., irradiance of 1000W/m2, spectral value of 1.5 AM and temperature of 25°C) are presented in Table 2. The resulting installed power capacity of the DER plant is 41.58 kW.
Table 2: PV Panels’ Characteristics.

Whenever deploying DER systems, energy storage or backup system is highly desirable and necessary when the local distribution grid is not reliable or goes out of operation due to a fault. However, in urban areas such as Santiago, where the grid supply is very reliable and there are no issues with power quality or with voltage drops, it is not necessary to have backup systems. It is enough just having the DER system operate on-grid (grid-tied) and you always have the main grid as back up. Also important, when designing a microgrid, is to account for variables such as energy efficiency, duration, power density and energy density all of which are essential parameters to consider, since they may affect the overall storage cost. In Table 3 below there are some technical characteristics of the two prevalent technologies for batteries. As it is observed, Lithium battery density is much higher than the Acid-Pb battery, it also has a voltage per cell of 3.7 V, which decreases the number of cells in series to reach a certain voltage level. In this study, the technical characteristics provided by the commercial Tesla Powerwall battery [30] will be adopted for simulation.
Table 3: Comparison Table Between Batteries.

Below are the expressions (1) and (2) for the energy equilibrium of the grid-tied microgrid, which represents the energy homeostasis concept, which is given in terms of the total power supply and the energy homeostasis regulation mechanisms discussed in [25].
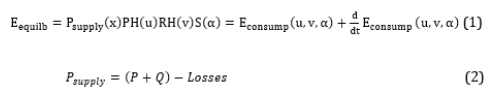
Where x represents the internal state of the energy systems at time and energy equilibrium is dependent upon specific factors that are indicated next, operating adequately in the DER. PH stands for Predictive Homeostasis function while RH stands for Reactive Homeostasis function [25]. Both u and v represent the specific predictive and reactive homeostasis variables respectively, which are designed as part of the energy homeostasis model. In this case, predictive variable u is represented by the PV generated energy and the v variable is represented by the energy measured in the system. These parameters are designed based on extensive data modeling to incorporate as much accuracy in the system’s response as possible [25]. Both of these functions have a distinct power quality footprint being exhibited by the system. Hence, the model presented here has been designed and developed based on energy homeostasis principles [25]and engineered in the form of what has been described and conceptualized as energy homeostaticity in the literature [8-9]. It basically incorporates artificial intelligence and especially designed, community-specific intelligent control algorithms supported by smart sensors and monitoring gear which are built to encompass the energy homeostasis system [8-10]. Thus, the DER’s operation is always prepared for both, normal and adverse system conditions, and it is prepared to handle environmental challenges being sensed by the energy system and represented by the awareness and criticality variable α. These three variables (u, v and α) represent key constitutive elements of the intelligent algorithms built in the DER system and, as such, are the equivalent of metabolic variables in living organisms like, for example, the cardiovascular and endocrine systems’ variables that affect the energy expenditure and storage of such systems [25].
Above Figure 2 shows a general structure of the control system, where the Energy Management System (EMS) and the Power Management System (PMS) reside, and which are designed following energy homeostasis strategies. The EMS/PMS module receives as input the electric power generation predictions, based on predictive homeostasis (PH) data carried out by the HC system’s assessment of internal and external variables [23]. This is done taking into account the photovoltaic generation plant and the electricity consumption ranges in terms of demand side projection in order to decide on the magnitude and the energy flow. In addition, the storage status of the batteries must be monitored. Thus, and pursuant to the objective of minimizing operating costs (i.e., minimizing the money paid monthly for energy by consumers), the energy homeostasis controller will have the following attributions:
Figure 3: Supervisory control scheme for the sustainable block™ with energy management and power management systems.

A. Battery management
Defines when and how much energy the battery is to charge/ discharge. The control system will charge the set of batteries when the demand is low and will draw energy form the batteries when the tariff of electricity is more expensive, depending on the electric tariff that is being implemented.
B. Active control of the energy demand
It is determined by how much energy is consumed by each customer of the microgrid as recorded by the smart meters. The aim here is very distinct: to maximize the use of green energy with the microgrid’s available generation and supply capacity. Those customers who do not exhibit a power consumption behavior in accordance with the contract signed with the electric company or simply choose not to align with the needs of the rest of the community, will be notified straightforwardly through an interface and/or an alarm or both and their loads, which exhibit constantly high electric power consumption (e.g. washing machine, charger or heating) will be disconnected by smart switches (Smart plug) from the microgrid’s supply, leaving them with the grid-only option, so as to pay the standard electric tariff set by the electric power distribution grid at that particular time of day.
C. Payment management
This unit is responsible for prorating payments between users and the electric company. Customers who are able to keep low consumption of the microgrid supply (those that exhibit a thrifty consumption behavior), have the right to receive economic compensation (reward) for their rational, community-conscious behavior. Since overconsumption will be penalized, such reward is made possible by those who have a higher consumption of electrical energy, particularly those that use power consumption more often. In this study, only the sharing of power generation and electricity costs will be considered. The investment cost of solar generation system and batteries are neglected since they are incurred by the electric utility and are completely paid off in terms of Return on Investment (ROI) by the savings reaped by the company as a result of operating the green energy system. The electricity tariffs that should be implemented for the community will be BT-4.3 or AT- 4.3, which are the local tariffs applied by the electric company in Santiago, Chile depending on the voltage level utilized. These tariffs are common in the industrial sector, having the lowest price for the electric energy consumed, in addition to a charge for the maximum demand for power in peak hours. For this reason, the control strategy to be implemented should limit demand charges in order to maximize the benefits that can be granted to customers and, at the same time, allow for the grid to operate at a higher efficiency point.
The transaction module (Figure 2) is in charge of assigning the energy quota for each client and calculate the energy flow amongst clients and the grid. In order to accomplish the abovementioned procedure, criteria A and B could be chosen.
D. Criteria A: Customers share the Nth part of generated renewable energy
The diagram in Figure 2 highlights the strategy to be used, where each client owns one Nth part of the renewable energy produced and, for simplicity, all clients’ charges and discharges the battery equally.
The module begins by discriminating between clients with energy excess or deficit, by using condition (3).
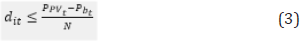
In order to differentiate each client and to successfully stablish an energy management policy between clients, each one will be identified by the index . According to the energy control strategy, each client that satisfies the condition (3) has excess of energy, expressed by (4), and can sell it to clients with energy deficit or to the network, as convenient (Figure 3).
Figure 4: Flow diagram to supply renewable energy under equality criteria.

The sum of all the excess energy, given by (5), corresponds to the total energy available for selling, but a fraction of this energy will feed the requirements of the customers with deficit and the rest will be injected into the network . The energy contribution of each client will be identified defining a factor according to (6).

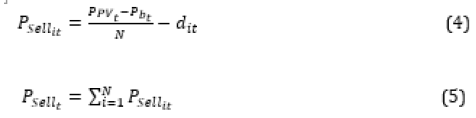
Then the energy supplied to the customers with energy deficit and the energy injected into the grid by the customers with excess energy will be given by (8) and (9), respectively.

If condition (3) is not met, that means that there are one or more customers with an energy deficit. Hence, these customers must use energy from the grid and/or from the surplus of other customers with renewable energy . The procedure that describes the energy flow under this condition is depicted in the flow diagram of Figure 4 to supply renewable energy under equality criteria included.
E. Criterion B: Substantial renewable energy supply according to customer merit
The flow diagram of Figure 4 shows the control strategy of the power supply from the microgrid. Following this strategy, customers will get renewable energy as a reward by having an efficient and low consumption that enables to bound the maximum demand.
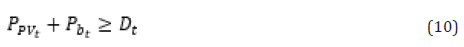
The algorithm begins by checking if there is enough power from the microgrid to satisfy the demand of the sustainable block™ or SB by applying condition (10). If (10) is satisfied, all customers will get energy from the microgrid, achieving 100% of their energy consumption. The excess energy is injected into the main grid and clients will receive an equal income for that contribution.
Figure 5: Flow diagram depicting algorithm to control renewable energy supply to customers based on merit.

If condition (10) is not met however, it is understood that the energy available in the microgrid is not enough to satisfy the demand. Therefore, this energy must be administered and delivered according to the rules set by the strategy in operation and assigned as a reward to those customers that have had a low consumption during peak hours, exercising thriftiness. The module algorithm designed for peak hours is in charge of organizing the customers according to their energy consumption from lowest to highest. The first customers will have the right to receive energy from the microgrid in proportion to their consumption, as indicated in (11).

Where Sum corresponds to the sum of the consumptions of the first m customers. On the other hand, the remaining N-m customers must satisfy 100% of their energy consumption from the utility. Customers who are allowed to receive energy from the microgrid at peak hours will increase an index called, “Homeostatic Index (f_ HC)” [9,12,25]. This index will be used to distribute the renewable energy in non-peak hours of the next day. In addition, customers will be ranked from higher to lower according to the mentioned index, so the first m clients with higher f_HC will obtain energy from the microgrid.
Due to the high cost of the peak hour demand, the control system must encourage customers to consume during off-peak hours. To meet this goal, the cost of the electricity supply is transferred to consumers through an internal tariff, which differentiates between low and high demand. Figures 4 & 5 illustrate the applied internal tariff. This will be based on the monomic energy price which consists of a single equivalent price per kWh that considers both, the energy and the power charge.
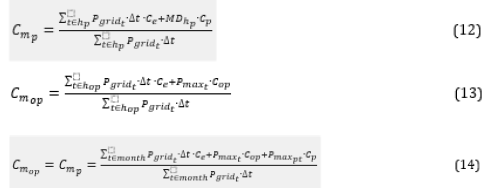
Equations (12) and (13) correspond to the monomic price that should be used at peak hours and off-peak hours, respectively. The monomic price for peak hours () is calculated monthly on the basis of energy consumed in peak hour and take into account the maximum registered power demand in peak hours. On the other hand, the other monomic price for low demand () is calculated in a similar way yet considering off peak hours. All monomic prices are calculated monthly together with the billing cycle. During the months which do not contain peak hours (October to March), the monomic peak and non-peak costs are the same and the calculation is done according to equation (14). After one year of evaluation (), the monthly and annual costs are calculated for each customer and for the SB as a whole, according to equations (15) to (19).
Figure 6: Internal tariff for Sustainable Block™ customers.

Please note that denotes winter month (from April to September) and denotes summer month, (from October to March). Hence, the costs are calculated for each season separately as shown in (15) and (16).
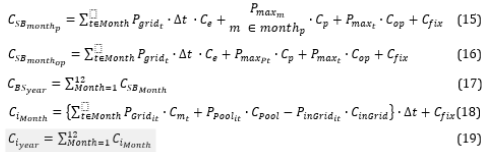
Where the values of is in the order of $ 0.1 US dollars, yet it depends on the tariff ( is in the same order), and the price of the energy from the grid can get up to $ 0.15 US dollars. The algorithm is repeated up to 20 years (PV lifetime), each year a loss of efficiency in the photovoltaic panels of 0.6% is added and a linear reduction of battery capacity is also considered, so that the final battery capacity is 80%. Furthermore, the depth of discharge of the battery is adjusted so that no intermediate replacements occur.
Separate Customers
Customers are free to choose between different electric rates in the corresponding voltage level. Among the rates offered by the local electricity company, described in a previous section, only BT-1 tariffs and a Flexible Electric Tariff (THR) are competitive for consumption levels and profile characteristics of individual customers. In this scenario the option of incorporating a photovoltaic plant in the common roof of the building plus having an energy storage system are evaluated. Since the energy meter of every customer is operated by the electric utility, the only option is to deliver the renewable energy to the common services of the building or else, to the main grid. As illustrated in Figure 6 below, the customer’s smart meter will effectively record the home’s electricity consumption and by means of an internal mechanism installed in the smart meter itself, it will be able to discriminate if it is supplied by the main grid/ network or by the microgrid, so that the electric company can bill the customers of the building accordingly.
Figure 7: Energy flux and metering for separate customers.

Therefore, in agreement with current regulations specified by the electric utility (the local electric company) and the Chilean Superintendence of Electricity and Fuels, the convenient strategy is to inject renewable energy into the common services (services used by all the inhabitants of the building, e.g., elevators, water pumps, hallways lighting, etc.) of the building and then whatever is in excess of what’s needed can be injected into the main grid/ network. The most common tariff used is BT-3 and in addition, for the sake of simplicity, it is assumed that all of the renewable energy is self-consumed. Hence the project income should be calculated as the savings on the electricity used in common services’ bill which is paid by all the inhabitants of the building on a monthly basis.
Simulation
F. The System’s Model
The analysis focuses on modeling and simulating a distributed generation (DG) solution based on DER for use in the residential sector, which offers efficient management of energy supply and consumption, from a technical-economic point of view. The DER system will be designed to handle or efficiently manage the energy in a residential building of average dimensions located in Santiago, Chile (i.e., 10 floors and 60 apartments building), with photovoltaic generation, storage capacity plus an intelligent energy and power management system based on energy homeostasis. The building community comprises 60 apartments of different sizes and different energy demands, which we call a sustainable block™ or SB.
G. Simulation Results
In this section results obtained by system simulations are presented and analyzed. These results validate the energy homeostasis model’s strategy used to manage the energy of the customers in the building, taking into consideration the benefits that they would obtain under different alternatives.
A common practice to reduce the maximum demand during peak hours, is to charge the batteries from the main grid during low demand hours (valley hourly block) when the electric tariff is lower, and also taking into account weather forecasts and the application of algorithms to predict the photovoltaic generation. The aim behind this is to get into peak hours with the batteries fully charged. This way, the benefits of the electric tariff to be used (BT- 4.3 or AT-4.3) are maximized. As an example, Figure 7 depicts the power flows among the different elements for one day considering the existence of a battery and applying hourly tariff.
Figure 8: SB Power flow with battery and hourly tariff.

Whether the microgrid has or does not have a storage device, in practice, the control system shall be provided with a set of controllable loads which can be remotely disconnected, so that the maximum demand can be maintained bellow a specified consumption limit. In addition, customers will be notified automatically that their behavior is not being solidary and aligned with the needs of the community, and as a result, they will be penalized as explained earlier, with disconnection from the microgrid and subjected to the higher electric tariff. Thus, in this example the microgrid not only is an engineering system but can also be understood as a socio-technical complex system that is governed by certain rules and regulations, just like every ordinary community is. In this regard, the energy users play a crucial role as solidary members of the same community and as such, are expected to behave as active loads, meaning that they are able to adjust their power consumption and move their power demand to off-peak hours.
Internal electric tariff for microgrid customers is shown in Figure 8. As it is described in Figure 7, the battery is used to supply for the excess energy consumption that the microgrid cannot supply during peak hours. Internal electric tariff for microgrid customers is shown in Figure 8. This tariff, based on the monomic energy cost, is employed with the aim to achieve an efficient energy consumption and to transfer the gain in energy cost derived from the improved efficiency to the customers. Thus, it can be observed that the energy cost at peak hours is considerably higher than that of nonpeak hours, so customers are induced to adopt a more efficient and productive consumption behavior in terms of the entire grid-DERSB system as a whole: that is the on-grid microgrid, the distribution grid and the community of residents in the building, which we have termed a sustainable block™. Thus, they are expected to be flexible, to align with a community conscious profile and to move part of their power consumption to low demand hours, where the energy cost is lower and in doing so, they will be maximizing the use of the green energy from the microgrid with energy storage included more productively, to its fullest capacity, making the entire system more efficient and productive in terms of consumption versus cost. If, however, there is a shortage of supply from the microgrid for whatever reason, the grid supply will automatically take over as explained, and will supply for the deficit. For non-peak months (January, February, March, October, November and December), there is a flat tariff, where the price for energy is equal no matter the time it is consumed.
Figure 9: Energy monomic cost in both scenarios: off-peak hours and peak hours’ consumption.

Figures 9 & 10 represent the two different criteria for allocating renewable energy, it is shown that the saving is US$178.36 for every customer. The total amount saved for all the 60 apartments is about US$1,0701.87. The distribution of this amount among the customers depends on the criterion (both are different due to their own rules). Figure 8, defined as criterion A, responds to a logic in which customers own the N-th share of renewable energy available, indifferent to their consumption patterns, and are being able to sell their energy surplus to other customers and to the network if they so choose.
Figure 10: Annual energy cost per customer under criterion A.

Figure 11: Annual energy cost per customer under criterion B.

Figure 9, defined as criterion B, corresponds to the allocation of renewable energy under a scheme based on merit. Customers who have a low consumption during peak hours are entitled to obtain the renewable energy proportionally to their consumption. Choosing between one criterion and another, will depend on the degree of commitment that customers may have and their tendency to save energy in order to use more green energy rather than taking more from the grid. Criterion A makes more sense in case there is a renewable generation and energy storage in accordance with the consumption of the SB. On the other hand, criterion B might be more sensible to use in the case where there is a microgrid with power generation well below the needs of customers as a whole (low generation capacity) so in such case the green energy allocation should be done on basis of merit. Under criterion B, the homeostaticity factor represents a measure of energy efficiency and energy savings, where those customers who accumulate a higher index are the ones who deserve the allocation of more renewable energy [25].
For purpose of this work, this factor was reset daily when simulation was carried out, although in a real implementation it could be reset weekly, monthly and even annually, so that customers who have a sustained efficient consumption can pay off their consumption with renewable energy and be able to keep a low electricity cost. Using the algorithm and combining the renewable energy with storage devices, we were able to estimate savings of up to US $ 12,000 using tariff AT-4.3.
Conclusions
As the results of the simulation show, whether we use criterion A or criterion B, more than 40% reduction in annual electricity cost can be achieved for the community of this study, namely the residents of 60-apartment building, while consuming mostly green energy from DER like the microgrid being proposed to illustrate this case study. Judging by the results obtained by the described techniques for DER deployment considering renewable energy integration and power sharing, it is easy to project (within a certain average range of consumption) how every customer will receive his/her share of the green energy supply, thus avoiding discordances and problems amongst them. Moreover, while the case of separate (also called non-clustered) customers is considered here, there is nonetheless the possibility that customers may keep their own personal billing separately if they so desire. For this non-clustered case, the generated green energy will be used for the common services of the building or directly injected into the grid when green energy supply is greater than what is needed to satisfy common services consumption of the building. As seen per the results obtained by employing these criteria illustrated in the case study, some problems that may arise regarding renewable resources sharing can be solved, encouraging customers to install these systems on their blocks, most of which are residential buildings nowadays, in large cities like Santiago, Chile. Finally, it is important to realize the fragility of today’s electric power distribution infrastructure, with the perils of climate change, particularly in countries like Chile, where seismic activity is both recurrent and menacing. Thus, it is crucial that government authorities, industry regulators and main industry players like electric companies in Chile plan ahead and work on a real green energy roadmap that can truly transform the electric power distribution industry, in order to advance and pave the way for electric utilities to embrace grid integrated distributed generators investments.
References
- World Energy Outlook 2018. International Energy Agency, Paris, France.
- Thornton Alexander, Monroy Carlos Rodríguez (2011) Distributed power generation in the United States. Renew Sustain Energy Rev 15(9): 4809-4817.
- Siano Pierluigi (2014) Demand response and smart grids-A survey. Renew Sustain Energy Rev 30(3): 461-478.
- Jain Sanjay, Kalambe Shilpa, Agnihotri Ganga, Mishra Anuprita (2017) Distributed generation deployment: State-of-the-art of distribution system planning in sustainable era. Renew Sustain Energy Rev 77: 363-385.
- Singh Bindeshwar, Sharma Janmejay (2017) A review on distributed generation planning. Renew Sustain Energy Rev 76: 529-544.
- Wouters Carmen (2014) Towards a regulatory framework for microgrids-The Singapore experience. Sustainable Cities and Society pp: 22-32.
- Hambridge S, Lu N, Huang AQ, Yu RY (2017) A frequency based real-time electricity rate for residential prosumers. IEEE Power & Energy Society General Meeting, Chicago, USA.
- Parejo A, Sanchez-Squella A, Barraza R, Yanine F, Barrueto-Guzman A, et al. (2019) Design and Simulation of an-Energy Homeostaticity System for Electric and Thermal Power Management in a Building with Smart Microgrid. Energies 12(9): 1806.
- Yanine F, Sanchez-Squella A, Barrueto A, Sahoo SK, Parejo A, et al. (2019) Homeostaticity of energy systems: how to engineer grid flexibility and why should electric utilities care. Period Eng Nat Sci 7(1): 474-482.
- Yanine F, Sanchez-Squella A, Parejos A, Barrueto A, Rother H, et al. (2019) Grid-tied distributed generation with energy storage to advance renewables in the residential sector: tariff analysis with energy sharing innovations; Part I. Procedia Comput Sci 162: 111-118.
- Yanine Franco Fernando, Caballero Federico I, Sauma Enzo E, Córdova Felisa M (2017) Homeostatic control, smart metering and efficient energy supply and consumption criteria: A means to building more sustainable hybrid micro-generation systems," Renew Sustain Energy Rev 38: 235-258.
- Yanine F, Caballero F, Sauma E, Córdova FM (2014) Building sustainable energy systems: Homeostatic control of grid-connected microgrids, as a means to reconcile power supply and energy demand response management. Renew Sustain Energy Rev 40: 1168-1191.
- Yanine FF, Córdova FM, Valenzuela L (2015) Sustainable Hybrid Energy Systems: An Energy and Exergy Management Approach with Homeostatic Control of Microgrids. Procedia Comput Sci 55: 642-649.
- Muratori M, Rizzoni G (2016) Residential demand response: Dynamic energy management and time-varying electricity pricing. IEEE Transaction on Power System 31:1108-1117.
- (2022) Servicio a Clientes Enel Distribucion.
- Stanton T (2015) Distributed Energy Resources: Status Report on Evaluating Proposals and Practices for Electric Utility Rate Design. Status Report pp. 15-18.
- Bustos C, Watts D, Olivares D (2019) The evolution over time of Distributed Energy Resource’s penetration: A robust framework to assess the future impact of prosumage under different tariff designs. Applied Energy 256: 113903.
- Breyer Christian, Alexander Gerlach (2013) Global overview on grid‐parity. Progress in photovoltaics Research and Applications 21(1): 121-136.
- Breyer C, A Gerlach, J Mueller, H Behacker, A Milner (2009) Grid-parity analysis for EU and US regions and market segments-Dynamics of grid-parity and dependence on solar irradiance, local electricity prices and PV progress ratio. In 24th European Photovoltaic Solar Energy Conference, Hamburg, Germany pp. 21-25.
- Mont O (2004) Institutionalisation of sustainable consumption patterns based on shared use. Ecological economics 50(1-2): 135-153.
- Kamran Muhammad, Muhammad Rayyan Fazal, Muhammad Mudassar, Shah Rukh Ahmed, Muhammad Adnan, et al. (2019) Solar photovoltaic grid parity: a review of issues, challenges and status of different PV markets. International Journal of Renewable Energy Research 9(1): 244-260.
- Shen Wei, Xi Chen, Jing Qiu, Jennifier A Hayward, Saad Sayeef, et al. (2020) A comprehensive review of variable renewable energy levelized cost of electricity. Renew Sustain Energy Rev 133: 110301.
- Bruck Maira, Peter Sandborn, Navid Goudarzi (2018) A Levelized Cost of Energy (LCOE) model for wind farms that include Power Purchase Agreements (PPAs). Renewable Energy 122: 131-139.
- Jie Li, Yikui Liu, Lei Wu (2018) Optimal Operation for Community-Based Multi-Party Microgrid in Grid-Connected and Islanded Modes. IEEE Transactions on Smart Grid 9(2).
- Yanine Fernando, Antonio Sanchez-Squella, Aldo Barrueto, Joshua Tosso, Felisa M Cordova, et al. (2018) Reviewing homeostasis of sustainable energy systems: How reactive and predictive homeostasis can enable electric utilities to operate distributed generation as part of their power supply services. Renew Sustain Energy Rev 81: 2879-2892.
- Nasirov S, Silva C, Agostini C (2015) Investors’ perspectives on barriers to the deployment of renewable energy sources in Chile. Energies 8(5): 3794-3814.
- Paliwal P, Patidar NP, Nema RK (2014) Planning of grid integrated distributed generators: A review of technology, objectives and techniques. Renew Sustain Energy Rev 40: 557-570.
- Feroze Fozia, Itrat Fatima, Saman Zahoor, Nabeeha Qayyum, Zahoor Ali Khan, et al. (2017) User Satisfaction Based Home Energy Management System for Smart Cities. In International Conference on Innovative Mobile and Internet Services in Ubiquitous Computing pp. 190-199.
- Li Jie, Yikui Liu, Lei Wu (2016) Optimal operation for community-based multi-party microgrid in grid-connected and islanded modes. IEEE Transactions on Smart Grid 9(2): 756-765.
- Li Yaze, Jingxian Wu (2019) Optimum design of battery-assisted photo-voltaic energy system for a commercial application. In 2019 IEEE Power & Energy Society General Meeting pp. 1-5.


-

Mark E Smith
Bio chemistry
University of Texas Medical Branch, USA -

Lawrence A Presley
Department of Criminal Justice
Liberty University, USA -

Thomas W Miller
Department of Psychiatry
University of Kentucky, USA -

Gjumrakch Aliev
Department of Medicine
Gally International Biomedical Research & Consulting LLC, USA -

Christopher Bryant
Department of Urbanisation and Agricultural
Montreal university, USA -

Robert William Frare
Oral & Maxillofacial Pathology
New York University, USA -

Rudolph Modesto Navari
Gastroenterology and Hepatology
University of Alabama, UK -

Andrew Hague
Department of Medicine
Universities of Bradford, UK -

George Gregory Buttigieg
Maltese College of Obstetrics and Gynaecology, Europe -

Chen-Hsiung Yeh
Oncology
Circulogene Theranostics, England -
.png)
Emilio Bucio-Carrillo
Radiation Chemistry
National University of Mexico, USA -
.jpg)
Casey J Grenier
Analytical Chemistry
Wentworth Institute of Technology, USA -

Hany Atalah
Minimally Invasive Surgery
Mercer University school of Medicine, USA -

Abu-Hussein Muhamad
Pediatric Dentistry
University of Athens , Greece
