Lupine Publishers Group
Lupine Publishers
Menu
ISSN: 2690-5752
Review Article(ISSN: 2690-5752) 
Traffic and Pedestrian Safety, Pre and Post Covid-19 Volume 5 - Issue 1
Niccolo Caldararo*
- Department of Anthropology, San Francisco State University, Canada
Received:August 17, 2021 Published: August 31, 2021
Corresponding author:Niccolo Caldararo, Dept of Anthropology, San Francisco State University, 1600 Holloway Ave, San Francisco, Ca. 94132
DOI: 10.32474/JAAS.2021.05.000205
Abstract
The effects of planning initiatives aimed at increasing bicycle use have been little studied in relation to decreased auto use, injuries and pollution. As most programs promote the idea that public investments in bicycle lanes, traffic calming engineering of streets and valuing bicycling as economic and environmentally sound, this article assesses the goals and results. While bicycle use for commuting has decreased in recent years and congestion increased, focus on the effects of engineering streets for calming and bike and pedestrian use were found often to be associated with increased driving times, increased pedestrian and bicyclist injuries and increased pollution. While the economic slowdown due to Covid-19 has reduced traffic, use of existing traffic design has produced intensified conflicts which will be continuing patterns when full economic recovery takes place. The article makes use of data from a number of countries and original fieldwork.
Keywords: Traffic Calming; Bicycle; Commute; Pollution; Pedestrians; Injuries; Deaths
Introduction
The federal government, states and local agencies have investment billions in traffic changes and fees, fines and driving rules that have promoted bicycle use in America. It is appropriate, therefore, to examine the results. What effect has this work and the expenditure of public funds had on driving, pollution and traffic? Some studies have shown varied results with positive outcomes outside of cities, while injuries to pedestrians and bicyclists have varied [1]. During the Covid-19 pandemic many urban environments have seen increased use by bikes, human motive machines like wheelchairs, skateboards and mobile single passenger units like motorized skateboards and pedestrians. This increased use has brought new focus to the design of multiple use arteries both shared with motor vehicles and not. Social distancing requirements have complicated use and made for problems in local authority governance [2,3]. With only limited data available, we find driving down considerably in 2020, but fatalities have increased dramatically as have injuries to bicycle users, while pedestrian injuries are down [4]. While in the first half of 2020 fatalities were up per 100,000 from 1.06 to 1.25 [5]. One tentative explanation is that with less traffic drivers and bike users are ignoring street signage and driving faster. However, when things return to pre-COVID-19 conditions, current designs and street concept ideologies will have to be reconsidered. A more comprehensive and comparative analysis follows.
Commuting and Bike Use
In a recent article in the [6] breaks down data on biking promoted by such advocacy groups as the League of American Bicyclists. This group uses data provided from the U.S. Census Bureau’s American Community Survey. Answers to questions on biking do not differentiate between a respondents use of a bike X number of times a week or if that trip was for seasonal use or each workday or only one or two days or mixed, that is, if for work one day or partial was it the only a leg of a commute or only a part of the commute (i.e., home to train or bus). There is a great variation in bike use in cities, from just under 12% in some of the smaller cities to just over 3% in mostly larger ones. Weather and investments in bike friendly infrastructure are the explanations given by the League spokesmen in the article.
The Census data, therefore, tell us that commuters cycling to work dipped in 2017 by 4.7% from 2016. Less than 1% of all workers used bikes but 84% of the largest U.S. cities reported some increase in bike to work use. So one might ask, is this a cost effective result of billions of dollars invested? That is, is the expenditure associated with community goals, e.g., to reduce pollution or is it simply to support a lifestyle choice or recreational preference [7]. Bicycle advocacy groups often argue that their efforts have community goals [8]. In 2004 the Brookings Institute reported that traffic was getting worse [9]. All efforts to reduce traffic seemed to\ fail. The most obvious, increase in gas price, also seemed to be of little effect. CityLab published a study in 2018 [10] showing that traffic was just getting worse. Time in traffic had increased as well as miles traveled. Data from INRIX was used and is available at their website for 2018 as well (http://inrix.com/scorecard/).
In Seattle the cost of improvements for bicycle commuting topped $12 million a mile [11] or a projected $600 million for 50 miles. This may be a special case. National expenditures on bike lanes and other related “traffic calming” measures are difficult to compile as they are usually lumped in with pedestrian improvements and other street modifications. Yet it is estimated that there are now 200 miles of bike lanes in America. Another example of cost comes from Broward County Florida where a “safe streets” project was implemented for 5 complete streets with a cost of $11.4 million. This also included pedestrian improvements. In 1984 Florida was the second state in the nation to adopt the “Complete Streets” policy and by 2018 more than 30 states and 1000 local agencies had adopted it [11]. Florida was the second state in the nation to do so. A study by [12] found that by 2013 the policy had reduced fatalities in pedestrians significantly, with an estimated reduction in more than 3,500 lives.
However, a study by [13], noted that Florida’s cities were at the top of injuries in the nation, though they focused there study on only 1997-8. An earlier study by [13] analyzing data from 1986 to 1995 supported the conclusions of [13] concerning injuring and dangerous street conditions. How do we reconcile these results? The source of information could be the problem [12] based its findings mainly on interviews. It seems at first glance that the Complete Streets program reduced fatalities, but was still unable to reduce injuries. The [13] studies drew data from the United States Census or the United States National Highway Traffic Safety Administration. In 2014 the Smart Growth America and National Complete Streets Coalition team led by Geoff Anderson published a study of Florida’s streets that showed that the state still topped the nation in injuries to pedestrians with data from 2003 to 2012. Their data was from the Centers for Disease Control and other reporting agencies. Median national costs for bikeways per mile, not hard surfaces on which motor vehicles are allowed, approach $250,000 [14]. This varies significantly and excludes costs of property acquisition and some other regional or legal costs. Traffic calming elements run on average by type (from median islands to diverters) from $10,000 to 25,000 each and make many per mile costs quite high. Bike overpasses run on average by type and material (wood vs. steel) $100,000 to $250,000. Marking symbols (typically a bike profile indicating a bike lane) run on average $1000 per mile.
Bicycle and Pedestrian Injuries
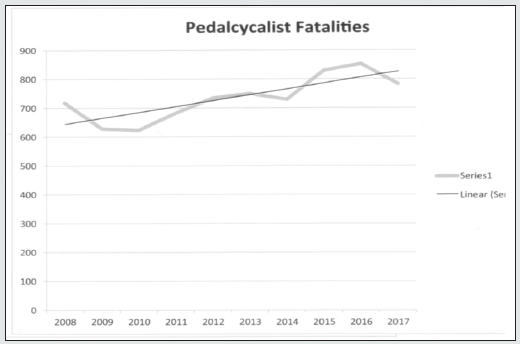
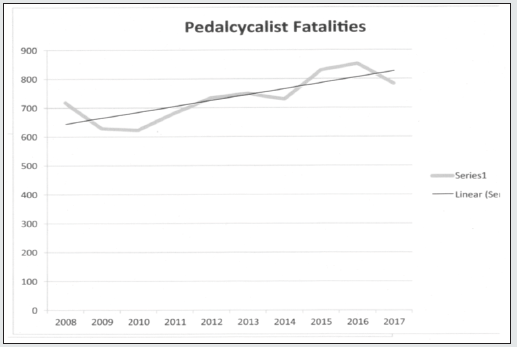
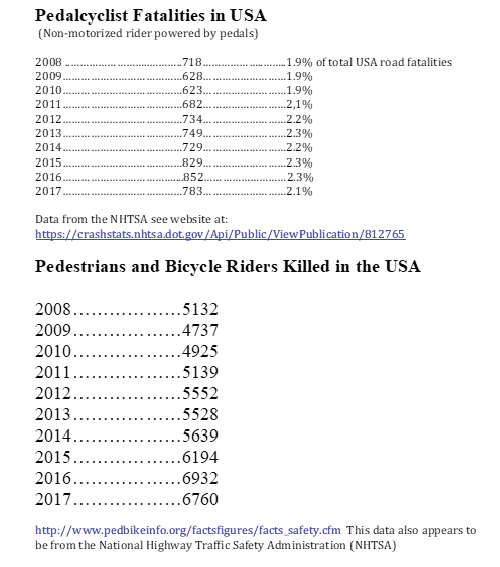
Our next question is have these investments and traffic modifications made the streets safer? In Table 1, I have listed data on fatalities of people on bikes and also pedal powered bike-like vehicles. The use of the term “self or human propelled” implies skateboards but is unclear in many cases. This data is shown graphically in Chart 1 in blue line and the black line is the trend line for the data, slope upward to right. The data at the top of Table 1 is the number of “Pedalcyclist” fatalities from 2008 to 2017. These are rider-powered bikes and other bike-like vehicles. The bottom list is for pedestrian and bicyclists killed on U.S. streets and trails for the same period. One can see that pedestrians have suffered far greater than bicyclists. The top list of Table 1 shows that Pedalcyclist fatalities rose from 1.9% of all roadway fatalities in 2008 to 2.1- 2.3% in 2016-2017. The trend line clearly points out this increase. In the lower section we find that pedestrians and bicyclist fatalities increased by 32% from 2008 to 2017. This data is from Pedbikeinfo and is derived mainly from the NHTSA. It is also graphed as Chart 2 with a trend line that shows the increase over time.
Table 2: Data for Traffic from INRIX and Bike Friendly People for Cities and Bikes () = accidents [] = population rank italics = pollution rank.
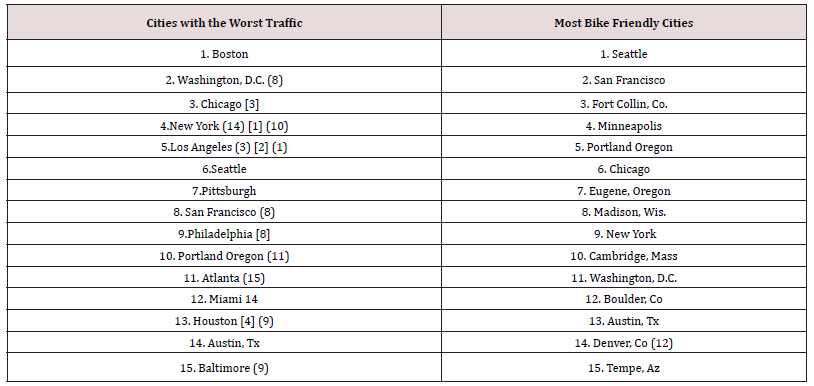
In comparing lists of most bike friendly cities (with the most modifications for bike use and safety) with the cities with the worst traffic and most hours lost in traffic we find a remarkable contradiction (Table 2). Some of the most bike friendly cities have the worse traffic. So we ask are these modifications to promote bike use causing more traffic delays? We find some cities in both columns, that is, worst traffic and most bike-friendly. However, the data for bike friendly cities includes cities with very small populations so comparing the left column of large cities does not provide a per capita relation between the two columns. Ranking for number of accidents appears in the left column in parentheses. If we add the population rank to the list in brackets we see that some of the cities with the highest population also have high rates of accidents and appear high in the right column. Only one city turned up on the top 20 cities for most dangerous for pedestrians, that was Miami. A meta-analysis of 33 studies of traffic calming projects found that traffic calming, when combined with widening adjacent streets to carry heavier traffic loads, could reduce accidently by up to 15% [15].
Pollution
Our next concern is the effect of cars or bikes on pollution. We should expect to find that those cities with the most bike use would have less pollution. Rankings for this are in the columns in italics in Table 2.
Transit and Road Use Ideology
Not one of the cities listed by People for Bikes as most bike friendly was in the top 15 cities in the USA with the cleanest air, according to data provided by the American Lung Association (https://www.lung.org/our-initiatives/healthy-air/sota/cityrankings/ cleanest-cities.html).
Discussion and Conclusions
What we find from our Table 2 is that 5 of the cities touted for bike friendly modifications of their roads have either some of the worst traffic or are quite dangerous for both pedestrians and bikes as well as have high rates of accidents. Vehicle registrations from 2008 to 2017 have increased by 16,468,240 according to Census data. The Federal Highway Administration reports that Americans are driving more, up 2.8% in 2015. Data on ride-sharing indicates that more than 95 million people used Uber or Lift or one of the other companies in 2018 (https://www.statista.com/statistics/833743/ us-users-ride-sharing-services/). It is also clear these services are contributing to congestion (Bliss, 2019). Traffic calming initiatives can cause controversy in neighborhoods and cities where they affect travel or “trip” times by a busy populace. A New York Times story in July of 2008 is characteristic of the theory of traffic calming and the effects it has on actual lives of people [16]. In many cities in the world the issue of traffic and safety bring up the issue of traffic calming as a means of creating safe streets and reduce noise and pollution caused by auto and truck traffic [17]. The basic idea has evolved as a means of protecting or creating urban environments that are quiet and safe. A means of protecting residents’ use with that of motorists and bike users as well as pedestrians is also a goal [18]. [19] found an average reduction in accidents of about 40% in the Vancouver area and a reduction of accident claim costs between 10 and 57%. However, a meta-analysis of a number of studies from a wide geographic area found only an 11% reduction in accidents [20]. Another study [21] questioned whether road conditions, including paving type and street lighting, were missing factors in some studies and recommends an “area wide approach.” This concern is supported in a later study by [22]. A few studies reporting significant reductions in injuries are projections for small studies or based on assumptions from estimated reductions in speed and probable injury [23].
Ideas and experiments in creating a combination of uses by attempting to redesign urban streets arose in Scandinavia, the Netherlands and Germany in the 1960s and 70s [24]. Traffic calming measures have been found to reduce injuries and accidents in the areas where they are employed but result in traffic diversion around them, increasing congestion and accidents in adjacent areas [23]. The generally supported concept is the value of reducing speeds and thereby reducing the severity of impacts and damage/ injury [25]. A comprehensive study of the effectiveness of traffic calming techniques of different kinds found that the greatest benefit was in speed reduction in the local area of application, while accident frequency was only reduced in about half the cases depending on type of technique employed (Rahman, Kojima and Kubota, 2009). While traffic calming creates conflict among residents and motorists, and especially police and emergency vehicle personnel, the benefits seem to accrue to local residents most in improvements in general perceptions of quality of life. It has also been shown to slow emergency vehicles and endanger lives (Robinson, 2006). Overall, reduction of speed seems to be the main mechanism but often only shifts traffic and speed to adjacent roads resulting in more accidents and injuries in those areas and negative quality of life impacts there. In San Francisco traffic fatalities have varied dramatically since 2010, from less than 5 to 11 in just the first 6 months of 2019 (https://sfgov.org/scorecards/ transportation/traffic-fatalities). Pedestrians suffer the greatest number of fatalities (https://www.visionzerosf.org/wpcontent/ uploads/2019/07/06.2019Fatalities_JuneSummaryMemo.pdf). While bike fatalities are low for 2019 thus far, they increased in 2016. Overall comparisons nationally show San Francisco having a general upward trend in bicycle accidents and injuries where other cities have demonstrated either no change or slight reductions (https://www.gjel.com/california-bicycle-accident-lawyers/ bicycle-accident-statistics-us-bay-area.html). This data appears to include injuries and is drawn from claims and hospital records. When checked against a partial database made available by the [26] it showed general similarity in pattern [26]. In fact, recent figures have supported the idea that traffic-calming measures have decreased injuries to bicyclists but increased those to pedestrians. And San Francisco officials have claimed this association [27,28]. With cyclist injuries or death at less than 10% of those of pedestrians what we are seeing is a transfer of social good to one group at the expense of another; to the danger of a majority to benefit a minority. The causes of the increase in pedestrian deaths and injuries in San Francisco have been explained recently by officials [29]as due to:
a) an increase in population and jobs
b) increased homelessness
c) an aging population
d) more vehicles on the road
Comparing the increase in fatalities in auto accidents in San Jose [30] to that in San Francisco, these might be valid causes. Both pedestrians in general are suffering fatalities and injuries at comparable rates to those in San Francisco, the elderly and homeless are a significant element in this rise. On the other hand, San Jose has also embarked on a program of traffic calming defined as basic and comprehensive (Annonymous, n.d., see: http://www. sanjoseca.gov/DocumentCenter/Home/View/235; and 2001, see: https://www.ca-ilg.org/sites/main/files/file-attachments/toolkit. pdf).
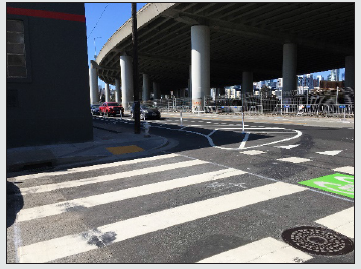
Theoretical arguments for slowing city traffic and reducing auto use via amenity reduction (i.e., fewer parking spaces) is not linked to investments in mass transit or other means of travel that would rationally produce choices for city residents and commuters [31]. Planners appear to believe that by creating worsening traffic and parking conditions people will chose to walk, bike or use public transportation even when no provision is made to increase public transit options [32]. In fact, city planners are ignoring or downplaying residents’ desire for parking. Surveys both in the USA and Europe have shown that people make trip choices based on availability of parking and transit. Businesses, especially small businesses find that current reductions of parking options (even when parklets reduce parking and are conceived to promote foot traffic for shopping) reduce commerce [33]. Removal of parking has been often considered a means to add traffic lanes and reduce congestion, however, recent trends have been to use removal of parking to produce bike lanes of traffic calming [34]. Some removals have resulted in massive traffic jams lasting hours (see images from San Francisco’s China Basin area Figures 1-8). It seems obvious that the current traffic calming theory is failing due to a lack of association of key elements. When cities and planners can attempt to reduce car use, the lack of alternative transit and trip possibilities is critical. Attempts to reduce parking and auto use without increase public investments in mass transit have resulted in citizen anger and in some cases removal of calming devices and restoration of parking (removal of parklets) [35]. Another related issue is the lack of affordable housing, which is increasing driving times for commuters and creating more dependence on autos, especially as single driver trips [36]. The principles of transportation development and housing needs have been known for more than a century [37], though even many ancient cities developed systematic approaches to increased population and flow of populace and commerce [38,39]. More emphasis is needed on designing affordable housing and transportation. Current theory of planning seems to believe that creating dysfunctional conditions will lead to adaptation. This may be true, but history also provides us with stark examples of citizen anger at policies that undermine the quality of life [40-44].
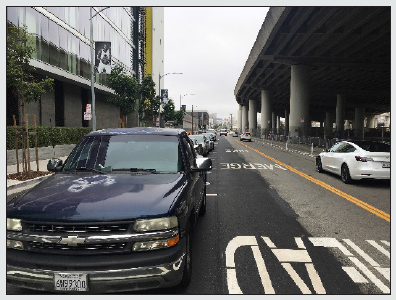
Figure 2: Opposite view from Figure 1 showing parking lane with bike lane to right. Opposite direction bike lane can be seen on left with on coming traffic. Right hand lane is bifurcated and parking faded out towards 16th Street in distance. Dashes indicate left turn lane onto 16th Street.
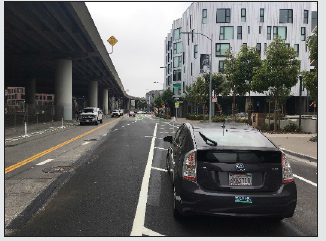
Figure 3: View of 7th Street from one block before area shown in Figures 1 and 2. Previous 4 lane configuration now 2 lanes. Continuation of bike lane on right and left. 7th Street is funneled from 4 lanes to 2 lanes prior to this intersection creating continuous traffic jams during most of the day. At the end of this block toward the over pass is a left turn lane to cross railroad tracks. Drivers in the direction toward 16th can be prevented from passing waiting traffic to cross the tracks for over 10 minutes at a time. Drivers on the opposite side of the rail tracks are often backed up blocking a roundabout and lanes exiting it that lead to 4th Street and 16th creating a considerable traffic jam.
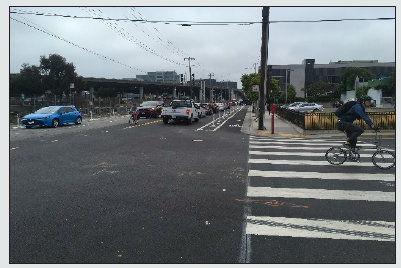
Figure 4: View of bike lane designed to prevent car door opening to injure or impede bicyclists. Parking spaces are now in what was a traffic lane with traffic moving passed parked cars in only lane left.
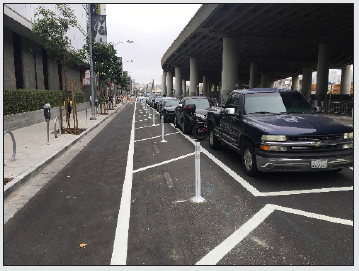
Figure 5: View of 7th Street farther north of previous images showing loss of parking and bike lanes. Street has been engineered to remove as much parking as possible and provide space for “safe” lanes for bikes. Traffic is squeezed into one lane in each direction. Design creates an opportunity for drivers to enter the bike lane to attempt to pass stopped traffic creating dangerous conditions.
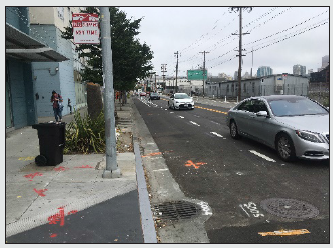
Figure 6: View of 7th Street showing cars parked in former curb lane and increased danger for drivers to exit their autos.
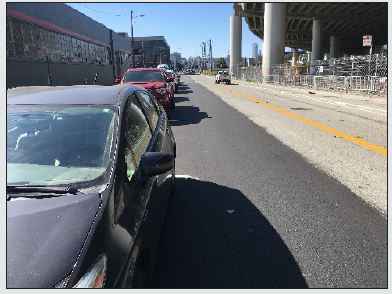
Figure 7: View of intersection with stop sign where drivers’ view of oncoming traffic is blocked by parked cars in former curb lane.
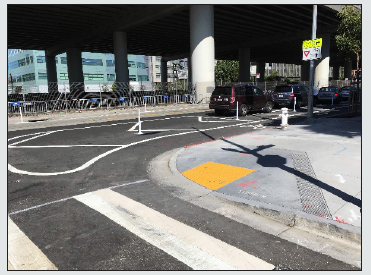
Figure 8: View of same intersection as in Figure 7 showing not only blocked view of oncoming traffic on 7th but also how traffic on oncoming lane cannot see bicycle riders in lane hidden by cars.
Note on Methods and Research
This research was conducted from May of 2014 to August of 2019. Fieldwork was concentrated in San Francisco, Oakland and Marin County. Interviews, measurements, and photographs were taken by the author.
Acknowledgements
I would like to thank Mr. James Shahamiri of the San Francisco Municipal Transportation Agency, Sustainable Streets Division.
References
- Gonzalo Orden Hernan, Rojo Marta, Perez Acebo Heriberto, Linares Alaitz (2016) Calming measures and their effects on the variation of speed. Transportation Research Procedia 18: 349-356.
- (2020) Reimagining our streets in the ear of COVID-19. LGC (Local Government Commission Newsletter).
- (2020) Rethinking sidewalks and streets in the midst of COVID-19. National League of Cities.
- Walker Alissa (2020) This spring, we all drove much less. Yet traffic deaths went up, why? . Curbed.
- Blanco, Sebastian (2020) Traffic deaths lowest since 2014, but 2020 numbers aren’t looking good. Car and Driver Magazine.
- Marshall Aarian (2018) The stubborn bike commuter gap between American cities. Wired, September 22.
- Hoffman Melody L (2016) One less car, one more critique: U.S. urban bicycle culture and advocacy. Bike Lanes Are White Lanes, University of Nebraska Press, Norman.
- Furnass Zack (2010) Critical Mass and the functions of bicycle protest. in book, (ed.) One Less Car: Bicycling and the Politics of Automobility, Temple University Press, Philadelphia, USA.
- Downs Anthony (2004) Traffic: why it’s getting worse, what government can do. Brookings Institute, Policy Brief Series.
- Schneider Robert J (2018) Complete Streets’ policies and eliminating pedestrian fatalities. Am J Public Health 108(4): 431-433.
- Lindblom Mike (2018) 12 million a mile: here’s how bike lane costs shot sky high in Seattle. Seattle Times.
- Porter Jamila M, Stephen L Rathbun, Shenee J Bryan, Katie Arseniadis, Lauren P Caldwell, et al (2018) Law accommodating nonmotorized road users and pedestrian fatalities in Florida, 1975-2013. Am J Public Healt 108 (4): 525-531.
- Dittmar Hank, Ken Cook (1995) Mean Streets: Pedestrian Safety and Reform of the Nation’s Transportation Law, Environmental Working Group, Surface Transportation Policy Project, Washington, DC, USA.
- Bushell Max A, Bryan W Poole, Charles V Zegeer, Daniel A Rodriguez (2013) Pedestrian and Bicyclist Infrastructure Improvements: A Resource for Researchers, Engineers, Planners, and the General Public. UNC Highway Safety Research Center p. 1-46.
- Elvik Rune (2001) Area-wide urban traffic calming schemes: a meta-analysis of safety effects. Accident Analysis and Prevention 33(3): 327-336.
- Burghardt Linda F, (2008) Traffic calming’ theory can provoke a storm. New York Times July 20.
- Rosli Nur Shazwani, Hamsa Abdul Azeez Kadar (2012) A theoretical review in evaluating the impact of traffic-calming measures in the residential living environment. IIUM p. 1-15.
- Ben Joseph E (1995) Changing the Residential Street Scene: Adapting the Shared Street (Woonerf) Concept to the Sub-urban Environment. Journal of the American Planning Association 61(4): 504-515.
- Zein Sany R, Erica Geddes, Suzanne Hemsing, Mavis Johnson (1997) Safety benefits of traffic calming. Transportation Research Record: Journal of Transportation Research Board 1578(1): 3-10.
- Bunn F, T Collier, C Frost, K Ker, I Roberts, et al (2003b) Traffic calming for the prevention of road traffic injuries: systematic review and meta-analysis. Inj Prev 9(3): 200-204.
- Bunn F, T Collier, C Frost, K Ker, I Roberts, et al (2003a) Area-wide traffic calming for preventing traffic related injuries. Cochrane Database Syst Rev 1: CD003110.
- Beyer F R, K Ker (2009) Street lighting for preventing road traffic injuries. Cochrane Database Syst. Rev 1: CD004728.
- Litman Todd (1999) Traffic calming benefits, costs and equity impacts. Victoria Transport Policy Institute p. 1-32
- Van Schagen, Ingrid (2003) (ed.) Traffic Calming Schemes, Institute for Road Safety Research, Leidschendam, The Netherlands.
- Archer J, N Fotheringham, M Symmons, B Corben (2008) The Impact of Lowered Speed Limits in Urban/Metropolitan Areas. Transportation Research Board Publications.
- San Francisco Municipal Transportation Agency, (2019) Sustainable Streets Divivion, Collision Injury Data, accessed by James Shahamiri, August.
- Swan Rachel (2019) Safety improvements cut cyclists’ risk. San Francisco Chronicle.
- Gafni Mattias, Sanchez Tatiana (2019) Third pedestrian death downtown within a month. San Francisco Chronicle, August 12th:C3.
- Swan Rachel (2019b) Critical injuries surge on city streets. San Francisco Chronicle.
- Deruy Emily (2019) San Jose: traffic fatalities rising. San Jose Mercury News.
- Ibrahim H (2017) Car parking problem in urban areas, causes and solutions. First International Conference Towards a Better Quality of Life.
- Jaffee Eric (2015) A quick, clear explanation for why parking minimums hurt cities. CITYLAB, Dec. 14.
- Garthwaite Josie (2011) To curb driving, cities cut down on car parking. National Geographic News, July 14.
- Rodrigue Jean Paul “Urban Transport Challenges,” in Jean-Paul Rodrigue (2017) (ed.), The Geography of Transport Systems, 4th edition, New York, Routledge.
- Rahman Farzana, Aya Kojima, Kubota, Hisashi (2009) Investigation on North American Traffic Calming Device Selection Practices. IATSIS Research 33(2): 105-119.
- Sisson Patrick (2017) Supercommuters, skyrocketing commutes and America’s affordable housing crisis. Curbed p. 1-9.
- Fair Marvin L, Williams Ernest W (1959) Economics of Transportation. Revised Edition, New York, Harper and Brothers.
- Hull, Richard W., (1976) African Cities and Towns Before the European Conquest. New York, Norton and Norton.
- Caldararo, Niccolo (2019) An Ethnography of the Goodman Building: The Longest Rent Strike, New York, Palgrave/MacMillan.
- Lefebvre Georges, R R Palmer (translated) (1947) The Coming of the French Revolution. Princeton University Press, USA.
- Anderson Geoff, Craig Chester, Kara Davis, Steve Davis, Alex Dodds, et al (2014) Dangerous by Design. National Complete Streets Coalition, Smart Growth America p.1-38.
- Bliss Laura (2019) How much traffic do Uber and Lift cause? CITYLAB, 5 August.
- Robinson Jenna (2006) Traffic calming endangers the lives of those in need of emergency services. The John Lock Foundation p. 1-10.
- Scheider Benjamin (2018) Traffic’s mind-boggling economic toll. CityLab.

Top Editors
-

Mark E Smith
Bio chemistry
University of Texas Medical Branch, USA -

Lawrence A Presley
Department of Criminal Justice
Liberty University, USA -

Thomas W Miller
Department of Psychiatry
University of Kentucky, USA -

Gjumrakch Aliev
Department of Medicine
Gally International Biomedical Research & Consulting LLC, USA -

Christopher Bryant
Department of Urbanisation and Agricultural
Montreal university, USA -

Robert William Frare
Oral & Maxillofacial Pathology
New York University, USA -

Rudolph Modesto Navari
Gastroenterology and Hepatology
University of Alabama, UK -

Andrew Hague
Department of Medicine
Universities of Bradford, UK -

George Gregory Buttigieg
Maltese College of Obstetrics and Gynaecology, Europe -

Chen-Hsiung Yeh
Oncology
Circulogene Theranostics, England -
.png)
Emilio Bucio-Carrillo
Radiation Chemistry
National University of Mexico, USA -
.jpg)
Casey J Grenier
Analytical Chemistry
Wentworth Institute of Technology, USA -
Hany Atalah
Minimally Invasive Surgery
Mercer University school of Medicine, USA -

Abu-Hussein Muhamad
Pediatric Dentistry
University of Athens , Greece

The annual scholar awards from Lupine Publishers honor a selected number Read More...


