Lupine Publishers Group
Lupine Publishers
Menu
ISSN: 2690-5752
Research Article(ISSN: 2690-5752) 
Functional Adaptation of the Human Facial Skull to the American Ecosystems of the Late Pleistocene Volume 4 - Issue 4
Daniel Turbón*
- Zoology and Anthropology Sub Dept of Evolutionary Biology, Ecology and Environmental Sciences. Faculty of Biology, University of Barcelona, Avda. Diagonal 643, 08028 Barcelona, Spain
Received:July 06, 2021 Published: July 14, 2021
Corresponding author:Daniel Turbón, Zoology and Anthropology Sub-Dept. of Evolutionary Biology, Ecology and Environmental Sciences. Faculty of Biology, University of Barcelona, Avda. Diagonal 643, 08028 Barcelona, Spain
DOI: 10.32474/JAAS.2021.04.000192
Abstract
This study investigates the degree to which the facial diversity of Amerindian hunter-gatherers reflects their evolutionary history and their adaptation to the ecosystem whose resources they exploited. 417 undeformed skulls (231 male and 186 female), from various collections and museums in Europe and America, were studied. The technique of W.W. Howells and discriminant analysis were applied to 17 facial variables from four Amerindian series and the Greenland Eskimo series, in both sexes. Cranial size (PENSIZE) and shape (C-Scores) were examined separately. By removing the cranial size, a hidden and new information emerged. Both Amerindian marine and terrestrial hunters studied are well distinguished from the Eskimos. The main differential character in facial variation are both subnasal and alveolar prognathisms, with wide ranges of intragroup diversity. Both prognathisms, alveolar and subnasal, are variable, although more marked in the women of all the samples studied. The Selknam (Tierra del Fuego) and Arikara (South Dakota) men are the least prognathic. The morphological variation found is not associated with a specific ecosystem (marine or terrestrial). Our analysis reflects the evolutionary history of the Amerindians with significant differences due to functional adaptation which modified their faces.
Keywords:Human Climate Adaptation; Skull; Amerinds; Hunter-Gatherers; Discriminant Analysis
Introduction
The American continent is an ideal place for studying the evolution and adaptation of the human phenotype to different ecosystems. The reason lies partly in the osteological variation of the American hunter gatherers who are descendants of the first settlers, given that they were the first humans to arrive there. Thus, the cultural and biological differences between Amerindian populations can be most effectively examined to test how much of their variation is the outcome of in situ evolutionary development.
Current data supports the notion that the first American settlers came from one or more populations in Central Asia in ca. 16,000 BP. Neither archaeological not genetic findings now support an occupation of the Americas before 17.5 KYA. [1,2]. One trend of the Amerindians is genetic unity [3] with concurrent morphological diversity. Tierra del Fuego, at the southern tip of the continent, was colonized by the ancestors of three ethnic groups whose formation is unknown. Two groups were marine hunters (Alakaluf and Yamana) while the third hunted on land (Selknam) [4-7]. The two latter groups were isolated on Isla Grande when the Straits of Magellan opened in ca 10,000 BP. The Yamana and Alakaluf developed extreme physiological adaptations to resist cold [8,9]. Such changes were not shared by the robust, heavily-built Selknam terrestrial hunters. A long period of geographical isolation made the Fuegians a useful people for documenting biosocial factors, resource exploitation and adaptation to an adverse environment, and the outcomes of activities such as dragging trees or canoes, carrying objects or paramasticatory activities. This functional adaptation is of interest to archaeologists when reconstructing prehistoric societies in cold environments in Europe, America and Siberia. Today there is a large amount of archaeological, ethnographic and craniological information, along with data from molecular biology, on the descendants of the First Americans. Paleogenetic studies have established that they are Asiatic in origin [10-14]. There is an extensive abridged bibliography [15] on the craniofacial diversity of Amerindians. Three issues should be borne in mind to avoid potential bias or incorrect interpretation. The first one is intentional or unintentional cranial deformation, which is very common in American cultures. Slight cases of this process often go unnoticed [16-19]. Secondly, the correct diagnosis of gender, which requires quantitative criteria, preferably quantitative and specifically generated for the group being studied [20]. The third issue is undetected interethnic mixes, as is the case of the Dawsonians in Tierra del Fuego [18] which is a biologically mixed group of Alakaluf and Selknam in the Straits of Magellan, with a mixed language described by Anglican missionaries [21]. One or more of these issues affects all the collections of crania, which are necessary tools since they allow us to come closer to reconstructing the human past.
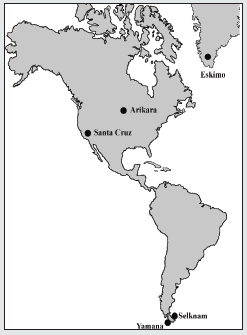
On the other hand, scientific advances, especially in epigenetics, have opened up new perspectives in research that have had an impact on interpretations and conclusions. The great differences in bodily features between human groups may be partly related to a significant link with factors of genetic regulation and environmental action, more than to any underlying phylogenetic effect. A case in point is height, which involves a major hereditary component but which can increase or decrease according to the type of diet. Other characteristics, such as robustness of the forehead, shape of the skull may be influenced by biomechanical and hormonal factors and by secular change, which increase intra-population diversity [15]. Such factors may explain the overlapping between the most diverse populations in the world in terms of length, height and width of the human cranium, even when taking into account the high level of genetic inheritance. It is also necessary to simplify analysis of the Amerindians so as to understand them better. Once it is established that there are no excessively deformed crania, it is then possible to separate size from shape using reliable methods [22-24]. The parameters used in this article are PENSIZE and C-Scores, designed by Howells [25,26]. Two main aims are pursued: to establish the morphological differences in the facial variables complex between Amerindian hunter-gatherer populations that exploited coastal and terrestrial ecosystems respectively, and to account for these differences within an evolutionary framework. The relative differences in the shape of the face (without size) should reflect the functional adaptations caused by masticatory or non-masticatory activities. The facial size can then be added as appropriate. The first object of study is the Yamana canoeists of the Beagle Channel and the Selknam terrestrial hunter-gatherers of Isla Grande of the Tierra del Fuego. The second analysis considers the canoeists of Santa Cruz Island (California) and the Arikara terrestrial hunter gatherers (Dakota del Sur). The final subject of study is the whole group plus the Greenland Inuit as an outgroup (Figure 1). The Inuit, despite not being Amerindians, belong to the group of circumpolar populations of hunters and fishermen with canoes, and it would be interesting to compare their functional adaptations to those of the Yamana and the canoeists of Santa Cruz Island.
Material and Method
Data set and technique
The sample consists of 417 undeformed skulls (231 male and 186 female), (Table 1). Samples from Eskimo (Greenland), Arikara (South Dakota) and Santa Cruz Island (California) [27]. The Fueguian samples (67 of the Selknam, 71 of the Yamana ethnic groups), from the following European and American collections: Naturhistorisches Museum (Vienna); Istituto di Antropologia (Florence); Università degli Studi La Sapienza (Rome); The Natural History Museum (London); Musée de l’Homme (Paris); Museo Etnográfico J.B. Ambrosetti (Buenos Aires); Museo de la Plata (Argentina); Museo del Fin del Mundo Ushuaia (Argentina); Misión La Candelaria, Río Grande (Argentina); Instituto de la Patagonia, Punta Arenas (Chile); Museo Mayorino Borgatello, Punta Arenas (Chile); Museo Provincial de Tierra del Fuego F. Cordero Rusque, Porvenir (Chile); Museo Martin Gusinde Puerto Williams (Chile); National Natural History Museum (Santiago de Chile); American Museum Natural History (New York) and National Museum Natural History Smithsonian Institution (Washington D.C.) [18]. The data base used consisted of 63 variables described in Howells’s Craniometric Data Set [25,26,27]. The formation of the Magellan Strait about 10,000 years ago separated Isla Grande from the continent, isolating the island’s inhabitants and thus giving rise to the Selknam, an ethnic group that subsisted by hunting. The Yamana and Alakaluf on the other hand were hunter-gatherers that used canoes and mainly inhabited the small islands to the west and south of Tierra del Fuego. Both groups exploited the marine resources, mainly seals and shellfish, and seabirds as a secondary resource. In both ethnic groups the women were responsible for gathering molluscs, basically the species mytilus [4-7]. The Early Arikara sample (Table 1, Figure 1) is curated partly at U.S. National Museum, Washington Museum of Natural History, University of Kansas, Lawrence (Howells 1973, p. 29). This series comes from a single village site (the Sully site, 39 SL 4) near the centre of South Dakota, believed to have been occupied by proto-historic Arikara from about 1600 to 1750 CE.
The Santa Cruz Island (California) sample (Table 1, Figure 1) is the largest of the islands in the Santa Barbara Channel. At the time of first contact, it was inhabited by Chumash. In 1875 Paul Schumacher, under the auspices of the Smithsonian institution, collected skeletal and cultural material from the islands, including seven coastal sites on Santa Cruz. The humans remain are assignable to the late Canaliño time period of a few recent centuries. The series is thus judged to be relatively homogeneous genetically: not tightly restricted temporally or locally, but nonetheless one restricted to a single island, culture, and tradition [25]. The Eskimos studied here [25] are all from a continuous area of west and southeast Greenland as far as Scoresby Sound, and were all associated with the lnugsuk culture (Table 1, Figure 1), following the early Norse settlement but antedating Danish colonization about 1750. The specimens are from graves giving no evidence of contemporaneity with Danish settlement. They were collected on various expeditions, from 1898 to 1935. They are curated at the Anthropological Laboratory, University of Copenhagen.
Data processing
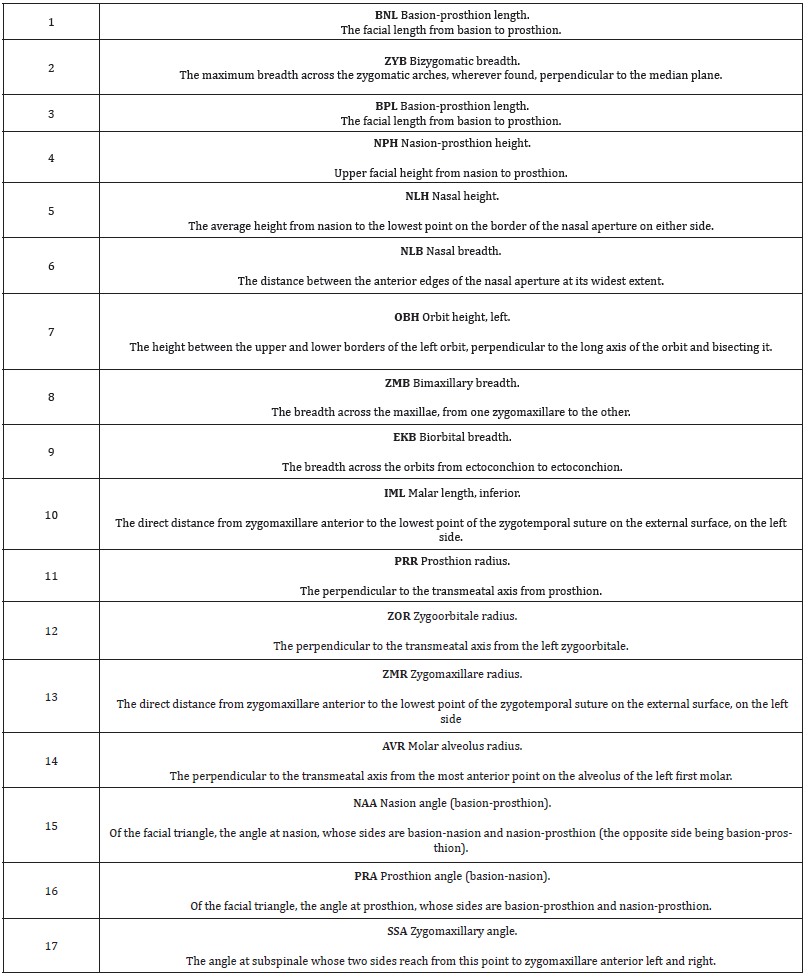
A rigorous ethnic identification of the biological interaction between the Fuegian groups themselves and with other samples from America and Australia was carried out. All the crania were carefully examined and their origin and ethnic attributes were recorded. Cases that were doubtful in terms of gender and ethnic group were diagnosed with discriminant functions taken from well documented specimens. Deformed crania were detected and discarded [18,19], since deformation causes changes to the face and the base of the cranium [16,17,28]. Seventeen facial variables were selected from the 63 craniofacial variables that were initially available, to make the multivariant analysis less difficult to interpret. It important not to introduce more than 31 variables so as to prevent distortion in the covariance matrixes, given that the 32 Yamana women (Table 1), are the sample with the fewest individuals in the study. For both reasons it was felt that the best decision was to study the facial variation using a set of 17 quantitative variables (Table 2). The variables were initially standardized to prevent the magnitude effect. Interferences between magnitudes of long dimensions (BNL, BPL) with those of less range of variation (NLB) were therefore avoided (Table 2). However, the standardization did not eliminate the correlation with the original measurements in mm, since the same r of Pearson is obtained, and the cranial size is shown. Thus, the C-Scores were calculated as follows: from the standardized variables (Z-Scores), the cranial size (PENSIZE) of each sample studied was calculated, finding the individual value of each case subtracting it from the general average of each sample divided by the number of measurements. Then the Z-scores were centered once again by subtracting from each of them that individual’s PENSIZE, so that the sum of these deviated scores is zero [26].
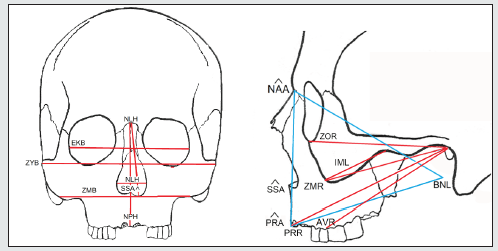
Once the effect of the cranial size is removed, the inter- and intra-population proportions can be interpreted: facial width, subnasal flattening, alveolar prognathism, etc, both in frontal view and in side view (Figure 2). Given that the aim is to establish the facial differences, the appropriate method would be discriminant analysis, which enables groups and as many variables as are necessary to be differentiated in order to bring about the best possible classification. At the same time, the objective of this study is not to classify, since group membership has already been established, but rather to detect the facial differences relating to lifestyle in different ecosystems. The fact that there is a reduced capacity for discrimination once facial size is removed should be taken into consideration. Finally, the standard tests of normality and homoscedasticity were calculated. Most of the mathematical calculations were obtained with the IBM SPSS program v.26. The variation ellipses with a confidence of 95% were computed with PAST (Paleontological statistics software package v. 3.25) [29].
Results
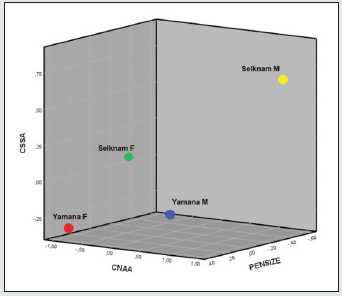
The tests of normality and homogeneity of variances gave no signs of notable deviations, with the exception of a few variables related to prognathism when both sexes were jointly analysed. On the other hand, when sexes were separated and five series were joined in order to examine the set of samples of the American continent, some variables were placed at 2% of significance (Kolmogorov-Smirnov test). These were the variables related to the forward projection of cheekbones (CZMB, CZMR), and prognathism (CNAA), which were located at the limit of parametrical statistical significance, due to a facial peculiarity of the Inuit. On the other hand, Friedman’s non-parametric tests implied a null hypothesis of non-deviation from normality in all the cases. The analysis of the Fueguian sets by ethnic groups and combined genders (Figure 3) showed correct classification of 74.6% of cases. This rate is not low, if one considers that the cranial size has been removed, and that the phenotypes of both sexes were studied at the same time. The covariance matrixes showed no distortion (Box test, p value: 0.24). The C-Scores of 4 variables of prognathism (CNAA, CPRA) and of the width of the cheekbones (CZYB, CIML) explained the 100% variance of the three discriminant functions, whose canonic correlations were: 0.79, (80.8%), 0.51 (96.7% accumulated), and 0.26 (100% accumulated). The standardized coefficients of alveolar prognathism (CNAA and CPRA) weighed more in the first function; the width of the face and prognathism (CZYB and CNAA) in the second and the prominence of the malar bone (CIML) in the third (Table 3). The diversity of the facial form of the terrestrial and marine hunters of Tierra del Fuego can be seen via confidence regions of the first two discriminant functions (96.7%). Bearing in mind that the facial size has been reduced to the same scale, the Yamana and Selknam women are more prognathous than the men, in alveolar (CNAA, CPRA) and subnasal (CSSA) terms (Figure 4). The first two variables mentioned are the most significant ones in the analysis. The Selknam women also tend towards prognathism, when compared to men. The Selknam men show considerable variation in the first discriminant axis, since there are men who are less prognathous than others (Figures 5 and 6). When the first two variables of prognathism are combined (CSSA, CNAA) with the cranial size (PENSIZE) (Figure 7) the maximum separation between the groups can be seen. On the other hand, the Selknam men show a face with large dimensions due to high scores of CZYB, CZMB and CNPH.
Table 3: Standardized coefficients of canonical discriminant functions explaining 100% of the variability of the Tierra del Fuego samples, Yamana and Selknam ethnic groups of both sexes.

Figure 3: Ninety- five per cent confidence regions for the population scores of the first two canonical discriminant functions, explaining 96,7% of the variability. Yamana and Selknam ethnic groups of both sexes.
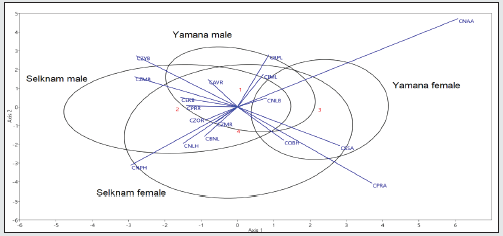
Figure 4: Yamana female Fi 3117 (Istituto di Antropologia, Firenze, Italy) from the Beagle Channel (Ushuaia, Argentina) exhibiting subnasal prognathism typical of women in this group (Figure 3).
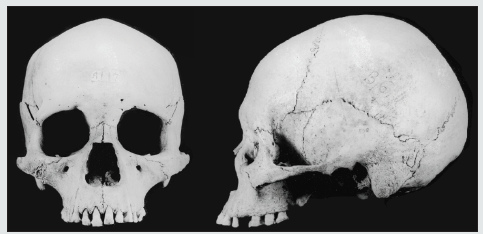
Figure 5: Selknam male 33950 T.R-1 (Instituto de la Patagonia, Punta Arenas, Chile), with little or no subnasal prognathism. Note that a Selknam male sector of the confidence region, in Figure 3, represents low values for the forward projection of the face (CNAA, CSSA), compared to Selknam women.
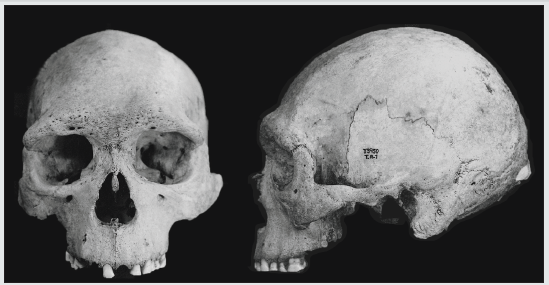
Figure 6: Selknam male L2-288 (Instituto de la Patagonia, Punta Arenas, Chile), showing some degree of subnasal prognathism (see the Selknam male confidence region, in Figure 3).
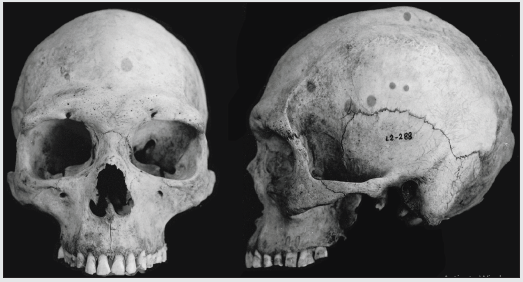
Figure 7: Variation of Fuegian skulls joining the facial variation (CNAA, CSSA) the cranial size (PENSIZE).
A combined analysis (including both sexes) of the ethnic groups of the canoeists in Santa Cruz Island (California) (Figure 8) and the Arikara terrestrial hunters (South Dakota) gave a similar result to that of Tierra del Fuego. This time, eight variables were necessary to explain the three resulting discriminant functions, which correctly classified 81.3% of the cases. There is no distortion in the covariance matrixes of the 17 variables combined by ethnic groups and sex (Box test, p value: 0.6). The 95% ellipses of confidence (Figure 8) that separate the canoeists of both sexes are caused by alveolar prognathism (CNAA), and to a lesser extent by subnasal flatness (CSSA), which are the major contributors to the first discriminant canonic function (Table 4). This first function explains the 72.3% variation, the second adds 26.5% (98.8% accumulated), and the third 1.2% (100% accumulated). In the second discriminant function, the variables with most weight are CAVR, related to alveolar prognathism, and CZYB, associated with the width of the face in the zygomatic arches, (i.e. the muscles that enable the mouth to be closed) which reflects functional activity (Table 4). In the second axis, CPRA, the other angle of facial prognathism, separates men and women of both ethnic groups, and the women are more prognathous. The main difference in the case of Tierra del Fuego is that the Arikara women are less prognathous than the men of Santa Cruz Island. The greatest degree of similarity is the gender division of work shown in the greater prognathism of the women. When the variables of prognathism (CSSA, CNAA) are combined with those of cranial size (PENSIZE) (Figure 9), the gender division of work in such ethnic groups and its association with subnasal prognathism (CSSA) can be clearly seen. This is because, unlike the confidence regions (Figure 8), the Arikara women are closer to the women of Santa Cruz as a result of this feature, which was hidden in Figure 8 since CNAA weighs more than CSSA in the first discriminant function. The third scenario was the study (in separate genders) of the above sets, by adding a non-Amerindian outgroup, the Greenland Inuit, to compare them with the Yamana of Tierra del Fuego. This was done because both ethnic groups exploit the same marine resources in cold environments and in different hemispheres (Figure 1). In the above scenarios, Friedman’s non-parametric test did not show a deviation from normality and, more importantly, the respective Box tests were not significant in any of them. This time, the Box test did show significance when the Greenland Inuit were included (covariance of 5 samples of 17 variables each one, in each gender), which indicates that the Inuit are really very different from the Amerindians. The efficacy in the classification via discriminant analysis (men 87.4%, women 85.9%), was greater than in the previous scenarios, since the sexes had been studied separately. Twelve variables were necessary to explain the four discriminant functions (Tables 5 and 6) both in men and in women, although the variables selected are not the same in terms of their selection or for their statistical weight. The variation in the shape of the face shown in figures 10 (men) and 11 (women) for the first two functions explains the 81.1% in men and the 85.3% respectively.
Table 4: Standardized coefficients of canonical discriminant functions explaining 100% of the variability of Santa Cruz Island (California) and Arikara (South Dakota) samples. groups of both sexes.
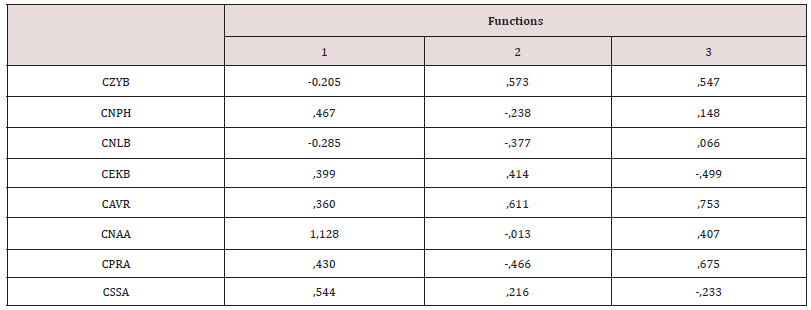
Table 5: Standardized coefficients of the four canonical discriminant functions explaining 100% of the male variation of four ethnic groups of Amerindian terrestrial and marine hunter-gatherers and Eskimos.
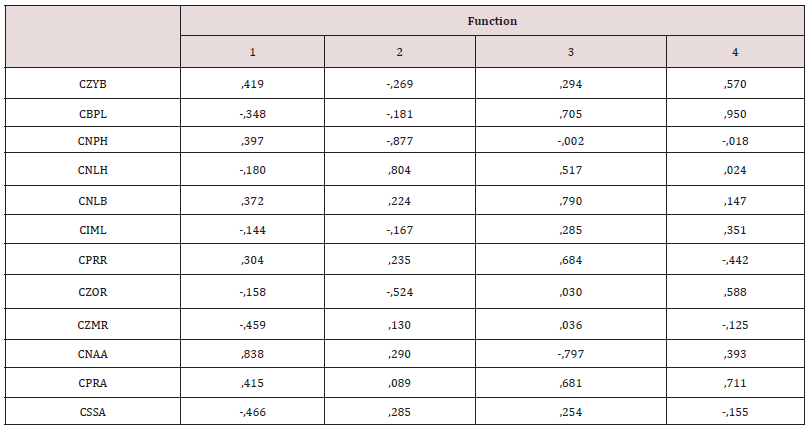
Figure 8: Ninety-five per cent confidence regions for the population scores of the first two canonical discriminant functions, explaining 98,8% of the variability. Santa Cruz Island (California) and Arikara (South Dakota) groups of both sexes.
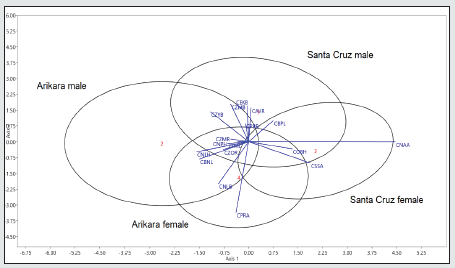
Figure 9: Variation of the skulls of marine hunters from California (Santa Cruz) and terrestrial hunters from South Dakota (Arikara) combining the cranial size (PENSIZE) to the facial variation (CNAA, CSSA).
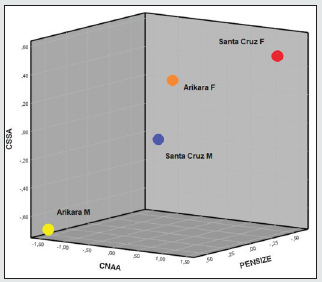
Figure 10: Male variation of five ethnic groups of American terrestrial and marine hunter-gatherers are represented. Ninety- five per cent confidence regions for the population scores of the first two canonical discriminant functions, explaining 81,1% of the variability.
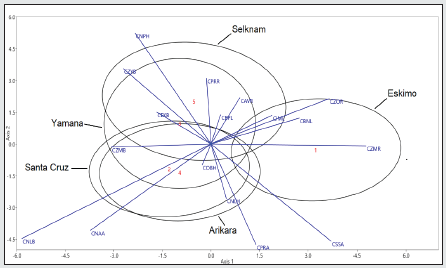
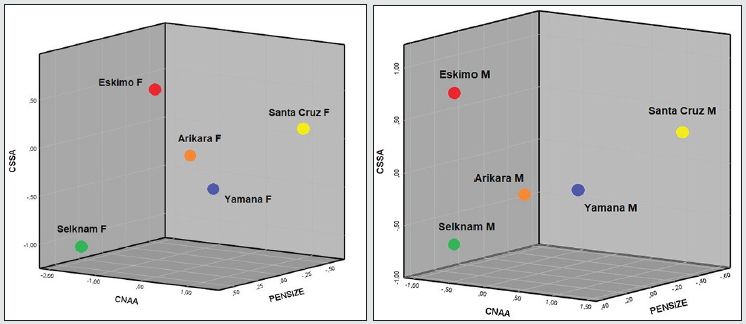
The Inuit are separated from the others in the first function because of the extreme values of facial projection (CMR and CZOR) and subnasal prognathism (CSSA) in both sexes, along an absence of alveolar prognathism (CSSA). Howells [25:149] describes it as the forward prominence of the whole facial mask, especially the orbital margin, combined with flatness across the whole nasal region, especially the nasal bones. On the other hand, the confidence regions of the Amerindians overlap and are differentiated from the Inuit because of the alveolar prognathism (CNAA) and the width of the nose (CNLB) since the nasal bone of the Inuit is extremely narrow, as are the nasalia [26:14). The Fueguian males (Yamana and Selknam) are separated from the other two Amerindian sets due to the second discriminant function (30.3% of the total variation). The variables with most weight are height of the face (CNPH, -0.877), height of the nose (CNLH, 0.804), which have a high level of collinearity, along with CZOR (-0.524) in men (Table 5); and CBNL (-1.223), CBPL (-1.182) and CPRA (-1.223) in women (Table 6). In other words, the Selknam have a proportionally higher and broader face than the other Amerindians. Furthermore, the second function separates the male sets because of the height of the face (CNPH) and of the nose (CNLH), along with forward prominence of the face (CZOR) (Table 5). On the other hand, the confidence regions of the Fueguian women are concentrated in the center of the axis of both discriminant functions (Figure 11), far away from the “facial mask” of Inuit women. There is less intragroup variation in women than there is amongst men (Figures 10 and 11). At the same time, the Selknam women are separated from the other women because of the second discriminating function. However, the confidence regions of the Yamana and Selknam tend to overlap. When the two variables of prognathism are combined (CSSA, CNAA) with cranial size (PENSIZE) in the canoeists of Santa Cruz, they are distinguished from the others in both sexes by high values of alveolar prognathism (CNAA). This is also the case with the Inuit in terms of subnasal prognathism (CSSA). The Arikara women show a higher subnasal prognathism (CSSA) than the Yamana women, but the Arikara ethnic group has much less alveolar prognathism (CNNA) than the Yamana ethnic group. Finally, one notable feature is that cranial size (PENSIZE) is large amongst the Inuit and Selknam in both sexes, and small in the ethnic group of Santa Cruz Island (California) (Table 7, Figure 12).
Table 6: Standardized coefficients of the four canonical discriminant functions explaining 100% of the female variation of four ethnic groups of Amerindian terrestrial and marine hunter-gatherers and Eskimos.

Table 7: C-Scores of prognathism (CNAA, CSSA) and skull size (PENSIZE), by sex, represented in Figure 12.
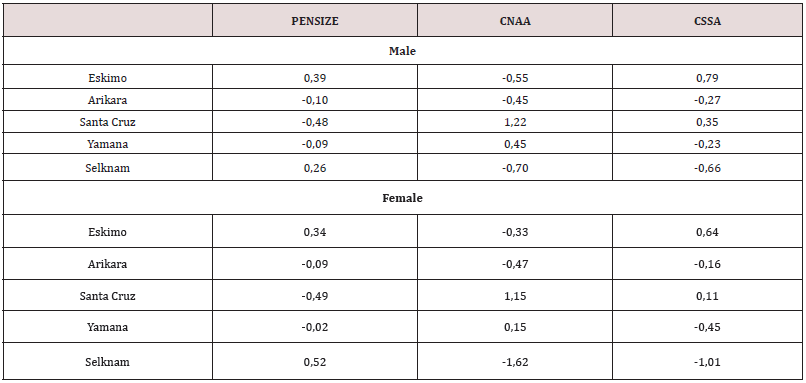
Figure 11: Female variation of five ethnic groups of American terrestrial and marine hunter-gatherers are represented Ninety- five per cent confidence regions for the population scores of the first two canonical discriminant functions, explaining 85,3% of the variability.
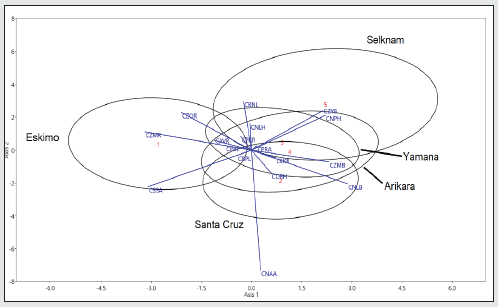
Figure 12: Distribution of C-Scores, by sex, of prognathism (CNAA, CSSA) and cranial size (PENSIZE).
Discussion
Epigenetic changes and cranial plasticity
An individual’s biological tissues undergo changes that start in the embryonic phase and continue during bodily growth. After the basic germ layers are formed (endoderm, mesoderm, ectoderm and neural crest), the expression of homeobox genes such as Hox, Pax and Dlx operate to determine the position and identity of the basic parts of the body. Gene expression has an influence on the size of particular regions or the types of receptors that they contain, thus changing the responses to growth inducers such as hormones [30]. Such changes, which are more visible during an individual’s growth, can affect a large number of organs. The bone structure in turn does not grow in isolation but rather interacts with the muscles and other tissues, meaning that the system as a whole is affected by epigenetic effects and physical activity. A classic example is the Neolithic population of Nubia (Egypt), whose crania were studied in sets that varied from each other by about 5,000 years (3,400- 1,200 BCE to 0-1,500 CE). According to the masticatory-functional hypothesis proposed by Carlson and Van Gerven [31], after a long debate with other authors who believed in the diffusionist hypothesis, it was finally accepted that mastication of foodstuffs that are generally softer led to a reduction of the mechanical load of the craniofacial skeleton. General cranial size in this population increased by approximately 6-9%, while some other facial dimensions decreased by up to 21%, leading to less robustness and a shorter masseter muscle insertion in both zygomatic arches on each side of the face. This process has also been recorded in other populations [30:276].
In short, the cranium undergoes changes in size and shape caused by epigenetic actions and biomechanical forces. There are other factors that can lead to facial changes, such as paramasticatory activities, or gene flow between populations. Although the samples studied here are not Neolithic and presumably exercised a great deal of force with their teeth throughout their lives, the Nubian example can act as a guide for the variations in the results of this study, in particular where prognathism is concerned. Subnasal prognathism is caused to a great extent by physical masticatory or paramasticatory activity, given that the sets of male and female crania from anywhere in the world are subnasally flat, except for Bushmen and Europeans [25:137-138]. European orthognathy is generally retracted and there is a small face [26:13], since they are descendants of Neolithic populations who experienced the change to a soft diet thousands of years ago.The populations of this article are pre-Neolithic and therefore the differences are not expected to be so marked as in those who experienced an evolution to the Neolithic phase. However, the facial differences that are mentioned below have been generated by the factors considered previously in this paper.
The Amerindian Craniofacial Variation
What is notable in the first axis of the ethnic groups of Tierra del Fuego is the prognathism (CNAA, CPRA) (Figure 3). The forward projection of the face towards the masticatory muscles can be seen in the second axis (CZYB), CNAA, CIML); the external ones (CZYB) inserted in the zygomatic arches and the internal ones of the mandibular ramus (CIML). The angles of the facial triangle (nasion and prosthion) (Table 2, Figure 2), rather than absolute measures, have the highest loadings in the functions. It is classic prognathism, or relative projection of alveolar region and dentition as a whole, the latter being registered by the radius to the first molar alveolus. However, subnasal flatness (CSSA) also plays a part in the differences in Tierra del Fuego, although the loading is lesser (Figure 3). The facial triangle is independent of subnasal flatness. They are on a different plane, and the coefficient of correlation between the prosthion angle (PRA) and zygomaxillary angle (SSA) is negligible (r = 0.18) in our samples when subnasal flatness is measured. This includes all the cases of both ethnic groups from Tierra del Fuego, and further reinforces the idea that both prognathisms depend on biomechanical activity. The women are more prognathous than the men; and Yamana men are more prognathous than Selknam males. There is an evident sexual division of work associated with stresses from masticatory or paramasticatory forces whose origins are mentioned in a previous section. Yamana women have much more subnasal prognathism than Selknam females (Figures 3 and 7).
The confidence regions of all the analyses shown here do not even indirectly reflect cranial size. The C-Scores with 0 value indicate the average of the variation; and the ends of one or the other side are more opposite each other. As mentioned above, Yamana women are more prognathous while the reverse is the case in Selknam men (Figures 3 and 7). Such differences may well be due to functional activities, since the fact that the women of the same ethnic group are more prognathous than the men cannot be attributed to genetic inheritance. On the other hand, the influence of physical activity can also be seen in some individual cases with extreme variations that influenced parametric normality, such as the scenarios of Tierra del Fuego and North America (Figures 3 and 8), even though the normality does not significantly deviate, as shown in Friedman’s non-parametric tests and the M of Box. Given that the confidence regions overlap in the center of Figure 3, it cannot be deduced that the greater level of prognathism is caused by marine adaptation, but rather by functional activities. The Selknam were basically hunters of a variety of camelids called guanacos, although at some point in their history they exploited coastal resources [4]. As regards the analysis of the ethnic groups of canoeists of Santa Cruz Island (California) and the Arikara (South Dakota) terrestrial hunters (Figure 8), twice the number of variables is needed to explain the same percentage of variation as in the Fueguians. This would indicate that there is greater facial heterogeneity than in Tierra del Fuego, the cause of which could be the South Dakota set [see 15:264], which was affected by a biological discontinuity in the Central Plains populations (c. CE 900-1400); in this respect, some craniofacial changes are documented, including an increase in facial height [15:384-385]. In the results shown here, the facial height (CNPH) is represented in the three discriminant functions (Table 4). The set of Amerindian men and women tend to group together if an outsider (Inuit) is included, which is more a reflection of their evolutionary history than any adaptation to the environment from physical activity. However, the comparison of ellipses between sexes shows that the variability of Amerindian women overlaps but that of men does not (Figures 10 and 11). The most likely explanation is biomechanical functional parallelism caused by gender divisions of labor. As regards the ‘Inuit mask’, Howells [26:14-15] stated that the prosthion and subspinale radii are distinctly low, in accordance with the general facial flatness combined with forwardness. The zygomaxillary angle (SSA) of the Inuit is one of the largest in current human variation (men 155.55; women 135.24), and is only exceeded by the Siberian Buryats [26:157]. This morphology, together with a narrow nose, has been proposed as a model for adapting to cold and to intense biomechanical activity.
However, when the Inuit morphology is compared to the Amerindian sets, especially the ones from Tierra del Fuego the results do not match at all. The findings of a previous article [18] suggested that there are no homoplastic masticatory effects with regard to the cranial structure for the Fuego-Patagonian ethnicities. In Fueguians, there are obviously clear marks of the muscular insertions in the neurocranium and in some muscles of the face. However, the cranial parallelism between Eskimos and Fuegians as a structural skeletal response to highly demanding masticatory regimes or to climatic adaptation [15:266] is not confirmed by our data. The hypothesis that ethnic groups adapted to cold climates in one or the other hemisphere have a narrow nose or similar structure is not borne out in the results shown here. The discriminant loadings of the nasal structure vary according to the analysis scenarios used in this study. The loadings of the variables of nasal height and width in Fueguians (CNLH, CNLB) are mean (data not shown), while the nose width (CNLB) amongst the canoeists of California and the terrestrial hunters of South Dakota only appears at a low value (Table 4). The loadings of the American set of both nasal dimensions are moderate, due to their collinearity with facial height (CNPH) and width (CZYB, CZMB) (Tables 5 and 6). The most interesting point is that the values of the nasal dimensions of the Fueguians and the other Amerindians are opposite to the Inuit’s in both sexes (Figures 10 and 11).
Conclusion
Considering that the size factor was eliminated in these analyses, the conclusion is that the women in the Fueguian set are more prognathous than the men, particularly the Yamana, both from the side (CNAA, CPRA) and in a frontal view (CSSA) (Figure 2). The Selknam men show diversity in prognathism (Figures 5 and 6), which may be attributed to functional activities. Given that the degree of prognathism is similar, the confidence regions do not provide sufficient evidence to assert that the greater degree of prognathism is caused by marine or land adaptation in Fueguians. The combined analysis in both sexes of the populations of the canoeists of Santa Cruz Island (California) (Figure 8) and the Arikara terrestrial hunters (South Dakota) shows a result that is very similar to the one found in Tierra del Fuego. The canoeists of Santa Cruz Island (California) have a small cranium and are the most prognathous of all the Amerindians. In the combined group of the American continent, the sets of one or another sex tended to come together when an outgroup was introduced (Inuit), which shows that a common evolutionary history of these Amerindians is a more relevant factor than their respective functional adaptations to different ecosystems. At the same time, the overlap of three of the four female confidence regions in Figure 11, related to CNAA and partially shared with Inuit women, shows alveolar prognathism to be a differential factor when compared to males, the most remarkable case of this being the women canoeists of Santa Cruz. Comparison of the confidence regions between sexes shows that the variability of Amerindian women overlaps in a different way to men. A likely explanation for this is a biomechanical functional parallelism caused by gender division of labor. There is no support for the hypothesis that ethnic groups adapted to a cold climate in either hemisphere have a narrow or similarly shaped nose.
Acknowledgements
We thank Assumpció Vila (Spanish National Research Council) for inviting me to participate in the projects in the Spanish- Argentine projects in Tierra del Fuego. Special thanks A Pujol and M Alcina for their help in preliminary analyses. The author would like to thank all the persons that have collaborated and assisted in obtaining the information and constructing the Fueguian data base.
Disclosure statement
The author reports no conflict of interest
Funding
This work was supported in part by grants from Spanish- Argentinean CSIC-CONICET 1988-1994 and the European Union (CEE: CI1-CT93-0015 ALAMED).
References
- Waters MR (2019) Late Pleistocene exploration and settlement of the Americans by modern humans. Science 365(138): 5447.
- Waters MR, Stafford TW (2014) The First Americans: a Review of the Evidence for the Late-Pleistocene Peopling of the Americas. Paleoamerican Odyssey K Graf, C Ketron, M Waters (Eds.). Texas A&M University Press, USA.
- Achilli A, Perego UA, Brav CM, Coble MD, Kong Q, et al (2008) The Phylogeny of the Four Pan-American MtDNA Haplogroups: Implications for Evolutionary and Disease Studies. PLoS One 3(3): e1764.
- Gusinde M (1982) [1931] Los indios de Tierra del Fuego. I (1 and 2). Los Selk’nam. Buenos Aires. Centro Argentino de Etnología Americana.
- Gusinde M (1986) [1937] (1 and 2) Los indios de Tierra del Fuego. II Yá Buenos Aires: Centro Argentino de Etnología Americana.
- Gusinde M (1989) [1937] Los indios de Tierra del Fuego. IV (1 and 2). Antropología Fí Buenos Aires. Centro Argentino de Etnología Americana.
- Gusinde M (1991) [1974] Los indios de Tierra del Fuego. III (1 and 2). Los Halakwulup. Buenos Aires. Centro Argentino de Etnología Americana.
- Hammel HT (1960) Response to cold by the Alacaluf Indians: A first report on a 1959 Expedition. Current Anthropology 1: 146.
- Hammel HT (1964) Terrestrial animals in cold: Recent studies of primitive man. Dill D B, Adolph E F, Wilber CG (Ed.) Adaptation to the environment. Handbook of physiology, section 4: 413-434. American Physical Society, Washington DC, USA.
- Lalueza C, Perez Perez A, Prats E, Cornudella L, Turbon D (1997) Lack of founding Amerindian mitochondrial DNA lineages in extinct Aborigines from Tierra del Fuego-Patagonia. Human Molecular Genetics 6(1): 41-46.
- García Bour J, Pérez Pérez A, Alvarez S, Fernández E, López Parra AM, et al (2004) Early population differentiation in extinct Aborigines from Tierra del Fuego-Patagonia: Ancient Mt-DNA sequences and Y-chromosome STR characterization. American Journal of Physical Anthropology 123(4): 361-370.
- García F, Moraga M, Vera S, Henríquez H, Llop E, et al (2004) Origin and microdifferentiation of the human population of the Chiloé Revista Chilena de Historia Natural 77: 539-546.
- De la Fuente C, Galimany J, Kemp BM, Judd K, Reyes O, et al (2015) Ancient marine hunter-gatherers from Patagonia and Tierra Del Fuego: diversity and differentiation using uniparentally inherited genetic markers. American Journal of Physical Anthropology 158(4): 719-729.
- Nakatsuka N, Luisi P J, Motti JM, Salemme M, Santiago F, et al (2020) Ancient genomes in South Patagonia reveal population movements associated with technological shifts and geography. Nature Communications 11(1): 3868-3878.
- Larsen CS (2015) Bioarchaeology. Interpreting Behavior from the Human Skeleton. Second Edition. Cambridge University Press.
- Cocilovo JA, Varela HH, O Brien TG (2011) Effects of Artificial Deformation on Cranial Morphogenesis in the South-Central Andes. International Journal of Osteoarchaeology 21(3): 300-312.
- Alfonso‐Durruty MP, Giles BT, Misarti N, San Roman M, Morello F (2015) Antiquity and geographic distribution of cranial modification among the prehistoric groups of Fuego‐Patagonia, Chile. American Journal Physical Anthropology 158(4): 607-623.
- Turbón D, Arenas C, Cuadras CM (2017) Fueguian crania and the circum-pacific rim variation. American Journal of Physical Anthropology 163(2): 295-316.
- Lucea A, Salicrú M, Turbón D (2018) Quantitative Discrimination of Deformation in Fueguian crania. American Journal of Human Biology 30(6): e23185.
- Walker PL (2008) Sexing skulls using discriminant function analysis of visually assessed traits. American Journal of Physical Anthropology 136(1): 39-50.
- South American Missionary Magazine (1867-1919): http://www.britishonlinearchives.co.uk/group.php?pid=72009-mag. London. Between Alacaluf and North Selknam on one side (T Bridges 1876:60, 1881:156, 1882:225; J Lawrence 1887:174, 1896:128); and Yamana and South Selknam (T. Bridges 1881:226, 1883:139, 1886:33; J. Lawrence 1887:77-78) on the other.
- Mahalanobis PC (1936) On the Generalized Distance in Statistics. Proceedings of the National Academy of Sciences, India, 2(1): 49–55.
- Penrose LS (1952) Distance, size and shape. Annals of Eugenics 17(1): 337-343.
- Corruccini RS (1973) Size and shape in similarity coefficients based on metric characters. American Journal of Physical Anthropology 38(3): 743-754.
- Howells WW (1973) Cranial Variation in Man. Papers of the Peabody Museum. A Study by Multivariate Analysis of Patterns of Differences Among Recent Human Populations. Papers of the Peabody Museum of Archaeology and Ethnology.
- Howells WW (1989) Skull Shapes and the Map. Craniometric Analyses in the Dispersion of Modern Homo. Papers of the Peabody Museum of Archaeology and Ethnology.
- Howells WW (1996) Howells’ Craniometric Data on the Internet. American Journal of Physical Anthropology 101(3): 441-442.
- Anton S (1989) Intentional cranial vault deformation and induced changes of the cranial base and face. American Journal Physical Anthropology 79(2): 253-267.
- Hammer Ø, Harper DA, Ryan PD (2001) PAST: Palaeontological statistics software package for education and data analysis. Palaeontologia Electronica 4(1):1- 9.
- Lieberman DE (2011) The Evolution of the Human Head. The Belknap Press of Harvard University Press Cambridge MA, USA.
- Carlson DD, Van Gerven DP (1979) Diffusion, Biological Determinism, and Biocultural Adaptation in the Nubian Corridor. American Journal of Physical Anthropology 81(3): 561-580.

Top Editors
-

Mark E Smith
Bio chemistry
University of Texas Medical Branch, USA -

Lawrence A Presley
Department of Criminal Justice
Liberty University, USA -

Thomas W Miller
Department of Psychiatry
University of Kentucky, USA -

Gjumrakch Aliev
Department of Medicine
Gally International Biomedical Research & Consulting LLC, USA -

Christopher Bryant
Department of Urbanisation and Agricultural
Montreal university, USA -

Robert William Frare
Oral & Maxillofacial Pathology
New York University, USA -

Rudolph Modesto Navari
Gastroenterology and Hepatology
University of Alabama, UK -

Andrew Hague
Department of Medicine
Universities of Bradford, UK -

George Gregory Buttigieg
Maltese College of Obstetrics and Gynaecology, Europe -

Chen-Hsiung Yeh
Oncology
Circulogene Theranostics, England -
.png)
Emilio Bucio-Carrillo
Radiation Chemistry
National University of Mexico, USA -
.jpg)
Casey J Grenier
Analytical Chemistry
Wentworth Institute of Technology, USA -
Hany Atalah
Minimally Invasive Surgery
Mercer University school of Medicine, USA -

Abu-Hussein Muhamad
Pediatric Dentistry
University of Athens , Greece

The annual scholar awards from Lupine Publishers honor a selected number Read More...


