Lupine Publishers Group
Lupine Publishers
Menu
Research Article 
Evaluation of Physicochemical Characteristics and Change in Concentration of Toxic Elements in Groundwater Collected from Different Sites of 2nd Aquifer of Coal Mining Area and Water Reservoir by Applying Multivariate Techniques Volume 1 - Issue 2
Asif Ali Unar, Tasneem G Kazi1*, Shahabuddin Memon1
- 1National Centre of Excellence in Analytical Chemistry, University of Sindh, Jamshoro, Pakistan
- 2Department of Aquaculture, Nigerian Institute for Oceanography and Marine Research, Victoria Island, Lagos
Received: July 07, 2023 Published: March 12-2024
Corresponding author: Tasneem G Kazi, 1National Centre of Excellence in Analytical Chemistry, University of Sindh, Jamshoro, Pakistan
Abstract
For energy production activity the ground water of 2nd aquifer (AQ2) of block 2 of Thar coal field is drained out in a reservoir/ Goran dam. The ground water samples of 2nd aquifer (AQ2) of Thar coalfield were collected from the depth of 100-120 mand further sampling of water was carried out from drain outlet (DW) from the reservoir. Simultaneously the sediment samples were also collected from the same sites of the reservoir and analyzed for toxic elements. The large datasets of water quality of AQ2, DW and four sampling sites at different spots of reservoir were collected during 2019. The all-water samples were analyzed for physicochemical parameters, cations and anions. The resulted data of cations (sodium, potassium, calcium, magnesium, cadmium, lead, total arsenic and iron), anions (chloride, fluoride, nitrate, sulphate and bicarbonate) and physicochemical parameters were described in terms of basic statistical parameters, PCA and CA. The chemical correlations among different parameters were observed by PCA, which was employed to categorize the water samples by CA. The positive correlation of fluoride and total arsenic with sodium and bicarbonate indicated that the GW (AQ2), DW and water samples of reservoir with high conductivity and salinity stabilized the toxic elements in the water samples of different origin. Results showed that all collected water samples have high values of sodium absorption ratio. The water quality assessment indicates that the high levels of physicochemical parameters and toxic elements in both ground and reservoir water make it unsuitable for drinking, domestic and agricultural purposes.
Keywords: Aquifer ground water; coal mining; reservoir; drain outlet; toxic elements; multivariate technique
Introduction
The maximum content of lignite coal is originated in district Tharparkar, Sindh, Pakistan. At the present time different national and international agencies are working on power plants [Ali et al. 2015; Imran et al. 2014] [1,2]. In ground water of mining areas, numbers of pollutants such as organic and inorganic minerals are dissolved in water and there by adversely distressing its quality and utility [Singh et al. 2012; Kurwadkar, 2019] [3,4]. In adding, water can liquefy lot of the chemicals from soil and rock. The refuse masses containing sulphides (pyrite) be able to rise the acid mine drainage problems in the environment. Departure of huge quantity of water through mining processes frequently causes considerable changes in its physico-chemical characteristics as well as regularly creates depression of groundwater in the region [Ali et al., 2015] [1].
The feature of groundwater based on different factors, which are generally resulting from the geological information of the mining area. Arsenic (As) in the water is a severe natural misfortune for living and non-livings, which instigate from geological and anthropogenic resources [Smedley et al., 2002; Anawar et al., 2003; Ayoob and Gupta, 2006; Rafique et al., 2009] [5,6,7,8]. Ground and surface water, soil and different foods are to be regard as main resources of different forms of Arsenic (As) [Tuzen et al., 2010] [9]. The consumption of contaminated water with Arsenic (As) in the different regions of the world is the main task for the scientists [Smedley et al., 2002; Baig et al., 2009a; Brahman et al., 2013; Farooqi et al., 2007] [5,10,11,12]. The As can be classified as inorganic arsenate (H2AsO4), arsenate (H2AsO3) and organic forms (methyl arsenic acid [CH3AsO (OH)2] and di-methyl arsenic acid [(CH3)2AsO (OH)]. Different researchers consider that As is a group I carcinogens and causes cancer of different organs such as skin lungs, bladder and different severe physiological disorders in human being [Morales et al., 2000; Yoshida et al., 2004; Kazi et al., 2009] [13, 14,15].
Generally, the organic As compounds are less toxic than inorganic (As compounds). For determining inorganic arsenic in water, very sensitive methods were developed [Marahel et al., 2011] [16]. Cadmium (Cd) is also a dangerous heavy metal to living beings, it can cause injures to the organs of living beings such as kidney, Lungs and Liver [Bernard, 2008; Satarug et al., 2011] [17, 18]. Intake of Cd for long time creates more problems for metabolism of calcium in the life system which initiates the damage of cell and its death [Chakraborty et al., 2013] [19]. The Cd is also discouraging the function of essential elements such as zinc assisted enzymes by exchange it. Due to advance in industrialization the atmosphere is highly contaminated with lead (Pb), which in turn causes contamination of water and air and other things. The lead has no beneficial effects for living beings and creates hazardous impact such as damage of brain, anemia, kidney disorder and hematological disorder [Shah et al., 2010] [20].
To analyze the metals and metalloids in environmental and biological samples numbers of techniques have been comprehensively used including: atomic absorption spectrometry [Detcheva and Grobecker, 2008] [21], inductively coupled plasma optical emission spectrometry [Zhu and Alexandratos, 2007] [22] and others. For coal mining purposes the elimination of water of aquifer system (ground water) might be expensive. The open cut withdrawal system needs the proficient lamination of overload and inter-burden stratum in order to access the coal seams. The dewatering of the surface mine is carried out by use of a pumping-out system via a borehole (entirely piercing the whole depth of the aquifer), then the water of aquifer of coal mining is forced out at a regular ejection rate to reduce the piezometric level of the ground water beneath the coal mining horizon at the pit boundary [Liang et al., 2017] [23].
The current study has been in connection with Thar coalfield, where the coal mining and power generation plant is developed by Sindh Engro Coal Mining Company. Initially the ground water of 2nd aquifer of block 2 of Thar coal field, had started releasing into a reservoir, locally called Goran dam, to diminish the amount of groundwater that lies underneath of the 2nd aquifer. This study was served during 2019 for determination of trace and toxic elements (As, Cd and Pb) and other parameters such as (pH, EC, TDS, salinity, Na+, K+, Ca2+, Mg2+, Cl-, SO42-, HCO3- , Fe3+, NO3-, and F-) in ground water (2nd aquifer of block-2) of coal mining area of Thar coal, drain out let of it and from four sites of reservoir at equal distance (500m). The sediment of four sites of reservoir/groan dam were analyzed for toxic elements. The accuracy of the methodologies was determined by simultaneously analyzed matrices matched certified sample of water.
The huge data set obtained was calculated effectively with multivariate techniques, Principal Component (PCA) and Cluster Analysis (CA) to estimate the information concerning the similarities / dissimilarities between the diverse sampling sites, to recognize the water quality variables. These methods have been used to assess the effectiveness of water quality monitoring networks of aquifer 2 and drain outlet in a reservoir, plans to increase the number of examining sites and select the basic parameters of water quality. Along these lines, it is conceivable to identify and evacuate sites of reservoir as well as repetitive parameters to reduce the economic cost of monitoring plan without sacrificing fluctuation in water quality data. The analytical precision for the estimations of cations and anions indicates by anions/cations balance error /ionic balance error, based on the concentration of all ions in meq/L. To verify the appropriateness of drained ground water of 2nd aquifer of coal mining area in a reservoir for irrigation purpose. In addition, the sodium absorption ratio of each site was also calculated.
Material and Methods
Study area
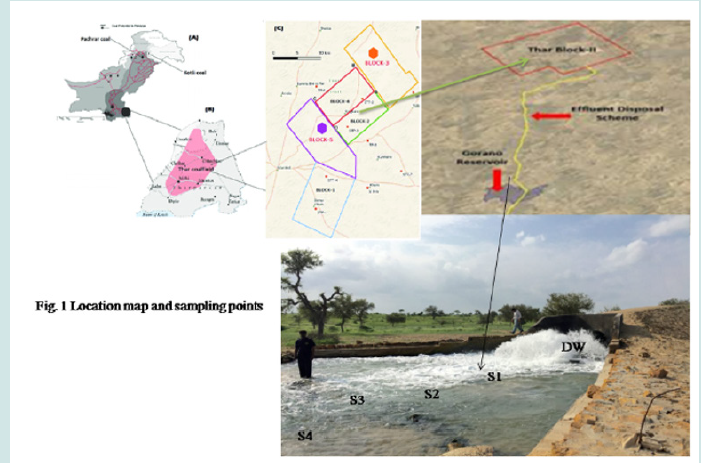
The huge reservoir of natural coal is present in district Tharparkar, Sindh, Pakistan, detail is reported in our previous work [Ali et al., 2017] [24]. Different power generation projects are carried out by different national and international agencies (Ali J et al. 2015; Imran et al. 2014). The discharge of the water of 2nd aquifer of block 2 at the depth of 120 m, in Goran reservoir, which is newly developed reservoir in 2017 spread in 1,500 acres. This site completely reserved for dewatering site of Thar coal mining field. The ground water discharge by a pipe which is 27 Km away from coal mine site. The Goran dam/reservoir is geographically located at the southern part of Pakistan. The water sampling was carried out from ground water of 2nd aquafer from 120 m, drain outlet and four sites of reservoir as mention in (Figure 1).
Chemical reagents and glassware
Ultrapure water which was used throughout procedure system was taken from ELGA lab water system (Bucks, UK). The acids and oxidizing reagents obtained from Merck (Darmstadt, Germany) of analytical grade. The standard solution of As, Cd, Pb and other cations were prepared from certified standard solution (1000 ppm) obtained from Fluka Kamika (Buchs, Switzerland) and made up to volume with. 0.1M HNO3. Before analysis all the glassware was kept in 5M HNO3 for 24 hours and then rinsed with deionized water.
Instrumentation
The pH meter (720-pH meter, Metrohm) was applied for the determination of pH, of water samples of different origin. Inductively coupled plasma optical emission spectroscopy (ICP-OES) The Thermos Scientific™ iCAP™ 7000 Series ICP-OES, anatomic absorption spectrometer Model 700, Perkin Elmer (Norwalk, CT, USA), equipped with hollow cathode lamps and air–acetylene burner has been used. For the physico-chemical parameters such as, electrical conductivity (EC), and total dissolved solids (TDS) by a conductometer (Ino Lab conduc. 720, Germany) was used.
Sampling and pretreatment
Samples of water were collected in summer of 2019 for two months, May and June. The groundwater was sampled directly from second aquifer with the legal permission and assistance of Sindh coal authority. The high-power compressor was operated for withdrawing groundwater of second aquifer as (AQ2). Then further sampling was carried out from the drain outlet of groundwater of second aquifer of block-2 in a Goran dam/reservoir. Then water samples were also collected from reservoir of four sites at equal distance of 500 m (length of dam is 2.0 km), with the help of water grab sampler(1.5Lcapacity), equipped with a simple pull-ring that allowed for sampling of water at surface and depths of 20 30cm,- from 10 to 20 spots of each sites (S1, S2, S3 and S4) at random and held in well stopper polyethylene plastic bottles, formerly washed with 10% nitric acid and rinsed with ultrapure water obtained from ELGA Lab water system. Then made 10 composite samples of water samples obtained for AQ2 and DW. Whereas water samples of four sampling sites was made five composite samples of each (surface and lower levels of same site). Then filtered through 0.45 microspore size membrane for the removal of suspended particular materials carefully and labeled.
Finally, samples of water were stored at 4°C in refrigerator before analysis. The sampling of sediment was carried out simultaneously with water from 5 to 7 spots of each site of reservoir (except AQ2 and DW sites) by means of an Ekman dredge which was designed as SD1, SD2, SD3 and SD4. The samples were kept tightly closed in polyethylene bags. At the same day the water and sediment samples were transported the laboratory. In laboratory sediment samples were dried in fuming cupboard under air stream for 24 h. Then crushed and passing through a sieve (200μm). For the preparation of sediment sample, triplicate of each sample (0.5g) were taken in crucibles and added 3.0 to 5.0 mL of mixture of nitric acid and hydrogen peroxide at 2:1 ratio. After 10 to 15 minutes the crucibles placed on hot plate at 70°C temperature for one h, for oxidation of the organic matrices. Then cooled the contents of crucible and added 10mL of 0.2M solution of nitric acid (HNO3). Finally, filtered the solution in sample bottles of 100 mL in capacity using Whatman filter paper and subjected to instrument.
Analytical procedures
The analysis of water samples of different origin (AQ2, DW, S1, S2, S3 and S4) for different physic- chemical parameters was carried out in triplicate of each composite samples by standard methods (APH Association 2005; Organization WHO 2006; Jamshed et al., 2015). Initially 50 mL of each water sample was taken in 100 ml of beaker and with the help of pH-meter and conductometer, different physic-chemical parameters such as pH, TDS, EC and salinity were measured (Table 1S). The TDS was not measured in water samples directly due to its high value, and for that purposes each composite sample (n=10) was 10 times diluted with deionized water then conductometer was applied to measure TDS. An ion chromatograph was used for the estimation of anions levels in water samples of different origin using peak area of each with an error <2% (Brahman et al., 2013; Ali et al., 2015).
Table 1: The water quality parameters associated with their abbreviations, units and analytical method.
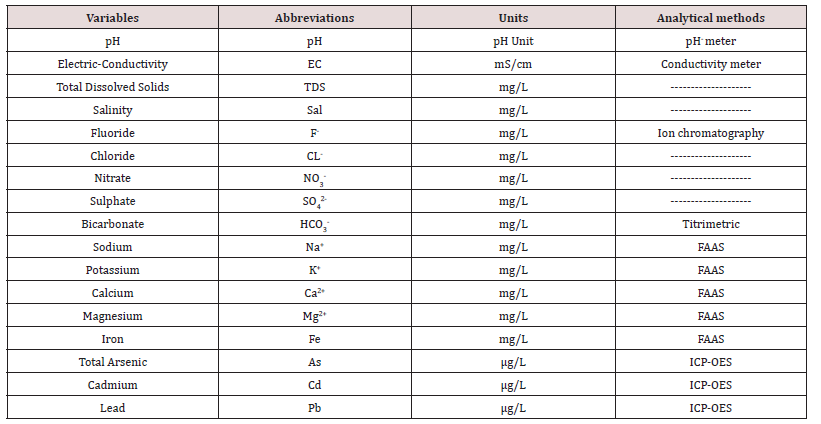
The other experimental steps were indicated in our previous work (Brahman et al., 2013), to determine the anions a mixed standard of each F-, Cl-, NO3 -, and SO4 2-was made at different concentration range (0.5-10 mgL-1) from certified stock standard solutions. The major cations, Ca2+, Na+, K+ and Mg2+ were analyzed in 20-time diluted water samples with ultrapure water using FAAS. Whereas iron was estimated by FAAS without dilution. The As, Cd and Pb were determined in the triplicate of each composite samples, which were diluted 2 times and subjected to inductively couple plasma optical emission spectrometer. For accuracy in determination of different cations in real water samples, a certified sample (SRM 1643e) of water was simultaneously analyzed (Kazi et al., 2009). The major cation Na+ is scientifically also termed as alkali hazard was estimated by the total and comparative levels of cations and stated as sodium absorption ratio (SAR). The method for calculating the SAR is also accounted in previous work (Brahman et al., 2013).
Statistical evaluation
To analyze the resulted data obtained by the analysis of huge number of real water samples, obtained from different origin were calculated using statistical computations with Excel 2003 (Microsoft Offices) and STATISTICA 6 (Stat Soft, Inc.’s). Multivariate statistical techniques for categorization, representations and elucidation of huge datasets from ecological checking plans, permit the diminution of the wideness of the data and drawing out the information to facilitate the evaluation of water quality (Liu et al., 2003; Kazi et al. 2009; Brahman et al., 2013) [25,15,11]. Basic statistics and correlation calculations were conducted in order to give preliminary information concerning the water quality data of six sites (AQ2, DW, S1, S2, S3 and S4).
Application of multivariate technique
Basic statistics was carried out in order to give initial information about the change of water quality of different origin (AQ2, DW, S1, S2, S3 and S4). The multivariate techniques, CA and PCA were applied to evaluate the quality of water samples at different origin (Kazi et al. 2009, Arain et al., 2014 Brahman et al., 2013) [15,26,11]. The CA Involves in calculating either distance or the resemblance among resulted data to come mutually. In this technique the clusters are based on the similarity of the data among different groups. The technique is based on the normalized data set (replicate average values of observations of all water samples of different origin) using Ward’s method with squared Euclidean distances (Arain et al. 2014; Sarbu and Pop 2005) [26,27]. The both multivariate techniques were applied on the resulted data of eighteen thousand, three hundred sixty values (17 factors) determined in ten composite samples in triplicate of each origin such as6 sampling sites in twice (sampling in two month) and analysis in triplicate (17×6×30×2×3=18360).
Analytical figure of merit
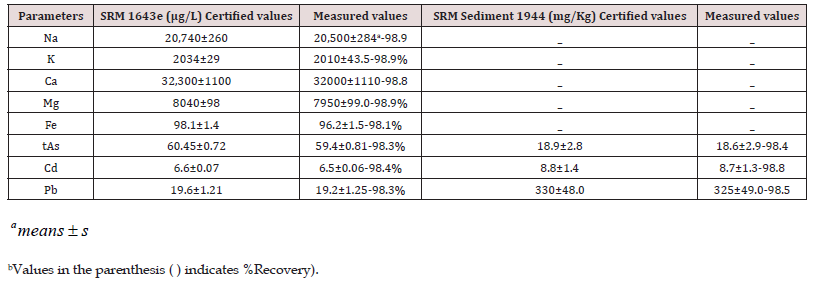
The calibration of standards was prepared for Na, K, Ca, Mg, Fe, As, Cd and Pb at required concentration range, using FAAS and ICP-OES. The limits of detection (LOD) of all selected elements were estimated according to LOD=x s/m = where “s” is the standard deviation of 10 determinations of the blank and “m” is the slope of the calibration graph attained, the LODs as 5.52, 14.0, 164.3, 2.46, 69.2, mg/L for Na, K, Ca, Mg and Fe, respectively. The calibration graphs of As, Cd and Pb were prepared from the limit of quantification up to 20μg/L using ICP-OES. The LOD were found as 0.02, 0.13 and 0.05μg/L, respectively. The precision of methods was carried out by analysis of matrices matched certified sample of water (SRM 1643e) and sediment (SRM 1944) as shown in (Table 1). The prominence of the analytical resulted data was maintained throughout with cautious standardization, measurement of procedural blanks and average resulted data obtained by triplicate analysis of each composite sample. For justification of the resulted data of cations and anions in water samples of each site (AQ2, DW, S1, S2, S3 and S4) were within the ±5%., the ionic balances were calculated by equation as revealed in our earlier work (Kazi et al., 2009; Arain et al., 2014), was observed as ±5%.
Results and Discussion
The mean values with standard deviation (n=30) of physic- chemical parameters of groundwater (AQ2), drain outlet and four sites of reservoir (Goran dam) are given in (Table 2). To estimate the correlations using Pearson correlation coefficients (r) among the data of variables, were estimated. The obtained resulted values of different variables/parameters of all collected water samples of different origin, groundwater samples (AQ2), drain outlet (DW) and from different four sites of reservoir (S1, S2, S3 and S4) were extensively deviate from the recommended standard values of WHO, for drinking water. However, the values of pH and SO4 2- in all water samples except ground water of AQ2 are in agreement with recommended standards of WHO for drinking water. The pH of AQ2, DW, S1, S2, S3 and S4 was found in the range of 7.75-8.5, 7.6-7.92, 7.5-7.75, 7.2-7.64, 7.0-7.4and 6.7-7.2respectively, which are consisted with WHO regulated levels. However, it is slightly alkaline in nature, which is attributable to the concentration of HCO3 ion, which is relatively high in all sites of reservoir, range das 249 to 397mgL-1. However, the pH values of water samples of reservoir were diminished with the distance. The reduction in pH values is taking placed owing to the decline in dissolved minerals (Tripathy 2002).
Table 3: The physicochemical parameters, cation and anions concentration in ground water of aquifer AQ2, drain out let (DW) and sampling sites (S1, S2, S3 and S4) of Groan reservoir.
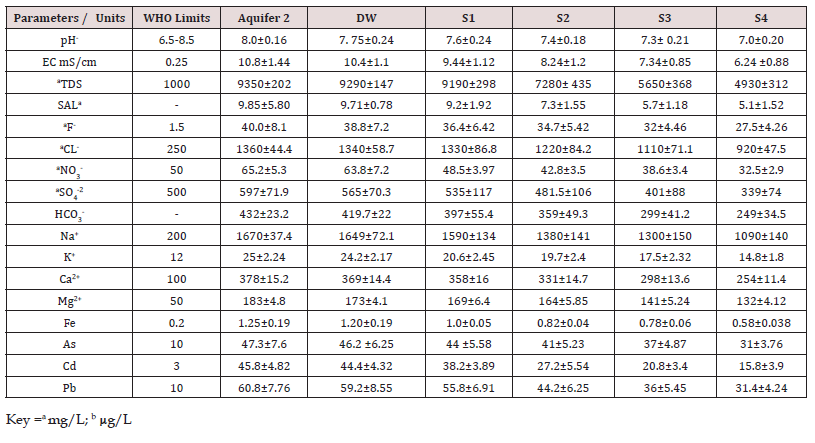
The mean values with standard deviation of TDS and EC of water samples of different origin, AQ2, DW, S1, S2, S3 and S4 were given in (Table 2). The TDS values in Aq2, DW, S1, S2, S3 and S4 were found in the range of 8940- 9710, 8680-9440, 8680-9240, 6980-7840, 5280-5870, 4650- 5210 mg/L, respectively. The EC were found in the range of 9.8-11.5, 9.46-11.0, 8.86-10.5, 7.68-9.54, 6.75-8.12, 5.89-7.45mS/cm, respectively. The total dissolved and electrical conductivity enhanced up to five times than WHO suggested allowable limit for drinking water (Table 3), which may be owing to the elevated salinity and mineral substances in the selected groundwater of 2nd aquifer (AQ2) of coal mining area (Block 2) , drained water at initial and different distance of reservoir (S1, S2, S3 and S4, corresponding to average 500 m among each site), these data are consisted with literature reported study (Brahman et al., 2014; Nag and Saha 2014) [28,29].
It was observed that the EC of initial drained water (DW) have higher values than four sites, decreasing from (6.34 to 37.7% in S1 to S4). The total dissolved salts at S4 were about 47% reduced than initial values of DW samples. The EC of groundwater (AQ2) samples was found as24 to 40 time elevated than WHO guidelines for drinking water (Table 2). It was observed that the changes in EC is directly proportional to TDS values. The values of Na+ were observed in the range of 1610-1720,1588-1703, 1210-2000, 1117-1847, 1016-1680, and859-1420 mg/L for AQ2, DW, S1, S2, S3 and S4, whereas the levels of K+ were observed in the range of 21.9−28.2, 20.1-25.5, 17-22, 15-21, 14-19 and 12-16 mg/ L, respectively. The levels of Ca2+ were observed in the range of 345-410, 333-391, 339- 382, 313-353, 282-318and 241-271mg/L. It was detected that the groundwater samples (AQ2) and DW have elevated concentrations of Na+, which indicates that either due to the solubilization of lithogenic Na+ or swap over the soluble Ca2+ with Na+ via minerals origin in clay of coal mining area (block 2). Guo and Wang, 2007 et al., have also supported the hypo thesis that due to high ratio of Na+/ Ca2+(4.42), demonstrate the ion substitute amongst Na+ on the shell of clay minerals and elevated levels of Ca2+ in the groundwater.
The values of Mg2+ were observed in the range of 176-190, 164- 169, 159-207, 146-190, 134-174 and 118-153 mg/L in AQ2, DW, S1, S2, S3, S4, and the levels of Fe were found in the range of 0.85-1.7, 0.81-1.6, 0.78-1.3, 0.75-1.0, 0.1-0.2 and 0.45-0.82 mg/L, respectively. The levels of Fe were 3 to 5 folds higher in water samples of AQ2, whereas at S4, the concentration of Fe was reduced but still higher than the recommended levels of it (0.3mg/L). Whereas, the value of F− and Cl− were observed in the range of (31.4-52, 30-50.2, 24- 44, 22-40, 20-38, 17-31) and (1304t1519, 1240 1501, 1140-1639, 1053 -1514, 961-1382, 809-1164) mg/L, respectively in AQ2, DW, S1, S2, S3 and S4. The concentrations of NO3 - were observed to be elevated than acceptable limit of WHO for water used for drinking purposes especially for children, while the levels of SO4 2- in water samples of all origin was inside the permissible limit (Table 2). The levels of HCO3 - were found in the range of 411-494, 399-483, 300- 480, 271-434, 226-362 and 188-301 mg/L in AQ2, DW, S1, S2, S3 and S4, respectively.
The resulted values of toxic elements (tAs, Cd and Pb) in
groundwater of second aquifer of Thar coal mining area, its drain
outlet and four sampling sites of reservoir have high concentration. The obtained results indicate that ground water of AQ2, DW, S1, S2,
S3 and S4 is contaminated with high concentration of As, Cd and
Pb, which are higher than the suggested WHO limit for drinking
water (10 μgL-1). The total contents of As in AQ2 was found in the
range of 39.2 59.5 μg/L, whereas the drain water (discharge out
let) have As concentration slightly lower than AQ2, the difference
was not significant (p<0.05). The concentration of As in water samples
of reservoir at different sites (S1, S2, S3 and S4), was found
to be decreasing, observed in the range of 35-57, 32-53, 30-48
and 25.5-40.0 μg/L. The total Cd in water samples of 2nd aquifer of
Block 2 of coal mining area and drained water was observed in the
range of 35-58 μgL-1 and 34-51μgL-1, respectively, indicates insignificant
difference (p<0.05). The water samples of reservoir were
observed in the range of 33-44, 19-36, 16-25 and 11.5-20.4 μgL-1
for S1, S2, S3 and S4, respectively. The resulted data indicate two to
four folds higher levels of Cd in all water samples than allowable
limit for drinking purposes. The levels of Pb in AQ2, DW, S1, S2, S3
and S4 were found in the range of 51.4-74.6, 43.6-69.4, 54.5-56.4,
36.4-55.5, 28.6-49.5 and 22.4-35.2 μgL-1, respectively, these all values
were three to six folds higher than those values of water recommended
by WHO. The all-toxic elements were found in decreasing
order based on sequence of sampling sites as AQ2 ≤ DW On the basis of these results sodium adsorption ratio was calculated
for the selected water samples by the equation given below Where Na+, Ca2+, and Mg2+ indicates their respective concentrations
in milli-equivalents per liter. The exposure of Na+ is stated
as Sodium Absorption Ratio (SAR). The calculated SAR values
of groundwater of AQ2, DW, S1, S2,S3 and S4 based on minimum
to maximum values of each variables were observed in the range
of 19.2 -30.9, 18.9-30.6, 14.4-30.24, 13.3-29.6, 12.1-28.4 and 10.8-
25.6 with a mean value of 24.5, 22.3, 21.5, 20.3,18.2 and 14.7, respectively,
which designated the elevated levels of Na+ and lower
concentrations of Ca2+ in AQ2 and other collected water samples,
designated that the cation-exchange complex might be develop
into saturated with sodium. As the salinity values was higher, the
SAR index become also elevated, results into causes infiltration
problems in soil. As the study area have shortage of surface water
and if the water of reservoir for agricultural purpose, causes adverse
impacts on the crops due to excess of Na, can creates transitory
saturation of the surface soil. Whereas the high pH and enhanced
the potential effects on soil erosion, lack of oxygen and inadequate
availability of nutrient. It was reported by Van Vorst, 2003, that water
samples from the coal beds have high levels of Na and low in
calcium and magnesium, resulting in a high SAR value (Cannon et
al., 2007) [30]. Cluster analysis (CA) was also applied for qualitatively analyze
the differences and similarity among the water samples of ground
water of aquifer 2, drain outlets and at different sites of reservoir.
The statistical technique, cluster analysis of water samples obtained
from different origin was performed on all selected physic-chemical
variables (physio-chemical parameters and toxic elements), and
to evaluated the dissimilarity/similarity on the resulted data of all
variable in water samples of six sampling sites (Kazi et al., 2009)
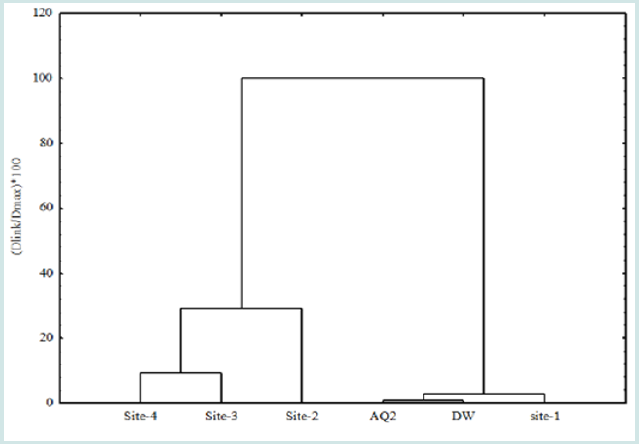
[15]. The dendrogram indicates the grouping of all six sampling
sites, based on resulted data of all variables, into two statistically
important clusters (Figure 2). The results of all physic chemical parameters
of water samples of all selected origin after their scaling
by z-transformation, to measures the % of similarity and for the
construction of a dendrogram have been determine (Chen et al.
2007) [31]. At similarity level of 100%, two clusters were formed
that is further divided into two groups: from the left, the first cluster
(cluster A) is composed of two groups, one comprises of site-3
and 4, whereas in second group, site-2 was involved. The second
cluster (B) on the right side is further divided in to two groups. One
comprised of AQ2 and DW (where no significant difference was
observed in levels of different toxic elements, cations, anions and
physic chemical parameters. Whereas the second group is involved
the sampling site (S1), that is located at 500-meter distance from
the drain outlet, where the levels of all physic- chemical data including
toxic elements were considerably decreased from AQ2 and DW,
though the dissimilarity was not significant (p> 0.05) (Figure 3). Figure 2: Dendrogram showing clustering of different sites based on physic-chemical and toxic elements The principal component analysis (PCA) is intended to change
the original data of variables into new, unassociated variables
(axes), designated as principal components (PCs), which are linear
arrangements of the original data of the variables. The novel affiliation
lies beside the paths of highest variance. The PCA provide
an objective way of finding manifestations of difference in the resulted
data be accomplished for description as probable summarizing
(Sarbu and Pop 2005) [27]. The spatial correlation matrix
of the water quality parameters is obtained by PCA. The PCA was
carried out on the resulted data set (17 parameters/variables) independently
for water samples of different origin (DW, AQ2, S1, S2,
S3 and S4), to regulate/ identify the compact set of variables that
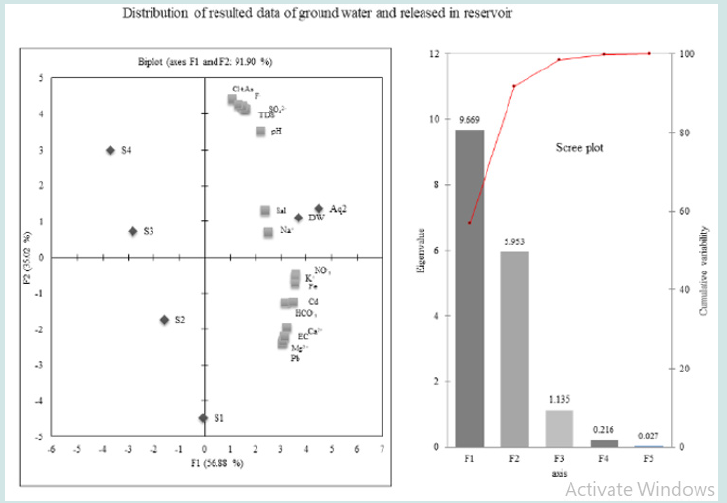
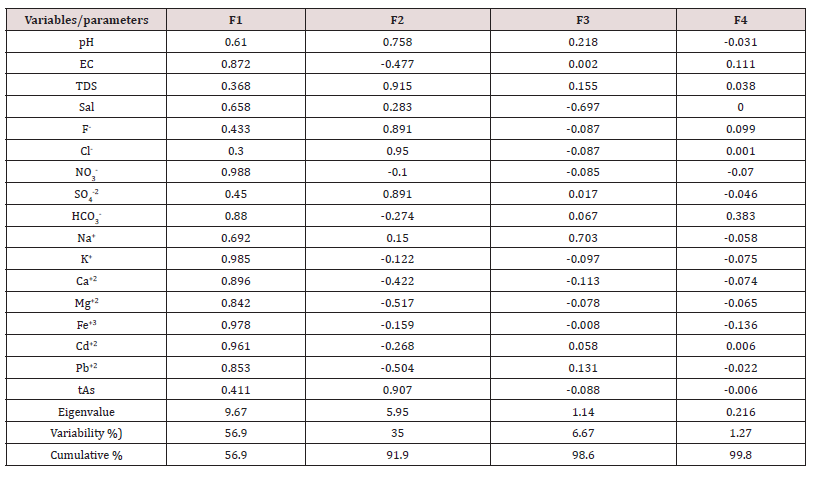
might be capture the variance of data set. The primary/first principal
component (PC1) indicated more than 56.88% of the whole
discrepancy of resulted data set of water samples obtained from
different origin is shown in (Table 3). The most important point of
view was the resulted data of all variables perform correspondingly,
such as elevated levels of cations and anions, and different toxic
elements in whole network of water sampling. The (Figure 2) indicates
high loading data for Cl-, tAs, F-, SO4
2-, TDS, PH, Na+ and Salinity
especially in AQ2 and DW. The positive loading in 2ndcomponent
was observed for, NO3, K, Fe, Cd, HCO3, Ca EC, Mg, and Pb in the second
factor, which is of 35.02% of the whole variance. The 3rd components
corresponding to 6.67% of variance was designated with
good loading of Na, which is confirmed with high values of salinity
in water samples of whole network. Table 4: Factor loadings Eigen values for physicochemical parameters, cations, anions and toxic elements of water samples of
different origin. The Pearson correlation among physicochemical factors of water
samples obtained from AQ2 collected from 2nd aquifer of coal
field, DW and four sites of reservoir, have equal distance are indicates
in (Table 2S). The water samples collected from AQ2 and other
sites, have good correlation/connection of physical parameters
among all anions and cations (p<0.05), which designated that all
the determined cations and anions are causative for enhanced values
of pH, EC, and TDS of groundwater (AQ2). The pH of groundwater
and reservoir water samples have positive correlation among all
anions and cations (p<0.05), except for HCO3- and Mg2+. This capacity
is might be due to the less accessibility of gypsum and carbonated
rocks (Brahman et al. 2013) [11]. The Pearson correlation between physic-chemical parameter,
anions, cations and toxic elements in groundwater of 2nd aquifer
(AQ2) of Thar coalfield, DW, and from four samples site of reservoir/
Goran dam are shown in Table2S The physical parameters of
AQ2 have good relationship with all anions and cations (p<0.05),
which showed that they all are contributing for the enhancement
values of pH, EC, and TDS of water samples The pH, TDS and EC,
and have absolutely high correlation (r>0.7 and p<0.05) with Cl-,
F-, SO4
2-, tAs, NO3-, HCO3
-, Ca2+, Mg2+, Fe, Cd and Pb for water samples obtained from AQ2, DW, S1, S2, S3 and S4 at 95% confidence
level, which may be due to the high solubilization of minerals corresponding
to those ions obtained from mining area. The EC and
TDS have positive correlation with K+ (p<0.05), whereas it has weak
connection with pH (p>0.1). Sodium has moderate correlation (r=
>4) with all variable except F- and tAs, whereas significant correlation
with salinity (p=0.01). The F- have moderate to significant
correlation with Cl-, SO4
2- Ca2+, tAs, pH, TDS and salinity (p= 0.08
to 0.01). The levels of F- and tA shave +ve association among each
other, though, these both elements are enriched in ground water
(AQ2) of coal mining area, its drain outlet and storage in a reservoir,
indicated that the involvement of both elements have general
source (Jamshed et al., 2017). A significant correlation between F- and Ca+ also indicates the
presence of minerals like fluorapatite, apatite, and fluorspar indicates
geological factors. These results indicates that the high contents
of As and fluoride in reservoir can be creates adverse impact
on the local population. In some areas of the world, groundwater
is polluted with As and F-, causes serious health disaster on living
beings (Milton et al., 2004) [32]. In addition, Pakistan and Inner
Mongolia also have same problem (Smedley et al., 2002, McCaffrey
and Willis, 2001; Ayoob et al., 2006; Rafique et al., 2009) [5,33,7,8]. The resulted data indicates that the F- have significantly high
correlation among pH (r = 0.920, p = 0.012), this might be owing
to the same size of ionic radii of F- and -OH, which often replaced
with each other. These results are consisted with reported studies
(Rafique et al., 2009; Vasquez et al., 2006) [8,34]. It was indicated
in literature that the clay minerals in mining area are capable to
hold F- ions on their surfaces, however at elevated pH, the OH ions
can dislocate the F- ions, which can easily release to groundwater
(Rafique et al., 2009; Sreedevi et al., 2006. Thus, the groundwater
samples of AQ2 were slightly alkaline which facilitate the dissolution
of F- (Saxena and Ahmed, 2003) [35]. This information designates
that the groundwater samples of 2nd aquifer (AQ2) of Thar
coalfield, DW, and from four samples site of reservoir/Goran dam
have elevated concentrations of F- and pH (7.2-7.8). The F- have
weak connection with HCO3
- (r = 0.170, p < 0.001). The high exposure of F- (>1.5 mg/L) creates adverse impact on
the humans especially dental and skeletal fluorosis, whereas elevated
intake of F- for long time might be causes impairment in muscles,
kidneys and nerves system (Ayoob and Gupta, 2006) [7].The dilemma
of fluorosis involving dental and skeletal system is frequent
occur in the areas of crystalline basement rocks, predominantly
those have composition granitic in nature in diverse areas of the
world (Martinez-Mier et al., 2016) [36].The people around the coal
mining area (Tharparkar, Sindh province of Pakistan)are rigorously
suffer from bone deformation, skeletaland dental fluorosis in human
as well as in cattle (Rafique et al., 2009; Kazi et al.,2018) [8,37]. The average concentration of the iron, sodium, potassium, arsenic,
cadmium and lead in the sediment samples collected from
four sites of reservoir (SD1, SD2, SD3 and SD4) for subsequent
two month, are shown in (Table 4). The resulted data based on dry
weight basis. It was observed that the concentrations of toxic elements
were inversely proportion to those values obtained from
corresponding water samples, might be due to settling of them with
distance of reservoir (2.0 km). The concentration of As was found
in the range of 6.7-11, 10.8-13.7, 17.3-20.8 and 22.7-28.6 in SD1,
SD2, SD3 and SD4, respectively. It was observed that the contents
of As was enhance three-folds of those value observed in first site
adjacent to drain outlet. The contents of Cd at SD1, SD2, SD3 and
SD4 were found in the range of 7.65 - 9.45, 10.5-12.8, 12.4-14.7 and
16.4-20.4 mg/kg, respectively. The concentration of Pb was found
in the ranges of (16.5-18.6) (30.5-33.9) (45.3-48.4) (53.6-55.7) in
SD1, SD2, SD3 and SD4 respectively. The Cd was enhanced from SD-
1To SD4 ≥ 2.0, whereas the Pb concentration increase up to 3 time.
The sediment serves as a reservoir or sink of the metal pollutants
in water reservoir However the concentration of all elements in
sediment was much higher than in water, which is consistent with
previous studies (An and Kampbell,2003; Anazawa et al., 2004)
[38,39,40,41]. It was observed that the discharge of groundwater of aquifer 2
of coal mining area due to construction of power plant, in a newly
prepared reservoir/Goran dam. The variation in physic-chemical
characteristics and toxic elements was determined. The resulted
data indicated that all parameters in water samples are sequentially
decreasing from AQ2 to S4. The multivariate technique, principal
component analysis helped in recognizing the causes responsible
for the variations in water quality from AQ2 to S4 are only geologic
in nature [42,43,44,45,46]. The cluster analysis grouped six sampling
sites into two clusters on the basis of similar characteristics
of water samples of different origin. It was observed that all selected
physic-chemical parameters, cations, anions, and toxic elements
were higher than the suggested limits by WHO. The high values of
sodium absorption ratio of water samples of reservoir indicates that they are not suitable for agricultural purposes. Further studies
should be focused on the bio-accumulation of As and F- in aquatic
biota and hazards associated with their consumption.Sodium absorption ratio (SAR)

Multivariate statistical analysis
Correlation among different variables
Sediment analysis
Conclusion
References

Top Editors
-

Mark E Smith
Bio chemistry
University of Texas Medical Branch, USA -

Lawrence A Presley
Department of Criminal Justice
Liberty University, USA -

Thomas W Miller
Department of Psychiatry
University of Kentucky, USA -

Gjumrakch Aliev
Department of Medicine
Gally International Biomedical Research & Consulting LLC, USA -

Christopher Bryant
Department of Urbanisation and Agricultural
Montreal university, USA -

Robert William Frare
Oral & Maxillofacial Pathology
New York University, USA -

Rudolph Modesto Navari
Gastroenterology and Hepatology
University of Alabama, UK -

Andrew Hague
Department of Medicine
Universities of Bradford, UK -

George Gregory Buttigieg
Maltese College of Obstetrics and Gynaecology, Europe -

Chen-Hsiung Yeh
Oncology
Circulogene Theranostics, England -
.png)
Emilio Bucio-Carrillo
Radiation Chemistry
National University of Mexico, USA -
.jpg)
Casey J Grenier
Analytical Chemistry
Wentworth Institute of Technology, USA -
Hany Atalah
Minimally Invasive Surgery
Mercer University school of Medicine, USA -

Abu-Hussein Muhamad
Pediatric Dentistry
University of Athens , Greece

The annual scholar awards from Lupine Publishers honor a selected number Read More...


