


Lupine Publishers Group
Lupine Publishers
ISSN: 2637-4668
Research Article(ISSN: 2637-4668) 
Shear Strength Tests in a Lightweight Floor System with Cement and Polyurethane Adhesives Volume 3 - Issue 5
Received: January 20, 2020; Published: January 30, 2020
Corresponding author: Jacek Karpiesiuk, Bialystok University of Technology, Government Building Expert in construction and building specialties, Member of the Polish Chamber of Civil Engineers, Wiejska str. 45A, 15-351 Bialystok, Poland
DOI: 10.32474/TCEIA.2020.03.000173
Abstract
The article presents static shear tests of adhesives connecting various types of lightweight floor system (LFS) composites with a heating coil. This method is approved for use, and its advantage is the reproduction of the real working conditions of a light floor. Preliminary tests were carried out to determine the point shear strength of selected adhesives and the target ones, using a strain gauge method of deformation measurements. Three types of adhesives used in the lightweight heated floor system were researched-cement deformable, type C2S1, C2S2, and polyurethane BondT8. In addition to determining the maximum shear stress, deformation and approximate displacement of adhesives in this type of composites, the Kirchoff’s and Young’s modulus were also calculated. The method used did not allow determining Poisson’s ratio. Thanks to the three-sided model of sticking the tiles outside its outline, it was possible to determine what the maximum shear stress occurs on the edges of the floor. This is important, due to the highest LFS stresses occurring in these places, confirmed by the analyses contained in the literature cited in this article.
Keywords: Shear strength; Polyurethane adhesive; Lightweight floor system; C2S1, C2S2 adhesive
Introduction
The purpose of testing the samples made in the form of layered
lightweight floor system (LFS) composites was to determine
the maximum and intermediate shear strength of the adhesives
adopted, their elongation and deformation. LFS composites
consisting of tiles floor and insulating substrate in which heating
coils were placed have connected three types of adhesives. Three
different composites were made, each consisting of five samples
in which polyurethane glue and type C2S1, C2S2 cement adhesive,
reinforced with fiberglass mesh with a weight of 320g/m2 was used.
In addition to checking the shear strength of the adhesives, it was
planned to determine the sizes of their Kirchoff G, Young E modulus
and Poisson’s ratio. A static shear test was used to define these.
In the case of a sample connected with polyurethane glue,
aluminum foil which was 45μm thick was glued on the XPS
insulation, which is one of the layers of the LFS model in some
applications. Determination of Kirchoff’s, Young’s modulus and
Poisson’s ratio of adhesive mortars require the use of very accurate
sensors measuring small deformations during their shearing, as
well as a selection of appropriate sizes and preparation of composite
samples. Correct placement and precise mounting of measuring
devices are also important. Therefore, in the first stage, preliminary
shear strength tests were carried out without the installation of
strain gauges. After that, it was decided to reduce the surface of
the floor tiles, with the same size of the insulating substrate. High
sensitivity strain gauges were used in the target measurements.
Description of the Measurement Stand and Research Methodology
In the shear strength test, floor tiles glued to the thermal insulation on a surface of 10 x 20cm were initially used, using after one sample of each from the three types of adhesives to check the initial shear stress σs1. The tile was glued pointwise only with one-sided distribution of the adhesive outside its boundary, as shown in Figure 1. Ultimately, three samples of each of the adhesives were prepared in the construction of a lightweight floor and one compensation sample. The surface of the adhesive layer had dimensions of 10 x 10cm. They were cut and mounted on the machine with the tooling, as shown in Figure 2. Two strain gauges were installed in each sample, one in the longitudinal direction and the other in the transverse direction in relation to the force moving the floor tile.
Figure 1: The construction of the sample and fixation in a machine for preliminary shear strength tests in a lightweight floor system with a heating coil.

Figure 2: Hung Ta Instrument Co. measuring stand Ltd for testing shear strength with tooling.

The following adhesives (reinforced with mesh) were used in the tests, connecting the floor tile with the XPS rough insulation substrate - rough in the LFS with a heating coil, mounted in milled grooves:
a) cement C2S1 Ceram 255, reinforced with a glass fiber net
with a weight of 320g/m2,
b) cement C2S2 Flex-mortel, reinforced with fiberglass mesh
with a weight of 320g/m2,
c) BondT8 polyurethane glued to aluminum foil.
In the shear strength test, Tenmex type TFs-15 strain gauges
were used, with a measuring base length of 15mm, and strain
gauge constant k = 2.19 ± 0.5%, R = 120 ± 0.2%. Strain gauges
were carried out in a half-bridge system with 12mV/V sensitivity
and sampling. Two active strain gauges were glued to each forceexposed
sample, one longitudinally to the shear force and the
other transversely. Additionally, two passive strain gauges fulfilling
the role of compensation were connected to the research system.
The whole was connected to a measurement recorder, 4-channel,
16-bit SPIDER 8 from HBM and Catman Expres software, taking
readings in the amount of 50 samples per second with a low-pass
filter 5Hz. All samples were mounted in a specially prepared steel
handle, which allowed the axial movement of the floor tile under
the influence of tensile force. The procedure of preparing individual
samples is shown in Figures 3-6. The adhesive was spread outside
the tile in three directions, which reflects the real conditions when
laying tiles near to the walls of the room (there is no adhesive
outside the floor contour on one side).
Figure 3(a): Stages of mounting longitudinal and transverse strain gauges in cement adhesives C2S1 and C2S2: Point application of cement glue on a fiberglass mesh.
")
Figure 3(b): Stages of mounting longitudinal and transverse strain gauges in cement adhesives C2S1 and C2S2: Attaching strain gauges to cement adhesive mortars with embedded mesh.
")
Figure 4: Mounted strain gauges for aluminum foil and XPS insulating substrate on BondT8 adhesive.

Figure 5(a): Stages of sample preparation, where strain gauges are in cement adhesives C2S1 and C2S2: Application of the adhesive to the insulating substrate, where is built-in PVC heating coil.
")
Figure 5(b): Stages of sample preparation, where strain gauges are in cement adhesives C2S1 and C2S2: Submerging of previously mounted strain gauges on the fiberglass mesh.
")
Figure 5(c): Stages of sample preparation, where strain gauges are in cement adhesives C2S1 and C2S2: Covering the whole with adhesive.
")
Figure 5(d): Stages of sample preparation, where strain gauges are in cement adhesives C2S1 and C2S2: Laying the tile.
")
Figure 6(a): Stages of the sample preparation in which strain gauges are in BondT8 glue: A. Point application of glue to the insulating substrate which has a built-in PVC heating coil and aluminum foil.
")
Figure 6(b): Stages of the sample preparation in which strain gauges are in BondT8 glue: Attaching strain gauges to BondT8 adhesive.
")
Figure 6(c): Stages of the sample preparation in which strain gauges are in BondT8 glue: Covering the whole with polyurethane glue.
")
Figure 6(d): Stages of the sample preparation in which strain gauges are in BondT8 glue: Laying the tile on BondT8 adhesive.
")
Measurements
Figure 7: Graph of shear force relationship to elongation of C2S1 adhesive mortar with adhesive separation.

Initial shear strength tests achieved the following results
in: C2S1 adhesive, the maximum force was 2.35 kN, stress
σs1=2350N/20,000mm2= 0.118 MPa, elongation (at maximum
stress) approx. 4mm, adhesive separation of the tile from the
adhesive mortar, as shown in Figure 7.
σs1 - shear stress with point fixing of tile (symbol 1 means the
spread of the adhesive outside the tile in one direction)
- C2S2 adhesive, the maximum force was 2.98 kN, stress σs1 =
2980 N/20,000mm2 = 0.149 MPa, elongation (at maximum stress)
about 6mm, adhesive separation of adhesive mortar from XPS, as
shown in Figure 8.
- BondT8 adhesive maximum force was 2.49 kN, stress σs1 =
2490 N/20,000mm2 = 0.125 MPa, elongation (at maximum stress)
about 8mm, cohesive detachment in the adhesive, as shown in
Figure 9.
In the target studies, the growth characteristics and maximum
shear forces in relation to the elongation are shown in Figures 10-
12.
Figure 8: Graph of shear force relationship to elongation of C2S2 adhesive mortar with adhesive separation.

Figure 9: Graph of shear force relationship to elongation of BondT8 adhesive with cohesive detachment.

Figure 10: Strength graph depending on C2S1 adhesive elongation; max. forces in S1-1 = 3206 N, S1-2 = 2341 N, S1-3 = 2500 N; average of all max. forces is 2680 N.

Figure 11: Strength graph depending on C2S2 adhesive elongation; max. forces in S2-1 = 3833 N, S2-2 = 3639 N, S2-3 = 3729 N; average of all max. forces is 3730 N.

Figure 12: Strenght graph depending on BondT8 adhesive elongation; max. forces in P1 = 1454 N, P2 = 1427. P3 = 1362 N; average of all max. forces is 1410 N.

The maximum average shear stress σs3 of adhesives, connecting tile to the insulating substrate, depending on its type, was:
a) C2S1 adhesive-σs3 = 2680N/10000mm2 = 0.268MPa,
elongation (at maximum stress) on average about 4mm.
b) C2S2 adhesive-σs3 = 3730N/10,000mm2 = 0.373MPa,
elongation (at maximum stress) on average about 7mm.
c) BondT8 adhesive - σs3 = 1410 N/10000mm2 = 0.141 MPa,
elongation (at maximum stress) on average about 9mm.
d) σs3-shear stress when installing floor tile on three sides
(symbol 3 means the adhesive is distributed outside the tile in
three directions).
Analysis of Results
As the results of the tests show, the maximum shear stress of adhesives fixed in three directions compared to spot-fixing is higher and is 130% (C2S1), 150% (C2S2), and 15% (BondT8). The average maximum shear stress when we glue the tiles in the middle of the rooms (interaction of adhesives in 4 directions on the XPS substrate, in the adhesive C2S1, with embedded mesh 320g /m2), described by Karpiesiuk, Chyży [1], were - 1.03MPa and in C2S2 adhesive - 2.00MPa. These results are 4-5 times higher when fixing terracotta tiles in all four directions, compared to three-way fastening. From this follows the conclusion that the location of ceramic tiles in the room on the floor affects the amount of shear stress. Preliminary computational simulations of the light floor system made with the Finite Element Method, based on approximate strength indicators, showed that the greatest stresses occur at the edges of the board. The composite for these calculations consisted of a 50 x 50cm floor tiles, an XPS insulating substrate, with a 35oC heating coil temperature load, the adhesive layer was cement adhesive type C2S1. Maximum shearing stress τxy, occurring at the edge of the calculation model, on the combination of thermal insulation and adhesive mortar was about 0.15MPa. This is shown in Figure 13 (the results are given in kPa). The fact of the occurrence of the greatest shear stress on the edges is confirmed by analytical methods for determining the stress of glued joints described by da Silva and others in [2,3].
Figure 13: Map of shear stress τxy on the LFS simulation model.

Determining the strength indexes of adhesives bonding materials with different properties is not an easy issue and one should take into account the advantages and disadvantages of many methods that can be used to achieve the right outcome. In this research, the aim was to determine the stress and strain as well as selected strength indicators, through mapping the actual working conditions of a fragment LFS. This method is used and admissible as one from many, as confirmed by Maćkowiak [4]. However, they note that in this type of research there are difficulties in reading the deformations of the adhesive itself at a complex state of stress, resulting from the close presence of materials with different strength indicators. Therefore, a sensible solution for insitu samples, which measure the deformation of individual floor layers could be to use the digital image correlation method. In their opinion, by performing cast adhesive samples and subjecting them to stresses in other than real working conditions, it is not possible to map all processes occurring in the joined composites. These are e.g. crosslinking phenomena, including downforce values and thermal changes. At the same time, achieving an uniaxial stress state, e.g. pure shear is only possible in cast samples. As Adams and Wake [5,2] provide, the graphs of the stress-strain relationships may differ from other methods when testing the cast adhesive material itself, without being glued to other materials.
The following factors affecting the result of stress correlation to deformation for glued composites can be mentioned:
a) Anisotropic properties of adhesives (coated on both sides
and reinforced with fiberglass mesh)
b) Physicochemical interfacial reactions of the glued
composite
c) Difficulty assessing the stiffness of a thin
adhesive layer when surrounded by materials with
different Young’s modulus.
d) The lack of free glue operation may cause a triaxial stress
state.
e) Stress unevenness (higher on the edge).
It seems that the right direction during testing of cast samples is to reduce them to the dimensions found in real joints, which will also reduce the defects occurring inside them during preparation. In this case, for a flat state of stress, we assume the following dependencies of normal to tangents stress -σ1 = τ i σ2 = -τ. What deformations and stresses look like is shown in Figure 14.
Figure 14: Pure shear with principal stresses σ1 = σ = τ and σ2 = -σ = -τ, where: A. - load and strain diagram; B.- corresponding to the system Mohr wheel [5].

There was a flattening of the square occurred here by the angular deformation γ, hence in Figure 14, the following equation can be adopted:
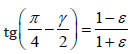 (1)
(1)if we assume that γ has a small value, then tg(γ/2) ≈ γ/2), i.e.
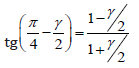 (2)
(2)After comparing the formula (1) and (2) we have the
relationship:
Ɛ = γ/2 at pure shear
This is confirmed by the adopted correlations of generally
known formulas:
σ = τ i ν = 0 with Young’s modulus E as the hypothetical stress that would occur if the material sample was twice extension without changing its cross-section, we have:
Ɛ = γ/2 at pure shear
According to Godzimirski and Tkaczuk [6,7], who performed tests of adhesive joints on both in-situ and cast samples (paddle, stretched and compressed cylindrical), both of these methods are possible to use because the results of determining Young’s modulus from the dependence of stress on strain are similar-are within the confidence interval = 95%. However, the determined strength characteristics should be analyzed (e.g. by FEM) and compared to materials with similar compositions. A very important feature of the adhesive is its resistance to delamination, which leads to loss of adhesion in the bonded composite. For this reason, in-situ samples that reflect the actual connection in LFS were prepared and subjected to shear strength testing. The goal was to find out the magnitude of shear forces in order to prevent the loss of cohesion of adhesive mortars while designing, and at the same time to determine the Kirchoff’s, Young’s modulus and Poisson’s ratio in conditions similar to real ones occurring at the construction site.
To determine the strength indicators on in-situ samples, charts were made based on the average test results. Due to the small number of test samples (3 pcs of each adhesive) the determined results should be treated as estimates. Figures 15-17 show the relationships of longitudinal deformations (resulting from the reading of strain gauges placed inside C2S1, C2S2, BondT8 adhesives) to the average shear stress calculated according to formula (3).
 (3)
(3)Figure 15: Relationship of shear stress σs and deformation Ɛm of C2S1 adhesive.

Figure 16: Relationship of shear stress σs and deformation Ɛm of C2S2 adhesive.

Figure 17: Relationship of shear stress σs and deformation Ɛm of polyurethane BondT8 adhesive.

σs- shear stress of the in-situ sample, Fs-shear force, A– a constant surface for the stuck tile to the insulating substrate, equal to 100 x 100mm=10000mm2
While using the method reflecting the real working conditions of the glued composite, it was assumed that the glued elements are subject to deformation only due to shear stress τ, and their value is the same along the entire length of the glue connection as described by Maćkowiak and others [4]. In fact, the glued elements are subject to both tangential and normal stress, as shown in Figure 18. Such an assumption according to [4] in glued steel materials leads to an error of approx. 6.5% when calculating the displacement of ds, and the maximum stress values are higher than the assumed averages of 1.6-3.2%. In addition, deformation and stress disproportions are greater than average values when the stiffness of the materials to be glued decreases and the connection length increases.
Figure 18: Section of stress and deformation while cutting the adhesive layer, from [4].

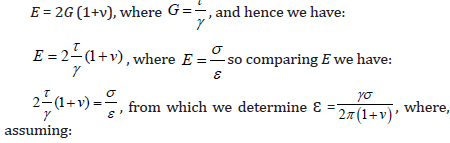
According to the standard [8], the Kirchhoff’s modulus of overlapped and stretched elements can be determined, as in Figure 19, where the measurement of force and deformation is carried out until the destruction of the prepared samples. Figure 19 shows the stress and strain directions of the adhesive layer. Before determining the necessary strength parameters, the RH proportionality limit should be determined from the diagrams of tangential stress versus strain. RH is the boundary value of the elastic phase stress below which we determine Kirchoff’s modulus, Young’s modulus and Poisson’s ratio. The ratio of stress to elastic deformation has a constant value and decreases with plastic deformation. Performing shear or torsion tests determine the modulus of transverse elasticity, called the Kirchhoff G module. Its value described by Kłysza [9] depends on the type of material, temperature and pressure, and does not depend on the speed of deformation. It is about 2-3 times smaller than Young’s modulus. Using isotropic materials, it can be calculated from the formula (4):
Figure 19: Lap joint adhesive model before and after deformation (ds - adhesive displacement during shearing).

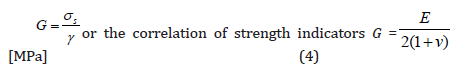
σs – shear stress of the in-situ sample, γ- deformation angle,
E- Young’s modulus ν-Poisson’s ratio
when Ɛ = γ/2 is at pure shear, then the Kirchoff’s modulus is:
 (5)
(5)When dealing with an anisotropic structure of materials or composites made from several products, two elasticity indices may occur in the elastic phase - primary and secondary. According to [5], it is not recommended to use the primary modulus of elasticity for stress analysis and structure design. Only a secondary indicator going to the proportionality limit gives more reliable results. The elasticity of different materials depends on two factors - the density and stiffness of interatomic bonds. The smaller and more strongly bonded the structural atoms of the material, the greater its rigidity. Steel and polymers can serve as a comparative example. When the density of atoms and their bonds differ, they affect material stiffness.
Young’s modulus was determined on the basis of formula (6):
 (6)
(6)E – Young’s modulus, Δσ − a difference of material stress in
the elastic phase, Δεsp− a difference of material deformations in
the elastic phase
Confirmation of the assumption that initial readings are not
included in calculations of Young’s modulus determinations during the first small increase in load, due to possible small shifts, are also
included in the norm [10]. In addition, the individual assessment of
the strength characteristics of materials depends not only on their
chemical composition but also on the procedure and apparatus
used in the tests. The use of longitudinally arranged strain gauges in
shear strength tests allowed the determination of the approximate
value of Young and Kirchoff’s modulus for individual types of
adhesives. For calculations, Δσ = 0.05 MPa was used in cement
adhesives, and Δσ = 0.02MPa in polyurethane adhesive, and in this
range the corresponding deformations . Transverse strain gauges
arranged to determine the Poisson number did not give reliable
results. The strength indices calculated from formulas (5) and (6)
are given in (Table 1). In addition, the table provides information on
the maximum stress σs max and the related longitudinal deformation
Ɛm and the maximum approximate displacements of the selected
two samples during the experiment.
Table 1: Maximum stresses, deformations and strength indexes E and G (only in pure shear) in the tested cement adhesives and polyurethane, as the bonding layer for LFS composite.

σs max-maximum shear stress.
Ɛm-longitudinal shear deformation.
ds max -approximate, maximum shear displacement.
E-average Young’s modulus of the in-situ sample.
G-average Kirchoff’s modulus of the in-situ sample (in pure shear).
Conclusions
Shear strength tests of selected adhesives, which join thermal insulation XPS and tile floor in the LFS (with a heating coil) allowed to obtain the characteristics of the relationship of stress and deformation. This was possible thanks to the use of a precise technique of strain gauges. The experiments also determined the maximum stresses, deformations and approximate displacements of cement adhesives type C2S1, C2S2 and polyurethane glue Sika BondT8, occurring at the edges of rooms. Just there, as inform the literature cited in this article and the owns computational simulations shear stress reaches maximum values. Kirchhoff’s and Young’s modulus of individual adhesives were calculated on the basis of stress-strain relationships. The value of these strength indicators gives reliable results due to the preparation of in-situ samples that reflect the real working conditions of light floors. The data obtained may differ from the results obtained in tests carried out on cast samples, and specifically increase them.
The reason can be many factors, including
a) Difficulties in reading the deformations of the adhesive
itself in a complex state of stress, resulting from the close
presence of materials with different strength indicators
b) Occurring cross-linking processes, including downforce
values and thermal changes
c) The effect of strengthening cement glues with fiberglass
mesh
The measurement method, using the strain gauges for the shear
strength test is not recommended for determining the Poisson
ratio, taking a transverse position of strain gauges with respect
to each other. Obtained results of strength indicators should be
treated as estimates, due to the insufficient number of test samples.
It is recommended to perform experimental tests on cast samples,
followed by numerical calculations using e.g. the finite element
method (FEM). This will confirm whether the data obtained are
consistent with the results of lightweight floor system strength
experiments using the same type of adhesive.
Acknowledgment
The author of the article would like to thank Company Sika Poland and Basf Poland for providing material to research as well as Mrs. Anna Zakowicz, Ph.D. Krzysztof Czech , Mr. Adam Wasilewski from the Bialystok University of Technology for technical cooperation. The research was carried out as part of my own work from the Bialystok University of Technology No. W/WBIIŚ/15/2019, financed from the subsidy provided by the Ministry of Science and Higher Education.
References
- Karpiesiuk J, Chyzy T (2020) The effects of testing the strength parameters of the adhesive layer in
a lightweight floor system. - Da Silva LFM, Das Neves PJC, Adams RD, Spelt JK (2009) Analytical models of adhesively bonded joints-Part I: Literature survey. International Journal of Adhesion and Adhesives 29(3):319-330.
- Da Silva LFM, Das Neves PJC, Adams RD, Wang A, Spelt JK (2009) Analytical models of adhesively bonded joints-Part II: Comparative study. International Journal of Adhesion and Adhesives 29(3):331-341.
- Maćkowiak P, Płaczek D, Sołtysiak A (2017) Methods for determination of adhesives shear modulus and response to shear stress. Scientific Technical Journal of Developments in Mechanical Engineering 9(5):27-43.
- Adams RD, Wake WC (1984) Structural Adhesive Joints in Engineering. Elsevier, London.
- Godzimirski J, Tkaczuk S (2004) Określanie właściwości mechanicznych spoin klejowych. Technologia i automatyzacja montażu 3(4):95-97.
- Godzimirski J, Tkaczuk S (2006) Method of calculating cohesive strength of adhesive joint. Bulletin WAT 5(5):159-172.
- (2011) Structural adhesives-determination of shear behaviour of structural bonds-part 2: trick adherends shear test.
- Kłysz S (2018) Elementy wytrzymałości materiałów-moduł sprężystoś Instytut Techniczny Wojsk Lotniczych, str. P: 1-8.
- ASTM E111-17. Standard Test Method for Young’s Modulus, Tangent Modulus, and Chord Modulus.


-

Mark E Smith
Bio chemistry
University of Texas Medical Branch, USA -

Lawrence A Presley
Department of Criminal Justice
Liberty University, USA -

Thomas W Miller
Department of Psychiatry
University of Kentucky, USA -

Gjumrakch Aliev
Department of Medicine
Gally International Biomedical Research & Consulting LLC, USA -

Christopher Bryant
Department of Urbanisation and Agricultural
Montreal university, USA -

Robert William Frare
Oral & Maxillofacial Pathology
New York University, USA -

Rudolph Modesto Navari
Gastroenterology and Hepatology
University of Alabama, UK -

Andrew Hague
Department of Medicine
Universities of Bradford, UK -

George Gregory Buttigieg
Maltese College of Obstetrics and Gynaecology, Europe -

Chen-Hsiung Yeh
Oncology
Circulogene Theranostics, England -
.png)
Emilio Bucio-Carrillo
Radiation Chemistry
National University of Mexico, USA -
.jpg)
Casey J Grenier
Analytical Chemistry
Wentworth Institute of Technology, USA -

Hany Atalah
Minimally Invasive Surgery
Mercer University school of Medicine, USA -

Abu-Hussein Muhamad
Pediatric Dentistry
University of Athens , Greece
