
Lupine Publishers Group
Lupine Publishers
Menu
ISSN: 2637-4668
Research Article(ISSN: 2637-4668) 
Polyurea Coated and Plane Reinforced Concrete Panel Behavior under Blast Loading: Numerical Simulation to Experimental Results Volume 1 - Issue 4
Natalia L Carey1, John J Myers1*, Domenico Asprone2, Costantino Menna2 and Andrea Prota2
- 1Missouri University of Science and Technology, USA
- 2Department of Structural Engineering, University of Naples, Italy
Received: February 21, 2018; Published: March 05, 2018
Corresponding author: John J Myers, Missouri University of Science and Technology, 325 Butler Carlton Hall, 1401 North Pine Street, Rolla, Missouri- 65409-0030, USA
DOI: 10.32474/TCEIA.2018.01.000119
Abstract
This research investigated the behavior of reduced scale standard reinforced concrete panels coated with various polyurea systems under blast loading. The blast mitigation performance of four coatings including two plain polyureas and two discrete fiber-reinforced polyurea (DFRP) systems was evaluated. Chopped E-glass fibers were discretely integrated in with the polyurea to develop a DFRP system. The addition of glass fiber to a polymer coating provides improved stiffness and strength to the composite system while the polyurea base material provides ductility according to a fiber length optimization study conducted by Carey and Myers (2011) [1]. Reduced scale panel blast testing was conducted. In addition, the finite element program LS-DYNA was used to model panel and coating response under blast loading. Several modeling solutions were undertaken and compared for concrete formulation. Winfrith concrete material, model and Surface Cap model, which are widely used to simulate the concrete behavior under dynamic loading, were examined. Modeling results were analyzed and compared to the experimental work to validate the conclusions.
Keywords: Composite material; Blast mitigation; Discrete fiber-reinforced polyurea system; LS-DYNA; Polyurea
Introduction
Research initiatives have been advanced to investigate new materials that can be used for blast mitigation, strengthening, or for general repair-retrofit applications. This research activity focused on assessing the effectiveness of various blast mitigation coating technologies to be used for enhancing the blast resistance of structural members. This study examined the behavior of reduced scale standard reinforced concrete (RC) panels coated with various polyurea systems under blast loading. The finite element program LS-DYNA was used to model panel impact resistance under blast loading using the explicit time integration in order to compare to the experimental work to validate the conclusions. The blast mitigation performance of four coatings including two plain polyureas and two discrete fiber-reinforced polyurea (DFRP) systems was assessed. Chopped E-glass fibers were discretely integrated in with the polyurea to develop a DFRP system. The addition of glass fiber to a polymer coating provides improved stiffness and strength to the composite system while the polyurea base material provides ductility [1]. This study builds on previous work investigating the blast mitigation performance of hybrid, plain, and steel fiber- reinforced concrete panels coated with various polyurea systems under blast loading [2].
The results of the blast testing revealed that the addition of plain polyurea or DFRP system on the tension side improved panel performance by containing spalling during a blast event. DFRP systems exhibited less bulging compared to the plain polyureas due to higher stiffness. Previously, the polyurea retrofit approach for blast mitigation and impact resistance was investigated by conducting testing on masonry walls [3-10], vehicle barriers [11,12], and reinforced concrete panels [12-14]. Polyurea coating exhibited ductile behavior and was effective at containing spalling and reducing fragmentation during either blast or impact testing. Other Studies examined the effectiveness of the system to provided added shear and flexural capacity [15].
Polyurea coating possesses several advantageous properties, including elasticity, ductility, and energy absorption. It is a corrosion and abrasion resistant, durable, and lightweight material. Polyurea material is a low-viscosity liquid, it bonds very quickly and evenly during application. Several key characteristics of the polyurea coating include chemical and water resistance, excellent elongation, and quick curing. Polyurea coating is capable of withstanding regular thermal or dynamic movement as well. Despite requiring special equipment and experienced operators for mixing, application is easy and the material cures rapidly. Prior to application, the surface should be thoroughly prepared in order to achieve an adequate and strong bond. Also, the material is not very sensitive to temperature and humidity during installation and service, which eliminates the need for additional arrangements for application procedures and curing environments. Polyurea also aids in the confinement of postblast materials in compression loaded structures, which produces a residual load-bearing capability
Experimental Testing
Material properties and panel fabrication
This research project examined the effectiveness of various polyurea coating systems for blast mitigation. Five 90 mm thick RC panels with a 0.5% reinforcement ratio in each direction were fabricated at the High Bay Structural Laboratory on the Missouri S&T campus. Four panels were coated with various plain polyureas and DFRP systems. Table 1 provides detailed descriptions of the test specimens and investigated coating systems. The nominal dimensions of each panel were 1180 x 1180 mm. All the panels included Grade 420MPa ASTM No. 3, 9.5mm, steel bars for longitudinal reinforcement. Ready-mix concrete was used during panel fabrication. Hardened concrete properties are summarized in Table 2.
Table 1: Panel Test Matrix.
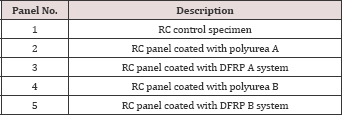
Table 2: Hardened Concrete Properties.

Two types of elastomeric polyurea were examined: polyurea A and polyurea B. Both polyureas were two-component 100% solid reactive cures. Selected coatings exhibited difference in ductility and set time. Mechanical properties supplied by the manufacturer for each elastomeric
polyurea are displayed in Table 3. Chopped E-glass fibers were discretely integrated in with the polyurea to develop a DFRP system. Multi-end continuous low static E-glass fiber roving designed specifically for spray-up applications was used for DFRP systems.Glass fiber's mechanical properties provided by the manufacturer are listed in Table 4. Mechanical properties of DFRP systems obtained during coupon tensile testing of each coating are included in Table 5. In addition, ignition loss testing was conducted to determine the fiber volume fraction in DFRP specimens. The fiber volume fraction levels were obtained using the highest fiber roving chopping speed on a mechanical chopper/spray gun as prescribed in a fiber length optimization study undertaken by Carey and Myers [1].
Table 3: Mechanical Properties of Elastomeric Polyureas.

Table 4: Mechanical Properties of E-Glass Fiber.

Table 5: Mechanical Properties of DFRP Systems.

Coating Application
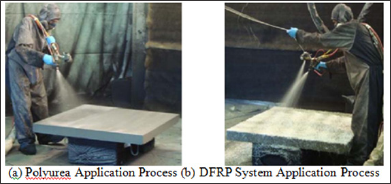
Four panels were coated with 6.4 mm thick spray-on elastomeric polyurea systems on the tension face and along the adjacent sides to minimize coating debonding potential. In addition, a 0.05 to 0.08 mm thick primer was applied on the panel bottom surface (i.e. tension face) prior to coating application to achieve an adequate and strong interface bond between the concrete substrate and polyurea coating and to minimize delamination potential. During DFRP coating application, a mechanical chopper/spray gun was used to combine and simultaneously distribute a two-component polyurea mixture, chop the E-glass fiber roving, and disperse the glass fibers into the coating system creating a uniformly discretely integrated fiber-reinforced system. Fiber volume was adjusted during coating application by increasing the speed of fiber chopping and integration into the polyurea matrix. Fiber length of 6.4 mm was used during fiber-reinforced polyurea coating application based on results of a fiber length optimization study conducted by Carey and Myers [1] concluding that samples with shorter fibers exhibited higher ductility due to the weaker bond between the fiber and matrix. Coating application process is depicted in Figure 1.
Figure 1: Coating Application Process.
Blast Test Setup
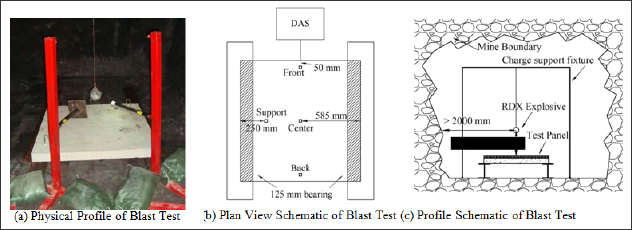
After specimen fabrication and coating with various polyurea systems, panels were transported to the Missouri S&T experimental mine for blast testing. Panels were tested using a charge weight of 1.36 kg of C4 (a common variety of plastic explosive) at a 305 mm standoff distance as prescribed in a previous blast study by Lu [16] based on expected damage level. During testing, each panel was simply supported on the steel w-sections with a 64 mm bearing on each end. Charges were hung from the mine ceiling using a wire to a 305 mm standoff distance measured from the center of the explosive charge to the top face and centered over the test panel surface. Panel blast test setup is presented in Figure 2. Test results were documented by still digital photography and static measurements as required. Residual deflection was measured at the midspan from the top of the panel to the bottom of the crater using a straight edge level and a tape measure.
Figure 2: Blast Test Setup.
Blast Test Results
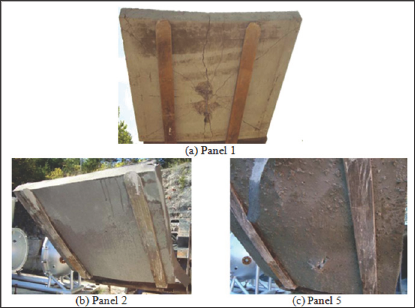
Plain RC panels demonstrated surface cratering along the centerline on the top face of the panel after detonation due to crushing of the material by the compression from the shock wave and erosion by the gases from the blast. Most of the RC panels exhibited flexural failure during blast testing as a result of the initial pressure wave impact. Major surface spalling was observed in the center of the bottom face of the RC control panel (Panel 1) due to the shock wave propagation all the way through the material and the subsequent tensile reflections from the near free-face (see Figure 3a). In addition, polyurea delamination and tearing occurred along the panel sides during testing. Tearing of the coating was observed only in one case, on the bottom/tension face of the RC panel coated with DFRP B system (Panel 5), due to internal voids formed within the system during the application when insufficient amount of polyurea matrix material is combined with a lot fiber or due to lower strength and higher ductility of the coating compared to DFRP A system (see Figure 3b & 3c).
Figure 3: Panel Bottom Face Damage After Detonation.
Modeling Procedure
Model description
Figure 4: RC Panel Model Components (LS-DYNA Input) (cont.).
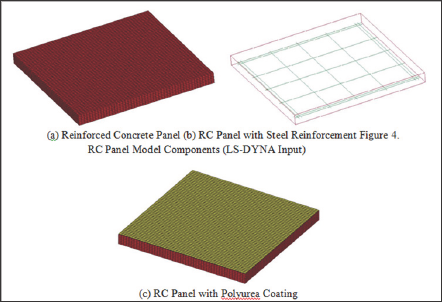
The nominal dimensions of each panel were 1180 x 1180 mm. In addition, each modeled panel was 90 mm thick with a 0.5% reinforcement ratio in each direction. A constant stress eight node solid element formulation was used to construct the panel shape consisting of 49 element mesh in each horizontal direction and 6 elements through the thickness (see Figure 4a). Longitudinal steel reinforcement consisted of Grade 420 MPa ASTM No. 3 bars and was modeled as beam elements (see Figure 4b). A perfect bond was assumed by tying steel reinforcement and concrete nodes during modelling and incorporating CONSTRAINED_LAGRANGE_IN_ SOLID1 formulation. In Refers to keyword names in LS-DYNA [17] order to model plain polyurea coatings and DFRP systems, a shell formulation with a 49 by 49 element mesh was used that coincided with a solid concrete mesh to avoid instabilities due to the contact formulation (see Figure 4c). A 6.4mm coating was applied on the tension side/back face of the panel. A contact between concrete and investigated coatings was modelled using CONTACT_TIED_SHELL_ EDGE_TO_SURFACE_BEAM_OFFSET1 formulation. Each panel was simply supported on steel w-sections with a 64 mm bearing along two edges during blast testing, which was incorporated into the model as well. The panel was constrained in the transverse direction along the two opposite sides through the thickness with a bearing distance along those edges.
Loading
During experimental testing, a charge weight of 1.36kg of C4 at a 305mm standoff distance was used. The spherical charge was centred above the specimen and hung from the mine ceiling using a wire to a 305 mm standoff distance measured from the centre of the explosive charge to the top face of the test panel. A blast event was modelled using a LOAD_BLAST1 function based on ConWep formulation, which is a built-in simulation describing a blast event as a function of charge weight and standoff distance Table 6: Winfrith Model, Concrete Mechanical Properties.[18]. The LOAD_BLAST1 formulation defines an air blast function for the application of pressure loads due to charge detonation. The charge weight was converted to the equivalent mass of TNT using a factor of 1.34 [18]. The charge weight of 1.8234kg of TNT (1.36kg of C4) and the coordinates corresponding to the centroid of the charge were implemented in the LOAD_BLAST1 card. The pressure history induced by the blast was calculated and applied as a pressure load on top surface of the panel. A LOAD_SEGMENT_ SET1 was used to define an area over which the distributed pressure load was applied. The peak pressure during the charge detonation was calculated using the Blast Effects Computer [19] to be 0.129GPa, which corresponds to the pressure output of 0.11GPa obtained during the modelling analysis.
Material models
Two modelling solutions were undertaken and compared for concrete formulation. During the first approach, Win frith material formulation (material model 85, MAT_WINFRITH_CONCRETE1) was used to model RC. This concrete material model refers to a basic plasticity model that includes the third stress invariant for consistently treating tri axial stress behaviour. The plasticity portion of the Winfrith concrete model is based upon the shear failure surface proposed by Ottosen [18] which is referred to as a four parameter model. It includes strain softening in tension, optional strain rate effects and concrete tensile cracking with up to three orthogonal crack planes per element. For this reason, one advantage of the Winfrith concrete model is monitoring crack development and propagation. Concrete model strain rate enhancement is based on the formulations given by Broad house and Attwood [19] where strain rate enhancements are based upon the incremental strain rates and applied by means of three strain rate enhancement factors affecting tensile, compressive and Young's modulus for both the low and high strain rates.
Table 6: Winfrith Model, Concrete Mechanical Properties.

*Assumed values
As input concrete model data, strain rate effects were implemented in the material model by specifying fracture energy values, since concrete exhibits an increase in strength at high strain rates [20]. Fracture energy values derived by CEB (Comité Euro-Internacional du Béton) were obtained from [21]. Concrete mechanical properties used for the Winfrith formulation are summarized in Table 6. During the second approach, Continuous Surface Cap Model (material model 159, MAT_CSCM1) was used tosimulate concrete properties and behaviour. The concrete material model MAT_CSCM adopted for the present simulation is commonly referred to as a smooth or continuous surface cap model and was developed to predict the dynamic performance of concrete used in roadside safety structures. A smooth and continuous intersection is formulated between the failure surface and hardening cap. The model includes isotropic constitutive equations, yield and hardening surfaces; damage formulations are used to simulate softening including stiffness reduction. Rate effects are included in viscoplastic algorithm derived by Simo et al. [22]; it is applied to the model by means of a strain rate formulation that is based on a the yield surface affecting the damage surface and fracture energy.
Table 7: Surface Cap Model, Concrete Mechanical Properties.

*Assumed values
The Simo et al. extension requires one rate effects parameter, denoted by r|. This parameter is called the fluidity coefficient and is a automatically computed as a function of input concrete compressive strength and maximum aggregate size. Further details on the constitutive model can be found in [23]. The concrete model includes initialization routines that provide the user with default input parameters for normal strength concrete. In this way, required strengths, stiffness values, hardening, softening, and rate effects parameters are set as a function of concrete compressive strength and maximum aggregate size. All test data and assumptions used to set the default input parameters for concrete are reported in [24]. Concrete material properties used for the Continuous Surface Cap model are displayed in Table 7. Element erosion/deletion was addressed through ERODE1 parameter. The ERODE1 parameter influences displacement and damage on the tension face of the panel during a blast event [16]. For all simulated panels, a value of 1.1 was selected to prevent premature element erosion.
It should be pointed out that values for strain to be used in an erosion algorithm should take into account the increase due to softening, strain rate during explosion, confinement [25]. In MAT_ CSCM elements erode when damage variables exceed 0.99 value and the maximum principal strain exceeds 1-ERODE. Typically, this value ranges between 1.05 and 1.1 which allows damage Table 8: Steel Reinforcement Mechanical Properties to propagate according to a more physical pattern [25]. Within this range of ERODE values, authors verified through parametric analysis that no remarkable differences of the damage pattern can be observed. It should be pointed out that different mesh refinements may produce different computational results, typically generating greater damage accumulation in the smallest elements.
In case of CSCM concrete model, to regulate mesh size sensitivity, the concrete model internally maintains constant fracture energy regardless of element size. Steel longitudinal reinforcement was simulated using material model 24 (MAT_ PIECEWISE_ LINEAR_PLASTICITY1), which allows an elasto-plastic material with a strain rate dependency to be defined [16]. Winfrith concrete model permits the reinforcement to be included in the material card by providing a reinforcement ratio, but in this study the approach by discretely defining the internal reinforcement was used. Reinforcement properties used during the analysis are included in Table 8. The strain rate effects in the reinforcement were accounted for using the Cowper and Symonds model which scales the yield stress with the factor given by Equation 1 [16]. The strain rate parameters C and p were 0.1 and 5 respectively, which are commonly used in the literature [26].

Table 8: Steel Reinforcement Mechanical Properties

*Assumed values
where Σ is the magnitude of the strain rate,
An elasto-plastic material model 89 (MAT_PLASTICITY_ POLYMER1) was used to simulate plain polyurea coatings and DFRP systems. Coating properties used during the analysis are listed in Table 9. Effective stress vs. effective strain curve obtained during the uniaxial tensile testing was defined for each coating system and implemented into the corresponding model, as specified in material model 89 [16]. Considering that polyurea material and glass fiber are strain rate dependent, the strain rate scaling factors were used for each coating system to simulate the actual behavior of the material [27-31]. A 1.5 to 3 scale factor increase was implemented depending on the coating system. The strain rate scaling effect on yield stress curve was defined for each coating system using the strain rate value computed through the numerical simulation, as described in material model 89 [16]. In addition, the variation of failure strain with strain rate curve was specified for each coating system by providing the natural log of strain rate determined through the simulation and true strain at failure measured during the static tensile test, as defined in material model 89 [16]. Failure strain for each investigated coating system is provided in Table 9 along with the material properties. Since during the experimental tests the polyurea coating failure was expected to be due to tensile stress on the bottom face of the panels, maximum tensile strain was chosen as a possible parameter for quantifying and detectin major damage in those coated systems.
Table 9: Polyurea Systems Mechanical Properties.

Modeling Results
During this study, the behavior of reduced scale standard RC panels coated with various plain polyureas and DFRP systems subjected to blast loading was analyzed using the finite element program LS-DYNA. The blast mitigation performance and response of four coatings including two plain polyureas and two DFRP systems was assessed. Two models have been developed to evaluate the response of plain and coated RC panels subjected to one blast event. Modeling results were examined and compared to the experimental work to validate simulation conclusions. Two concrete modeling formulations were undertaken and compared. During the first approach utilizing Winfrith concrete formulation, the effective strain output was used as a proxy of the concrete and coating damage level.
Figure 5: Comparison of Experimental and Modeling Results for Panel 1 (cont.).
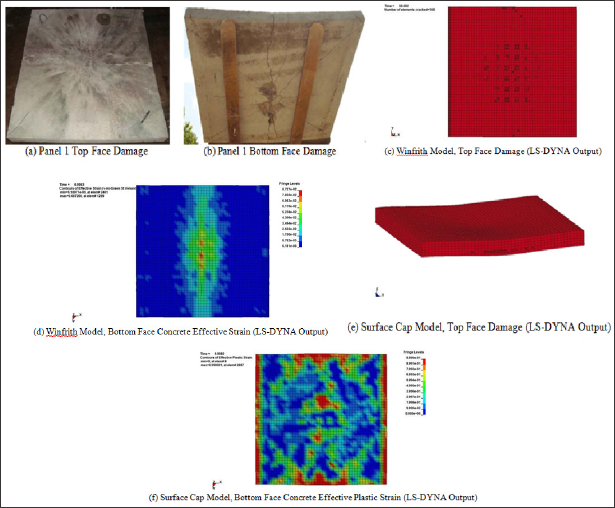
It is a monotonically increasing scalar value which is calculated incrementally as a function of the plastic component of the rate of deformation tensor J2. All panels modeled using Winfrith formulation exhibited flexural failure mode almost consistent with experimental results. Furthermore, yielding of the reinforcement was observed in all the simulated cases. Comparison of experiment and modeling results for Panel 1 is presented in Figure 5. Winfrith material formulation allows crack monitoring therefore, crack development along the centerline was observed on the top face of each panel representing minor cratering similar to the blast test results (see Figure 5a &5c). Through the thickness flexural cracking and minor spalling developed along the midspan on the tension face of the Panel 1 during blast testing similar to the behavior obtained through modeling using Winfrith concrete formulation (see Figure 5b&5d). Panel 6 modeling results revealed the same behavior of DFRP B system as during blast testing demonstrating tearing of the coating on the tension face.
During the second modeling approach, Continuous Surface Cap model was used to simulate concrete behavior under dynamic loading. Figure 5 compares experimental results and Surface Cap model output for Panel 1 (see Figure 5a-5f). Surface Cap model does not monitor crack development which differs from Winfrith concrete formulation, however the post blast damage can be obtained directly from the output file. In detail, the input value of NPLOT was set as equal to 1 in order to display the maximum of brittle and ductile damage (that is reported in the output fringe level as "effective plastic strain"). During simulations, minor internal erosion of the elements was observed in all the modeled cases representing onset crushing of concrete due to blast compression wave propagation through the material (Figure 5e).
All RC panels demonstrated flexural failure pattern similar to the results obtained from experimental testing. Moreover, based on simulation observations, (i.e. by measuring element compressive/ tensile strains) the strain rate affecting the concrete panels resulted approximately between 50 s-1 and 100 s-1, leading to a measured increment of concrete compressive strength of around 40%. In addition, yielding of the reinforcement was observed in all the simulated cases. Analysis of each modeling approach revealed that polyurea and DFRP systems spread the damage over the tension face of the panel due to high bond strength between the concrete and the coating (see Figure 6).
Figure 6: Comparison of Polyurea A and DFRP A Modeling Results (cont.).
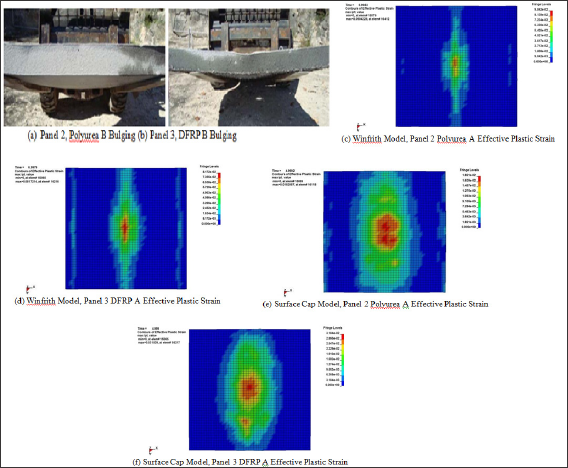
Table 10: Deflection Results.

*Concrete compressive strength = 21.4 MPa
The damaged area of polyurea coating reflected the deformation of the coating during experimental blast tests; in particular, it was found consistent with the coating bulging during experiment blast testing (see Figures 6a & 6b). DFRP systems exhibited more concentrated damage due to higher stiffness compared to plain polyurea coatings when Winfrith formulation was used (see Figure 6c & 6d). Polyurea A experienced more deformation than
DFRP A system when Surface Cap modeling approach was used reflecting the experimental results (see Figure 6e & 6f). During blast testing, DFRP systems exhibited less bulging compared to the plain polyureas due to higher stiffness. In addition, deflection results were compared and are summarized in Table 10. Winfrith formulation demonstrated slightly higher deflection values for coated panels compared to Surface Cap model.
Figure 7: Residual Midspan Deflection Diagram.

Coated panels exhibited decrease in deflection compared to the plain RC specimen during each modeling approach. Both concrete models approximately predicted the final deflection of the uncoated RC panel. Winfrith formulation estimated the final deflection of the coated panels within a factor of 3 or less depending on the coating system, while Surface Cap model within a factor of 3.6 or less. The simulations gave satisfactory results in terms of damage pattern whereas residual deflection was not in good agreement with experiments. During the experimental testing, coated panels exhibited major surface cratering resulting in higher deflection values compared to the modeling output. During testing the residual midspan deflection was measured from the top of the panel to the bottom of the crater whereas the modeling panel deflection did not consider crater depth (see Figure 7).
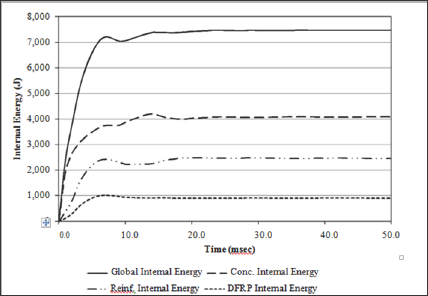
Furthermore, an internal energy was evaluated for each simulated case to analyze and compare the energy absorbed by each panel component. Surface Cap model internal energy values are listed in Table 11, since Winfrith formulation yielded varied internal energy results. The global internal energy was similar for each investigated case. In the case of uncoated panel (Panel 1), about 50% of the energy was absorbed by each panel component indicating yielding of the steel reinforcement (see Figure 8). In the case of coated panels (Panel 2, 3, 4, and 5), the internal energy absorbed by the steel reinforcement decreased due to the addition of the coating while the concrete internal energy increased slightly (see Figure 9). About 3% of the energy was absorbed by the plain polyurea coating and about 12% by DFRP systems irrespective of polyurea type. Surface Cap model internal energy output confirmed that the coating works as an external reinforcement absorbing tensile stresses in addition to fragmentation mitigation. Tensile stress is shared by the internal steel reinforcement and the external coating system. DFRP systems absorbed 4 times more internal energy compared to plain polyurea due to the addition of the fiber to the coating creating stiffer system. Finally, it is specified that maximum and residual strains of steel reinforcement were not measured during the tests and post-mortem inspection was not possible. However, the experimental results showed large residual displacements of panels suggesting that reinforcing steel has gone through significant damages and plastic deformations. This was confirmed during simulations where reinforcing steel residual deformation was recorded. Moreover, the internal energy of reinforcing steel in Figure 9 keeps a constant value after yielding.
Table 11: Surface Cap Model Internal Energy Results.

Figure 8: Panel 1, Internal Energy vs. Time Data.
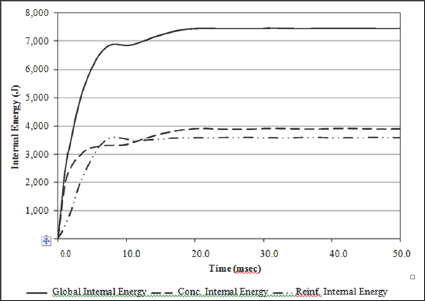
Figure 9: Panel 3, Internal Energy vs. Time Data.
Conclusion
During this research work, the behavior of reduced scale standard RC panels coated with various plain polyureas and DFRP systems subjected to blast loading was analyzed using the finite element program LS-DYNA. Two models have been developed to evaluate the response of plain and coated RC panels subjected to one blast event. Winfrith formulation and Surface Cap model were used to simulate concrete behavior under dynamic loading. The study was also performed in order to compare two different available concrete material models with the aim to simulate the structural behavior RC panles during blast events. The overall simulation results gave satisfactory results in terms of damage pattern suffered by RC panels whereas residual deflection was not in good agreement with experiments.
In particular, all panels exhibited flexural failure mode during each modeling solution consistent with experimental results. Analysis of each modeling approach revealed that polyurea and DFRP systems spread the damage over the tension face of the panel due to high bond strength between the concrete and the coating. The plastic strain output reflected the deformation of the coating during modeling analysis consistent with the coating bulging during experiment blast testing. It should be pointed out that Winfrith model was not accurate concerning crack pattern on bottom panel and computation of internal energy. One reason could be related to the fact that Winfrith model was originally not developed for very large deformations and for this reason less suitable for this kind of application. Surface Cap model internal energy output confirmed that the coating works as external reinforcement absorbing tensile stresses.
Tensile stress is shared by the internal steel reinforcement and external coating system. After a thorough analysis of the output results, it was determined that Surface Cap modeling solution can predict the observed material response when subjected to blast loading. This modeling formulation is suitable to be implemented and can be used to conduct virtual experiments by subjecting various structural elements to different blast configurations in order to predict the material response when blast testing is not a feasible option.
References
- N L Carey JJ Myers (2011) Discrete fiber reinforced polymer systems for repair of concrete structures: polyurea-fiber characterization results. American Concrete Institute (ACI) Special Journal Publication 275: 1-14.
- NL Carey (2012) Discrete fiber-reinforced polyurea systems for infrastructure strengthening and blast mitigation. PhD Dissertation, Missouri University of Science and Technology, Rolla, MO pp. 321.
- KJ Knox, MI Hammons, TT Lewis, JR Porter (2000) Polymer materials for structural retrofit, Proceedings of the 29th Department of Defense Explosives Safety Seminar, New Orleans, LA, USA.
- JS Davidson, JR Porter, RJ Dinan, MI Hammons, JD Connell, et al. (2004) Explosive testing of polymer retrofit masonry walls. Journal of Performance of Constructed Facilities 18: 100-106.
- CF Johnson, TR Slawson, TK Cummins, JL Davis (2004) Concrete masonry unit walls retrofitted with elastomeric systems for blast loads. 24th Army Science Conference, Orlando, FL, USA.
- JT Baylot, B Bullock, TR Slawson, SC Woodson (2005) Blast response of lightly attached concrete masonry unit walls. Journal of Structural Engineering 131: 1186-1193.
- JS Davidson, JW Fisher, MI Hammons, JR Porter, RJ Dinan, et al. (2005) Failure mechanisms of polymer-reinforced concrete masonry walls subjected to blast, Journal of Structural Engineering 131: 1194-1205.
- TD Hrynyk, JJ Myers (2007) Static evaluation of the out-of-plane behavior of URM infill walls utilizing modern blast retrofit systems. Center for Infrastructure Engineering Studies (CIES), University of Missouri - Rolla, Rolla, MO, USA pp. 202.
- MG Oesterle (2009) Blast simulator wall tests: experimental methods and mitigation strategies for reinforced concrete and concrete masonry. PhD Dissertation, University of California, San Diego, CA, USA, pp. 703.
- Y Tanizawa, JJ Myers (2009) In-plane behavior of strengthened unreinforced masonry infill walls with alternative wood-fiber fly ash material. Center for Infrastructure Engineering Studies (CIES), Missouri University of Science and Technology, Rolla, MO, USA, pp. 110.
- Coughlin (2008) Contact charge blast performance of fiber reinforced and polyurea coated concrete vehicle barriers. Master's thesis, Pennsylvania State University, University Park, PA pp. 123.
- NL Carey, JJ Myers (2009) Blast and impact resistance of hybrid systems for barrier and wall panel applications. Center for Infrastructure Engineering Studies (CIES), Missouri University of Science and Technology, Rolla, MO, USA pp. 225.
- ME Tinsley, JJ Myers (2007) Investigation of a high-volume fly ash-wood fiber material subjected to low-velocity impact and blast loads. Center for Infrastructure Engineering Studies (CIES), University of Missouri- Rolla, Rolla, MO, USA pp. 178.
- T Viswanath (2007) Experimental study on the impact resistance of polyurea coated concrete, Master's thesis. Pennsylvania State University University Park, PA pp. 69.
- Greene CE, Myers JJ (2013) Flexural and Shear Behavior of Reinforced Concrete Members Strengthened with a Discrete Fiber-Reinforced Polyurea (DFRP) System. American Society of Civil Engineering - Journal of Composites in Construction 17(1): 108-116.
- B Lu (2005) Application of displacement-based design method to blast-resistant reinforced concrete structures. PhD Dissertation, University of Missouri - Rolla, Rolla, MO, USA pp. 104.
- LSTC (2007) LS-DYNA keyword user's manual. volume I, version 971, Livermore Software Technology Corporation, Livermore, CA, USA.
- HQ (1967) Department of the Army, Field manual 5-25. explosives and demolitions, Government Printing Office, Washington DC, USA.
- Ottosen NS (1977) A Failure Criterion for Concrete. Journal of the Engineering Mechanics Division 103(4): 527-535.
- Broadhouse BJ, GJ Attwood (1993) Finite Element Analysis of the Impact Response of Reinforced Concrete Structures using DYNA3D. Proceedings of Structural Mechanics in Reactor Technology (SMiRT) 12, University of Stuttgart Germany Elsevier Science Publishing.
- MM Swisdak, JM Ward (2001) Department of Defense Explosives Safety Board Blast Effects Computer (BEC) - Version 5.0.
- LJ Malvar, JE Crawford (1998) Dynamic increase factors for concrete. 28th Department of Defense Explosives Safety Board Seminar, Orlando, FL, USA.
- Simo JC, JG Kennedy S Govindjee (1988) Non-Smooth Multisurface Plasticity and Viscoplasticity. Loading/Unloading Conditions and Numerical Algorithms. International Journal for Numerical Methods in Engineering 26: 2161-2185.
- Schwer LE, YD Murray (1994) A Three Invariant Smooth Cap Model with Mixed Hardening. International Journal for Numerical and Analytical Methods in Geomechanicsn 18: 657-688.
- YD Murray (2007) User's manual for LS-DYNA concrete material model 159. Report No. FHWA-HRT-05-062, US Department of Transportation, Federal Highway Administration, USA.
- Kai Xu, Yong Lu (2006) Numerical simulation study of spallation in reinforced concrete plates subjected to blast loading. Computers and Structures 84: 431-438.
- JK Paik, AK Thayamballi (2003) Ultimate Limit State Design of Steel-Plated Structures. John Wiley & Sons Ltd, Chichster, England.
- TE Tay, HG Ang, VPW Shim (1995) An empirical strain rate-dependent constitutive relationship for glass-fibre reinforced epoxy and pure epoxy. Composite Structures 33: 201-210.
- S Barré, T Chotard, ML Benzeggagh (1996) Comparative study of strain rate effects on mechanical properties of glass fibre-reinforced thermoset matrix composites. Composites Part A: Applied Science and Manufacturing 27: 1169-1181.
- CM Roland, JN Twigg, Y Vu, PH Mott (2007) High strain rate mechanical behavior of polyurea. Polymer 48: 574-578.
- D Asprone, E Cadoni, A Prota, G Manfredi (2009) Strain-rate sensitiveness of a pultruded E-glass/polyester composite. Journal of Composites for Construction 13: 558-564.
- J Shim, D Mohr (2009) Using split Hopkinson pressure bars to perform large strain compression tests on polyurea at low, intermediate and high strain rates. International Journal of Impact Engineering, 36: 1116-1127.

Top Editors
-

Mark E Smith
Bio chemistry
University of Texas Medical Branch, USA -

Lawrence A Presley
Department of Criminal Justice
Liberty University, USA -

Thomas W Miller
Department of Psychiatry
University of Kentucky, USA -

Gjumrakch Aliev
Department of Medicine
Gally International Biomedical Research & Consulting LLC, USA -

Christopher Bryant
Department of Urbanisation and Agricultural
Montreal university, USA -

Robert William Frare
Oral & Maxillofacial Pathology
New York University, USA -

Rudolph Modesto Navari
Gastroenterology and Hepatology
University of Alabama, UK -

Andrew Hague
Department of Medicine
Universities of Bradford, UK -

George Gregory Buttigieg
Maltese College of Obstetrics and Gynaecology, Europe -

Chen-Hsiung Yeh
Oncology
Circulogene Theranostics, England -
.png)
Emilio Bucio-Carrillo
Radiation Chemistry
National University of Mexico, USA -
.jpg)
Casey J Grenier
Analytical Chemistry
Wentworth Institute of Technology, USA -
Hany Atalah
Minimally Invasive Surgery
Mercer University school of Medicine, USA -

Abu-Hussein Muhamad
Pediatric Dentistry
University of Athens , Greece

The annual scholar awards from Lupine Publishers honor a selected number Read More...


