


Lupine Publishers Group
Lupine Publishers
ISSN: 2637-4668
Research article(ISSN: 2637-4668) 
Modeling of Enterococcus Faecalis Transport Influenced by Variation of Heterogeneous Velocity and Dispersions in Kolo Creek Volume 4 - Issue 2
Received: January 04, 2021 Published: January 26, 2021
Corresponding author: Ezeilo FE, Department of Civil Engineering, Rivers State University of Nkpolu Oroworukwo, Port Harcourt, Nigeria
DOI: 10.32474/TCEIA.2021.04.000183
Abstract
Dispersion of Enterococcus faecalis was monitor in the study environment based on their heterogeneity in the creek, this shows serious concern base on rate of concentration from microbial analysis carried in the creek, the study determined the predominant factors that developed the heterogeneous dispersion in the transport of Enterococcus faecalis in the study area, this condition generated exponential phase based on the effect of the dispersion through the heterogeneous velocities of the creek, this expression implies that the migration and other causes of the contaminant deposition are influenced by these factors, the growth rate from exponential phase including high to low concentration are determined based on this predominant influential parameters, the derived modeling system expressed the behaviour of the microbes, this was carried outby simulating the behaviour of these parameters to determined their various effect on the transport of Enterococcus faecalis in the creek. The concentration ranged from 0.030278489-1.316392604, 0.034087772- 0.922131816, 0.024755029-0.39245102, 0.020945746-0.203891513, 0.024564565-0.150752015, 0.040754017-0.150752015, 0.03123081-0.23763553, 0.040754017- 0.287886202. The migration process based on different level of concentration in the creek were thoroughly observed, the predictive were compared with experimental data, and both parameters expressed best fits correlation, the study has developed high level of its significant through these parameters influence, it has also identifies the variations of other substance through the physiochemical analysis that could have increase the growth rate despite the dispersion influence through velocities of flow in the creek.
Keywords: Enterococcus faecalis; Heterogeneous dispersion and creek
Introduction
There is notable important challenge that has been examined to apply in improving water quality including the estimation of the pathogen contamination in stream water, the problem remains our weak understanding of the combined impacts of bacterial loadings from point and non-point sources, others challenge also includes the (diffuse) sources and their impact on in-stream pathogen concentrations Pandey 2012 [1], Eluozo and Ezeilo 2018a [2], Eluozo and Ezeilo 2018b [3]. To solve these problem mathematical models that incorporate the influence of watershed characteristics and hydrology has observed to a useful tool to calculate in-stream pathogen concentrations, these are derived strategy for watershed scale water quality improvements. Some experts have carried study that focused on developing models for predicting in-stream pathogen concentrations based on the landscape characteristics and hydrology of watershed Eluozo and Amadi 2019a [4], Eluozo and Amadi 2019b [5] Jamieson 2004, Jamieson 2005a, 2005b [6,7]. The high rain intensities events occur in land shortly after manure application to cropped land experienced overland flow, these in turn delivered large quantities of bacteria and potentially pathogens into surface waters Soupir et al. 2006 [8], Eluozo and Ezeilo 2018c [9]. Moreover, E. coli in that is injected in manure can be transported to streams through tile drainage systems instead of overland flow Dorner et al. 2006 [10]. This Effluent from CAFOs contains high levels of E. coli according to Mallin and Cahoon 2003 [11] Eluozo and Afiibor 2019 [12], Eluozo and Afiibor 2018 [13], these also experience an increase in stream with high rates of E. coli due to the influx of animal waste Armstrong et al. 2009 [14]; Centner and Feitshans, 2006; Jagai et al., 2010; Lichtfouse et al. 2010 [15] Eluozo and Oba 2018 [16].
Theoretical Background
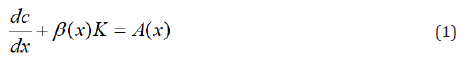
Multiplying the equation through byC[x], we have:
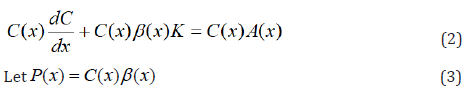
Then Equation (2), we have:
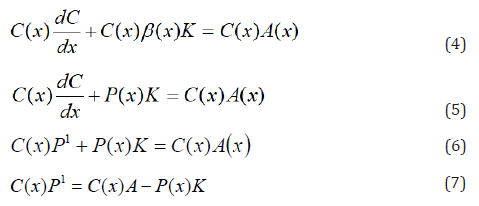
Differentiate 2nd term on the left-hand side of (6) with respect to x, we have
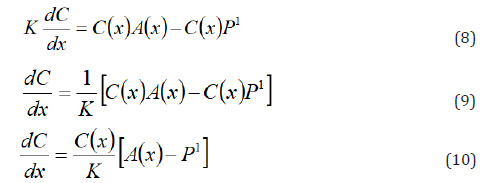
Applying separation of variables, by dividing through by C(x) and cross multiply by dx, gives:
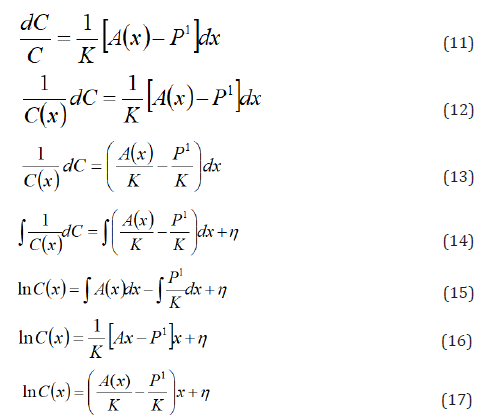
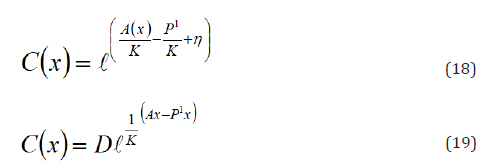
Taking exponent of both side of the equation
Materials and Method
Standard laboratory experiment where performed to monitor Enterococcus faecalis using the standard method for the experiment at different sample at different station, the water sample were collected in sequences base on specification stipulated at different locations, this samples collected at different location generated variations at different distance producing different Enterococcus faecalis concentration through physiochemical analysis, the experimental result were compared with the theoretical values for model validation [17-20].
Results and Discussion
Figure one presented explained Enterococcus faecalis concentration through graphical representation, the trends experienced gradual increase to the optimum growth rate recorded at thirty-six meters distance, while experimental and predictive values experienced slight fluctuation to the optimum level thus observed best fits correlation. The Figure observed similar condition from figure one but experienced fluctuation between fifteen and twenty meters and finally maintained linear growth to the optimum rate recorded at the same distance, figure three developed rapid increase but experienced vacillation between fifteen and thirty, but suddenly developed homogeneous growth between thirty two to thirty six meters distance, the predictive and experimental values maintained similar trend, figure four observed close growth rate condition just like figure three, but with fluctuation based on the influence from these predominant influential parameters, whereby fluctuation were observed between eighteen and twenty eight, but sudden observed linear increase to optimum level recorded at thirty six meter distance, figure five observed rapid growth rate to the optimum at twenty four meters distance but experienced rapid decrease from twenty six to thirty six meters at the lowest rate, five six experienced rapid fluctuation from the lowest at three meters to the optimum at the center, but finally fluctuate with decrease as the distance increase to the lowest rate of concentration recorded at thirty six meters, but not lower than the initial concentration [21]. The experimental values experienced vacillation from the lowest rate of concentration to optimum level at twenty meters, but gradually observed decrease closely to the initial concentration. Figure seven observed rapid increase between the predictive and experimental values to the optimum rate recorded at thirty-two, but experienced slight decrease between thirty-two and thirty-six.
Figure 1: Predictive and Experimental Values of Enterococcus faecalis Concentration at Different Distance

Figure 2: Predictive and Experimental Values of Enterococcus faecalis Concentration at Different Distance.

Figure 3: Predictive and Experimental Values of Enterococcus faecalis Concentration at Different Distance.

Figure 4: Predictive and Experimental Values of Enterococcus faecalis Concentration at Different Distance.

Figure 5: Predictive and Experimental Values of Enterococcus faecalis Concentration at Different Distance.

Figure 6: Predictive and Experimental Values of Enterococcus faecalis Concentration at Different Distance.

Figure 7: Predictive and Experimental Values of Enterococcus faecalis Concentration at Different Distance.

Figure 8: Predictive and Experimental Values of Enterococcus faecalis Concentration at Different Distance.

Table 1: Predictive and Experimental Values of Enterococcus faecalis Concentration at Different Distance.

Table 2: Predictive and Experimental Values of Enterococcus faecalis Concentration at Different Distance.

Table 3: Predictive and Experimental Values of Enterococcus faecalis Concentration at Different Distance.

Table 4: Predictive and Experimental Values of Enterococcus faecalis Concentration at Different Distance.

Table 5: Predictive and Experimental Values of Enterococcus faecalis Concentration at Different Distance.

Table 6: Predictive and Experimental Values of Enterococcus faecalis Concentration at Different Distance.

Table 7: Predictive and Experimental Values of Enterococcus faecalis Concentration at Different Distance.

Table 8: Predictive and Experimental Values of Enterococcus faecalis Concentration at Different Distance.

Conclusion
The study has express the behaviour of the system in terms the microbe’s growth rate in kolo creek, the study expressed the behaviour under the influenced from heterogeneous dispersion of in the creek, the dispersion were influenced by heterogeneous velocity of flow in the creek, the transport load of the contaminant were monitored based on these factors, the migration rate of the contaminant experience exponential phase in the transport system, this concept was observed from the trend through the graphical representation, slight fluctuation were experienced base these influential parameters in the system in such heterogeneous dispersions, these condition can also be attributed to some disposition of physiochemical substance that deposited under fluctuation, this factors also affect the concentration and the rate of transport of the microbes in the creek, while in some other location the dispersion developed high to low rate of concentration, these condition experienced influence from the dispersion state and thus exhibited high to lowest concentration with some level of vacillation on the migration rates, the study has expressed the behaviour of Enterococcus faecalis deposition in the study environment, the derived simulation values monitor the behaviour of the contaminant based on these predominant factors, the parameters have affect the deposition and migration of the contaminant at different locations, these condition shows various concentration at different station point in the study environment, the study has definitely expressed the of dispersion of Enterococcus faecalis contaminant from the initial point of discharge [22-24]. The derived simulation parameters were compared with experimental values, and both parameters expressed best fits correlation, the study is imperative because the effect from variation of dispersion has been determined, other parameters that were also monitor such as velocity of flow that determined the heterogeneous state of the dispersion were thoroughly evaluated in the study.
References
- Pandey PK (2012) Modeling. In: Stream Escherichia coli Concentrations Graduate Dissertation Iowa state university pp.62-75.
- Eluozo SN, Ezeilo FE (2018) Numerical Modeling of Nocardia Migration Influenced Transport Pressured by Dispersion and Velocity in Fine Sand Formation in Wetland Environment. Journal of Water Resources Engineering and Management 5(1): 25-32.
- Eluozo SN, Ezeilo FE (2018) Modeling Heterogeneous Porosity in Alluvia Plain Deposition in Deltaic Formation. Recent Trend in Civil Engineering & Technology 8(2): 1-10.
- Eluozo SN, Amadi CP (2019) Modeling and Simulation of Legionella Transport Influenced by Heterogeneous Velocity in Stream. Journal of Water Resource Engineering and Management. 6(2):25-31.
- Eluozo SN, Amadi CP (2019) Velocity and Oxygen Deficit Influence on the Transport of Francisela in Eleme Creek. Journal of Water Resource Engineering and Management. 6(2): 43-48.
- Jamieson R, Gordon R, Joy D, Lee H (2004) Assessing microbial pollution of rural surface waters: A review of current watershed scale modeling approaches. Agricultural Water Management 70(1): 1-17.
- Jamieson R, Joy DM, Lee H, Kostaschuk R, Gordon R (2005a) Transport and deposition of sediment-associated Escherichia coli in natural streams. Water Research 39(12): 2665-2675.
- Jamieson RC, Joy DM, Lee H, Kostaschuk R, Gordon RJ (2005b) Resuspension of sediment-associated Escherichia coli in a natural stream. Journal of Environmental Quality 34(2): 581-589.
- Soupir ML, Mostaghimi S, Yagow ER, Hagedorn C, Vaughan DH (2006) Transport of fecal bacteria from poultry litter and cattle manures applied to pastureland. coli and Enterococci in dairy cowpats. Water Air and Soil Pollution 169: 125-136.
- Ezeilo FE, Eluozo SN (2018) Dispersion and Storage Coefficient Influences on Accumulation of Frankia Transport in Heterogeneous Silty and Fine Sand Formation, Warri Delta State of Nigeria. International Journal of Mechanical and Civil Engineering 4(4): 1-16.
- Dorner SM, Anderson WB, Slawson RM, Kouwen N, Huck PM (2006) Hydrologic modeling of pathogen fate and transport. Environ Sci Technol 40(15): 4746-4753.
- Mallin MA, Cahoon LB (2003) Industrialized animal production-a major source of nutrient and microbial pollution to aquatic ecosystems. Population and Environment 24(5): 369-385.
- Eluozo SN, Afiibor BB (2019) Mathematical Model to Monitor the Transport of Bordetella Influenced by Heterogeneous Porosity in Homogeneous Gravel Depositions. Journal of Geotechnical Engineering 6(1).
- Eluozo SN, Afiibor BB (2018) Dispersion and dynamics influences from phosphorus deposition on e-coli transport in coastal deltaic Lake. MOJ Applied Bionics and biomechanics 2(5).
- Armstrong SD, Smith DR, Joern BC, Owens PR, Leytem AB, et al. (2009) Transport and Fate of Phosphorus during and after Manure Spill Simulations. J Environ Qual 39(1):345-352.
- Lichtfouse E, Armstrong SD, Smith DR, Owens PR, Joern B, et al. (2010) Manure Spills and Remediation Methods to Improve Water Quality. In: Genetic Engineering, Biofertilization, Soil Quality and Organic Farming Vol.4. Springer Netherlands.
- Eluozo SN, Oba AL (2018) Modeling and simulation of cadmium transport influenced by high degree of saturation and porosity on homogeneous coarse depositions. MOJ Civil Engineering 4(4).
- Ezeilo FE, Eluozo SN (2018) Linear Phase Velocity Effect on Accumulation of Zinc in Homogeneous Fine Sand Applying Predictive Model. International Journal of Mechanical and Civil Engineering 4(4): 17-32.
- Eluozo SN, Ezeilo FE (2018) Predicting the Behaviour of Borrelia in Homogeneous Fine Sand in Coastal Area of Bakana. Recent Trend in Civil Engineering & Technology 8(2): 1-19.
- Eluozo SN, Oba AL (2018) Predicting heterogeneous permeability coefficient pressured by heterogeneous seepage on coarse deposition. MOJ Civil Engineering 4(4).
- Guber AK, Shelton DR, Pachepsky YA, Sadeghi AM, Sikora LJ (2006) Rainfall-induced release of faecal coliforms and other manure constituents: Comparison and modeling. Appl Environ Microbiol 72(12): 7531–7539.
- Jamieson R, Gordon R, Joy D, Lee H (2004) Assessing microbial pollution of rural surface waters: A review of current watershed scale modeling approaches. Agricultural Water Management 70(1): 1-17.
- Jamieson R, Joy DM, Lee H, Kostaschuk R, Gordon R (2005a) Transport and deposition of sediment-associated Escherichia coli in natural streams. Water Research 39(12): 2665-2675.
- Jamieson RC, Joy DM, Lee H, Kostaschuk R, Gordon RJ (2005b) Resuspension of sediment-associated Escherichia coli in a natural stream. Journal of Environmental Quality 34(2): 581-589.


-

Mark E Smith
Bio chemistry
University of Texas Medical Branch, USA -

Lawrence A Presley
Department of Criminal Justice
Liberty University, USA -

Thomas W Miller
Department of Psychiatry
University of Kentucky, USA -

Gjumrakch Aliev
Department of Medicine
Gally International Biomedical Research & Consulting LLC, USA -

Christopher Bryant
Department of Urbanisation and Agricultural
Montreal university, USA -

Robert William Frare
Oral & Maxillofacial Pathology
New York University, USA -

Rudolph Modesto Navari
Gastroenterology and Hepatology
University of Alabama, UK -

Andrew Hague
Department of Medicine
Universities of Bradford, UK -

George Gregory Buttigieg
Maltese College of Obstetrics and Gynaecology, Europe -

Chen-Hsiung Yeh
Oncology
Circulogene Theranostics, England -
.png)
Emilio Bucio-Carrillo
Radiation Chemistry
National University of Mexico, USA -
.jpg)
Casey J Grenier
Analytical Chemistry
Wentworth Institute of Technology, USA -

Hany Atalah
Minimally Invasive Surgery
Mercer University school of Medicine, USA -

Abu-Hussein Muhamad
Pediatric Dentistry
University of Athens , Greece
