


Lupine Publishers Group
Lupine Publishers
ISSN: 2637-4668
Research Article(ISSN: 2637-4668) 
Influence of Two Orthogonal and Horizontal Seismic Excitation Components of Strong Ground Motion on the Identification of Eigen-Frequencies of Asymmetric Buildings Volume 4 - Issue 3
Received: August 25, 2022; Published: September 15, 2022
Corresponding author: Triantafyllos K Makarios, Professor, Institute of Structural Analysis and Dynamics of Structure, School of Civil Engineering, Aristotle University of Thessaloniki, Greece.
DOI: 10.32474/TCEIA.2022.04.000189
Abstract
The present article investigates the simultaneous effect of two orthogonal and horizontal components of strong ground motion on the identification of dynamic characteristics and, in particular, the eigen-frequencies and mode shapes of spatial asymmetric buildings. It is well known that one of the major problems in identification of structure mode-shapes via strong seismic excitation (not ambient excitation) at the base, is the influence of external excitation on the response results, an influence effect that must be eliminated to detect the actual structural dynamic characteristics. Specifically, in the case of an earthquake event, it is true that there are three seismic excitation components along the three axes (two horizontal and one vertical). In the present paper, in order to identify the building eigen-frequencies, a methodology for removing the influence of seismic excitation of strong ground motion along the two horizontal axes is presented. For verification reasons, only simulated data are used, and next the response modal time-histories method can be applied to find the fundamental building mode shapes.
Keywords: Identification of eigen-frequencies; Harmonic excitation; Strong ground motion; Instrumentation form.
Introduction
It is well-known that the identification of dynamic characteristics of an existing structure through instrumental measurements (i.e., response acceleration time-histories) contributes to reduce the uncertainties of the numerical simulation of the structure, in order to perform an advanced seismic non-linear analysis, such as the calculating the building seismic capacity. Besides, the identification of eigen-frequencies of a structure supports the simple monitoring of structural integrity examined building. The achievement of the identification of dynamic characteristics via instrumental measurements is based on the fact that the response acceleration time-his tories contain the structure modal responses and thus there must be some way to identify the mode shapes of a structure. However, here there are two fundamental problems: (a) The existence of external excitation has a significant effect on the structure response, especially after to the short transient vibration of the structure, and therefore the influence of external excitation must be removed. (b) In fact, the measured structure response is complex and is not only due to the external base excitation. Indeed, in the case of various environmental excitations, it is common, a variety of causes to coexist simultaneously at different points on the structure. For example, the movement of vehicles (traffic) near to the measured structure, which traffic causes vibrations in the ground, first, transmitted to the base, while at the same time a strong wind may acts directly on the superstructure (e.g. on the floors of a structure). In the last case, the structure base does not affect by the wind loading. Thus, when the response accelerations are recorded on a floor of a structure, may be have affected or may be have not affected by the external dynamic loadings, while the separation of these loading from the records is impossible. The result of all these is the following; the final response of the structure dues to many causes of dynamic loadings, which are not measurable, generally, and therefore is de facto impossible to remove they, even if there was a safe remove technique.
Thus, knowing the above-mentioned two issues, many methodologies have been developed to identify the dynamic characteristics, based on the response acceleration data, only, provided that the external excitations (whatever they are) maintains low amplitudes of vibrations. In other words, in order to achieve right identification of dynamic characteristics of a structure using acceleration results only, both, the strong ground motion and the strong wind pressure on the superstructure do not must exist. These methodologies are more known as operational modal analysis, and the output only modal analysis or ambient modal analysis. However, these technics are unsuitable for use in case of strong ground motion where the Peak Ground Acceleration are generally upwards the 5% of g (where g= gravity acceleration) [1]. This issue has been investigated in preliminary form in the MSc diploma dissertation of the first Author (who is now working at her Doctoral Thesis that is in full progress) [2]. The present article attempts to cover this gap, where an identification technique of the dynamic characteristics of an asymmetric multi-storey building submitted in seismic ground strong motion along two horizontal directions (perpendicular each other) is presented. It is worth noting that on this building, two horizontal seismic components of strong motion, perpendicular each other, are acting, while simulated data have been used, only, for verification reasons. In the proposed method the input base excitation is always known, as the earthquake acts directly on the structure base.
Identification of eigen-frequency of single-degree- of-freedom system under base harmonic excitation. Numerical application
Consider the SDOF system with its features shown in Figure 1. The base Ο of this system excited by complex harmonic ground motion shown in Figure 2. This complex excitation of Figure 2 was obtained by the superposition of the following sinusoidal functions , where:
Figure 1. Single Degree of Freedom oscillator (lengths in meters and forces in kN)

Figure 2. Composition of three sinusoidal excitations F1(t)+F2(t)+F3(t)

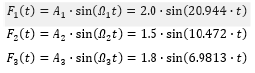
The natural frequencies of these three harmonic excitations are respectively:

The Fast Fourier Transform (FFT) of the excitation of Figure 2 gives the FFT diagram shown in Figure 3. We can see that the FFT diagram of the excitation actually shows peaks at exactly the three natural frequencies of each of the harmonic motions. Figure 4 shows the FFT diagram of the response at the mass location m of the SDoF system in which is observed only the frequencies due to the external excitation. On the contrary, seeing on the Figure 3 on the one hand the actual eigenfrequency of the SDoF system Figure 1 is obscure, but on the other hand certainly exist. Figure 5 shows the diagram of the ratio of the FFT amplitude of the response to the corresponding FFT amplitude of the excitation of the SDoF base, for each frequency separately. In this diagram, the SDoF properties are just beginning to be discernible, but there are and other peaks (at frequencies 7.031 Hz and 11.328 Hz) which are not belong to the SDoF system but are a product of numerical instability due to the division by very small numbers of FFT amplitudes of excitation. This phenomenon of the numerical instability is very common in such numerical analysis and must be removed using appropriate techniques, which are beyond of the scope of the present paper. Figure 6 shows the diagram of the ratio of the Power Spectral Density (PSD) amplitude of the response to the corresponding PSD amplitude of the external base excitation, for each frequency separately. The PSD symbolizes the function of the auto-spectral density function or better known as the Power Spectrum Density (PSD). In order to calculate the Auto-Spectral Density function, the Wiener-Khintchine theorem is applied, according to which “Both the energy density spectrum of an energy signal and the power density spectrum of a power signal are equals with the amplitude spectrum of the exponential Fourier series (F.F.T.) of the signal autocorrelation function”. Namely, for the practical calculation of the Power Spectral Density (PSD) function two simple steps are followed: In the first step, the auto-correlation function of a signal is calculated and in the second step, the FFT diagram of the auto-correlation function is calculated. The last FFT diagram of the auto-correlation function is the asked Power Spectral Density diagram.
Figure 3. FFT diagram of external excitation F1(t)+F2(t)+F3(t)

Figure 4. FFT diagram of response acceleration (recorded on the mass of SDoF system). The eigen-frequency of the SDoF is not detected.

Figure 5. Diagram of ratios amplitude FFT of response acceleration (recorded on the mass of SDoF system). The eigen-frequency of the SDoF is just beginning to be discernible, but there are and other peaks (at frequencies 7.031 Hz and 11.328 Hz) which are not belong to the SDoF system.

Figure 6. Diagram of ratios amplitude PSD of response acceleration (recorded on the mass of SDoF system). The eigen-frequency of the SDoF is pure identified.

The diagram of Figure 6 indisputably shows the natural frequency (calculated with a slight deviation as due to the mathematical processing of the composition and signal decomposition, but also due to the SDOF damping effect). The above numerical example shows the unequivocal conclusion that in order to highlight the true eigen-frequencies of a structure by analyzing measured response accelerograms due to strong excitation of the base, it is necessary to remove the influence of the external excitation. Thus, the methodologies where have been supported on the response data, only, (such as “stochastic subspace identification”, “operational modal analysis”, “output only modal analysis”, “ambient modal analysis”) are fully unsuitable for use in case that the structure is excited by strong ground motion.
Identification of eigen-frequencies of asymmetric building under strong ground motion. Numerical Applications
Theory
Consider an asymmetric N-storey building Figure 7 which is subjected to a seismic ground motion consists of two different but simultaneous ground acceleration time-histories and along the x and y-axes, respectively. Figure 7 also shows the proposed instrumentation points (form) where the three uniaxial accelerometers per floor have been installed, to record the horizontal movements due to above-mentioned seismic excitation [3,4]. It is worth noting that from the three locations of uniaxial accelerometers per floor, the two uniaxial accelerometers must be located on the two parallel sides of the building along the positive x or y-axis (in this case x-axis, the first two accelerometers have been installed along local degrees of freedom) of the reference system Mxy. These two accelerometers must have as much distance as possible in order to more reliably calculate the rotation about the vertical axis of the diaphragm, while the third position of the third accelerometer must be perpendicular with respect to the first two ones. In order to identify the actual natural frequencies of the building, the follow methodology is presented:
i. Calculation of Fast Fourier Transform (FFT) and Power Spectra Density (PSD) diagrams of the acceleration response time histories both for the three locations on each floor and for the two seismic components of ground motion. In particular, for the response accelerograms of the DoFs (first floor) and (n-floor) were calculated the and diagrams, where και . Also, from the two accelerograms of the external base excitation (two seismic components), the , as well as the corresponding are calculated.
Figure 7. The N-storey asymmetric building

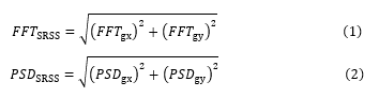
ii. The rule of square root of the sum of squares is applying on the FFT and PSD diagrams of the two seismic ground components, that is, the calculation of the square means and by the following equations:
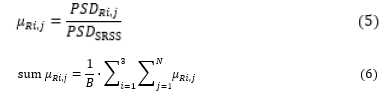
iii. The ratio of the response FFT functions by the ground is calculated for each record. Thus, the ratios according to equation (3) and then the summary by equation (4) are calculated, where A,B,C,D are simple coefficients that change the amplitudes for comparison reasons:
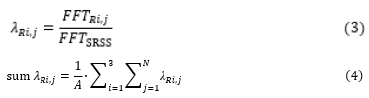
iv. The ratio of the response PSD functions by the ground is calculated for each recording. Thus, the ratios according to equation (5) and then the summary by equation (6) are calculated:
v. The functions of and are calculated according to the following equation (7) and (8):
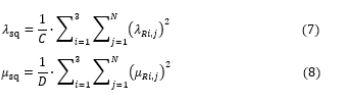
vi. The graphs of eq. (7) and eq. (8) shows peaks. The common peak values (or rather the frequency numerical average of the peak values) correspond to the real frequencies of the building with almost zero deviation.
It is worth noting that using this methodology, the influence of the external excitation on the response data is removed, thus, at least the first two or three natural frequencies of the building can be detected, which is particularly important for adequately monitoring of the building structural integrity or the sufficient documentation of the building numerical model. The proposed methodology is recommended for verification purposes to be repeated for at least three different seismic excitations, namely we must have six different seismic components of the base. Subsequently, and with the frequencies of the building now known, it is easy to calculate the corresponding mode shapes from the free vibration part of response accelerograms, by the modal time-histories method, using appropriate filters on the original corrected (without noise) response record [3-13].
Numerical Application
Consider an asymmetric two-storey building, as shown in the Figure 7. The total mass equals to and the mass moment of Inertia to each diaphragm. The building subjects in four different earthquakes consisting of two horizontal seismic components: (a) Thessaloniki Earthquake (June 20, 1978), (b) Kozani Earthquake (May 13, 1995) (c) A pair of artificial accelerograms (e) Athens Earth quake (September 7,1999). For these four earthquakes and always in accordance of Figure 7, the acceleration response time histories are obtained along the three degrees of freedom of the first floor (where the floor is denoted by the second index) and of the second floor, respectively.
According to the first step (i), FFT and PSD functions of all the above acceleration time histories are calculated. Furthermore, the mean square values of the FFT and PSD of the excitation are also calculated, i.e., and by equations (1) and (2). Afterwards, the ratios , and the parameters, are calculated Figures 8,9. Finally, Figures 10,11 show the ratios and as well as and for all the four earthquakes examined. The last two figures show as average values the first three frequencies, which, when compared to the values of the modal analysis, show a difference of less than 6.7 per thousand. Then, the modal time-histories method can be applied to find the mode shapes with now know the frequencies of the building using the part of free vibration for each record [1-3]. (Table 1,2)
Figure 8. Parameters λRi,j and λsq for (c) excitation. Distinguished the first three eigen-frequencies of the building.

Figure 9. Parameters μRi,j and μsq for (c) excitation.

Figure 10. Parameters λRi,j and λsq for all excitations.

Figure 11. Parameters μRi,j and μsq for all excitations.

Table 1: Estimated values of the first three eigen-frequencies from ratios λsq.

Table 2: Estimated values of the first three eigen-frequencies from ratios μsq.

Conclusions
A numerical procedure by which the influence of external strong ground motion on response acceleration time histories has been presented. Two numerical applications were given: The first one proves the existence of the problem and the second one demonstrates the solution proposed by the present methodology. Four different earthquakes have been used and the average values have been got by the estimated eigen-frequencies. The deviations are smaller than 6.7 per thousand from the actual modal analysis (simulated data). Afterwards, knowing the actual building eigenfrequencies, it is easy to calculate the modal shapes according to international literature using the free vibration parts of accelerograms [3-13].
References
- Overschee P, De Moor B (1996) Subspace Identification for Linear Systems. Kluwer Academic Publishers.
- Tziotziou A (2019) Identification of dynamic characteristics of buildings from response accelerograms, using simulated data.
- Makarios T (2012) Identification of the mode shapes of spatial tall multi-storey buildings due to earthquakes. The new "modal time-histories” method. Journal of the Structural Design of Tall & Special Buildings 9.
- Makarios T (203) Identification of building dynamic characteristics by using the modal response acceleration time-histories in the seismic excitation and the wind dynamic loading cases. CHAPTER 4 of Book “Accelerometers; Principles, Structure and Applications. Nova Science Publisher Inc.
- Makarios TK, Manolis G, Karetsou I, Papanikolaou M, Terzi V (2015) Modelling and identification of the dynamic response of an existing three-story steel stairway. COMPDYN 2015, 5th ECCOMAS Thematic Conference on Computational Methods in Structural Dynamics and Earthquake Engineering, Crete Island, Greece, p 25-27.
- Makarios T, Manolis G, Terzi V, Karetsou I (2017) Identification of dynamic characteristics of a continuous system: case study for a flexible steel stairway. 16th World Conference on Earthquake, 16WCEE 2017 (paper 1011), Santiago Chile, p 9-13.
- Dragos K, Makarios T, Karetsou I, Manolis G, Smarsly K (2018) Accommodating synchronization-induced errors in operational modal analysis. Proccedings of 16th European Conference on Earthquake Engineering (16th ECEE), Thessaloniki June p 18-21.
- Dragos K, Makarios T, Karetsou I, Manolis GD, Smarsly K (2019) Synchronization-Induced Error in Operational Moadal Analysis: Corrective Measures. Submitted to the 12th Hellenic Society of Theoretical and Applied Mechanics (HSTAM) International Congress on Mechanics, 20-25.
- Manolis GD, Makarios TK, Terzi V, Karetsou I (2015) Mode shape identification of an existing three-story flexible steel stairway as a continuous dynamic system. Theoretical and Applied Mechanics 42 (3): 151-156.
- Manolis GD, Makarios TK, Katakalos K, Dadoulis G, Tziotziou A, et al. (2021) Field Measurements and Numerical Modeling of a Flexible Pylon. A pilot study on Structural Health Monitoring. Theoretical and Applied Mechanics pp 352-367.
- Dragos K, Makarios T, Karetsou I, Manolis G, Smarsly K (2020) Detection and Correction of Synchronization-induced Errors in Operational Modal Analysis. Journal of Archive of Applied Mechanics, Springer. pp 1547-1567,
- Makarios T, Baniotopoulos C (2014) Wind Energy Structures: Modal Analysis by the Continuous Model Approach. Journal of Vibration and Control 20 (3): 395-405.
- Makarios T, Baniotopoulos C (2015) Modal analysis of wind turbine tower via its continuous model with partially fixed foundation. International Journal of Innovative Research in Advanced Engineering 2(1): 14-25.


-

Mark E Smith
Bio chemistry
University of Texas Medical Branch, USA -

Lawrence A Presley
Department of Criminal Justice
Liberty University, USA -

Thomas W Miller
Department of Psychiatry
University of Kentucky, USA -

Gjumrakch Aliev
Department of Medicine
Gally International Biomedical Research & Consulting LLC, USA -

Christopher Bryant
Department of Urbanisation and Agricultural
Montreal university, USA -

Robert William Frare
Oral & Maxillofacial Pathology
New York University, USA -

Rudolph Modesto Navari
Gastroenterology and Hepatology
University of Alabama, UK -

Andrew Hague
Department of Medicine
Universities of Bradford, UK -

George Gregory Buttigieg
Maltese College of Obstetrics and Gynaecology, Europe -

Chen-Hsiung Yeh
Oncology
Circulogene Theranostics, England -
.png)
Emilio Bucio-Carrillo
Radiation Chemistry
National University of Mexico, USA -
.jpg)
Casey J Grenier
Analytical Chemistry
Wentworth Institute of Technology, USA -

Hany Atalah
Minimally Invasive Surgery
Mercer University school of Medicine, USA -

Abu-Hussein Muhamad
Pediatric Dentistry
University of Athens , Greece
