Lupine Publishers Group
Lupine Publishers
Menu
ISSN: 2637-4668
Research Article(ISSN: 2637-4668) 
Exploring the Impact of Urban Growth on Surface Waterbody Area Loss in Khulna City using GIS Techniques Volume 3 - Issue 3
Md Marufuzzaman*, Mst Mahbuba Khanam and Md Kamrul Hasan
- Department of Urban & Regional Planning, Pabna University of Science & Technology (PUST), Bangladesh
Received: January 30, 2019; Published: May 10, 2019
Corresponding author: Md. Marufuzzaman, Undergraduate Student, Department of Urban & Regional Planning, Pabna University of Science & Technology (PUST), Narail, Bangladesh
DOI: 10.32474/TCEIA.2019.03.000165
Abstract
Surface water body ensures environmental sustainability, natural beauty and temperature balance in the urban area. Nowadays the surface water bodies is being filled up to meet the rapid urbanization. The aim of this study is to find out the location and the amount of filled up surface water body area in Khulna City Corporation (KCC) during the last twenty years (1998-2018). Satellite image analysis by geographic Information System (GIS) provides much more accurate result about the land cover change of any area. In this regard supervised image classification method of GIS technology has been applied in this study on Landsat satellite image to identify the location and amount of filled up surface water body area. According to the result, there is a significant land cover changed happen in the last twenty years in Khulna city area and a considerable amount of surface water body area has been replaced by the built-up urban space. Surface water body area not only conserves biodiversity but also retain an excessive amount of water during rainy seasons. Without proper management of surface water body area, Khulna city may face frequent urban flood during rainy seasons, which may increase the sufferings of urban peoples.
Keywords: Khulna city corporation; Surface water body area; Urban development; Remote sensing techniques
Abbreviations: KCC: Khulna City Corporation; GIS: Geographic Information System; RS: Remote Sensing
Introduction
Surface water body has a significant impact on biodiversity conservation but in recent years the increasing rate of urbanization reduce the significant amount of surface water body area which creates a vulnerable situation for urban biodiversity. In recent times urbanization is considered a major reason for rapid land cover change all over the world. Global land use change significantly results from urban area growth and expansion [1]. Rapid population growth is interrelated with rapid urbanization which has become one of the major concerning issue for urban surface waterbody reduction. The urbanization process composed of several factors such as population growth, rural-urban migration and industrialization [2]. “Urban expansion is expected to increase 1.8–2.4% by 2030 at the cost of global cropland and 80% of global cropland loss from the urban expansion will take place in Asia and Africa” [3]. Therefore, rapid urban growth and development change the landscape pattern from natural to urban land with various orientations [4]. The substantial growth of built-up areas resulted in a significant decrease in the area of surface waterbodies with other land cover [4]. The primary land use land cover (LULC) classes in Bangladesh are agricultural land, forest land vegetation, water bodies, and wetlands, built up and urban area [5]. In recent years Bangladesh has experienced a rapid rate of urbanization and most of them formed in an unplanned way [6]. Socio-economic development with a high rate of population growth in Bangladesh results in territorial expansion across the country [7].
Like another area of Bangladesh Khulna City Corporation (KCC) area is not on exception. Nowadays KCC has faced significant conversion of the water body area to built-up area for residential, industrial, and commercial purposes. Rapid population growth is the major reason behind this conversion of the surface water body area to the built-up area. According to the last census Khulna city-corporation had 663342 population [8], but in 2018 the City population rises very rapidly. The growth rate of the population of Khulna city represents an increasing trend that has a great adverse effect on land cover change across the area. In this regard, lots of ponds, lakes, wetland area are filled up by built-up urban space. In several studies, remote sensing data were used to assess land cover scenario for the different time period and it is very popular in recent time to get the accurate result about land cover change detection. Integrated Geographic Information System (GIS) and Remote Sensing (RS) techniques used to measure land cover change from one land cover type to another form therefore the aim of this study is to find out the location and the amount of area that converted from surface water body to built-up urban space within KCC for last 20 years regarding two different time periods: from 1998 to 2008 and from 2008 to 2018 with Geographic Information System (GIS) and Remote Sensing (RS) techniques. According to several studies as urbanization increase, the land becomes diverse in pattern and structure, that results in negative consequences to the biotic and abiotic resource [9]. Surface water body area in the urban area is one of the vital resources for a sustainable urban environment because it keeps the urban environment cool and provides habitat for the urban biodiversity. The loss of surface water body area also adversely affect the groundwater reserve and In present time groundwater level depletion in the urban area is a common issue in Bangladesh, therefore, it is very important to conserve surface water body area for a sustainable city. Conservation of surface water body area is also important for fire accident management in urban area In this regard the authority of Khulna City Corporation needs to protect the existing surface water body area through proper management.
Materials and Methods
Land cover of any urban area is very complex and it can change very rapidly, therefore it is much hard to accurately analyze the amount of urban land cover change with the primary survey. In this regard, this study is mainly based on secondary data. Landsat satellite images have been used as data for monitoring the land cover change of KCC area. In order to identify the water body area that has been filled up by built-up area, some set of procedures has been performed in this study to prepare land cover change map of KCC area for last 20 years. Geographic information system and remote sensing satellite image are commonly used for long term land cover change analyze, therefore this study used Geographic Information System (GIS) to systematically analyze the remotely sensed data with the help of Arc GIS 10.3 software. Supervised image classification method has been used to classify the land cover area of KCC into different categories for the year of 1998, 2008 and 2018.
Supervised image classification method uses the spectral signature for each land cover type to classify the land cover area of KCC into four classes as a water body, vegetation, bare soil and built-up urban area for the year of 1998, 2008 and 2018. “These are kind of techniques classify the whole image pixel by pixel based on each known type particular signature” [10]. Maximum likelihood parametric approach of has been used in this study which classifies the satellite image. After classification, the amount of different land cover for the year of 1998, 2008, and 2018 is calculated by multiplying the total amount of spectral signature area cover of each class with the cell area of the satellite image. To identify the location and area that is transformed from surface water body area to built-up urban space; combine tool from spatial analysis toolset of Arc GIS software has been applied for ten years interval of KCC area; from 1998 to 2008 and 2008 to 2018. Finally statistical analysis through Microsoft Excel has been performed to identify the amount of conversion from water body to the built-up urban area.
Selection of the study area
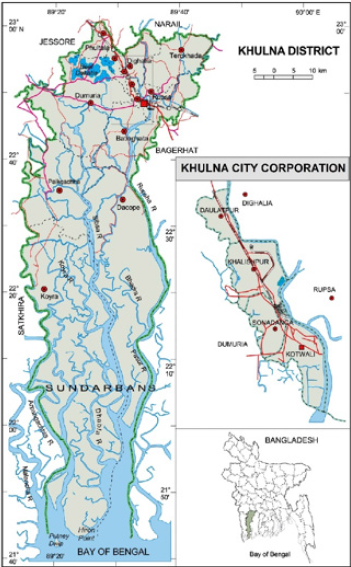
Khulna City Corporation is selected as study area considering several factors such as population growth, area expansion of City Corporation, industrialization, urbanization and so on. Khulna city is also known as an industrial city with massive urban expansion. KCC has an area of 50.61sq. km [8] which is located 22°50´30´´north latitude and 89°30´00´´east longitude, here mass surface water body area has been transformed into built-up urban space to meet rapid urbanization (Figure 1) [11].
Literature review
To systematically solve the research problem, at first understanding about the concept is build up from various journals, conference papers, published and unpublished articles to justify the rapid urbanization issue related to surface water body area encroachment. Several similar kinds of study such as pond filling location identification using GIS and RS technology, the association of surface water body area change with rapid urbanization [12] has been studied to understand the procedure of identifying the location of filled up surface water body area. Finally, a specific objective which is identifying the location and the amount filled up urban surface water body area using GIS and RS technology has been formulated from the literature review.
Data collection
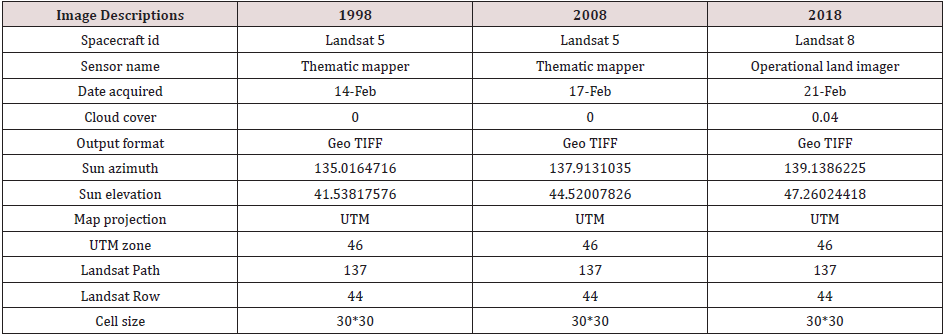
Remote sensing (RS) data is very popular to assess land cover scenario for different time periods, therefore Landsat 4-5 thematic mappers (TM) images sense date of 14 February 1998 and 17 February 2008 and operational land imager (OLI) sense date 21 February 2018 has been collected from the US Geological Survey (USGS) official website considering path 137 and row 44. Images were collected regarding one specific month to avoid seasonal variation (Table 1).
Table 1: Detailed about collecting data from earth explorer US Geological survey websites.
Source: Earth explorer US Geological survey websites [13].
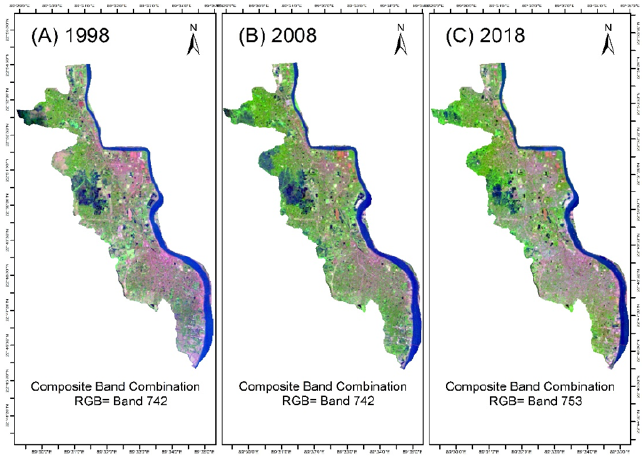
Following Figure 2. Represents the composite band combination of collected Landsat satellite image where (a), (b), (c) represents the year of 1998, 2008 and 2018.
Figure 2: Composite Band combination of collected Landsat satellite image where (a) represents the year of 1998 (b) represents the year of 2008 and (c) represents the year of 2018 [13].
Results and Discussion
Land cover change assessment
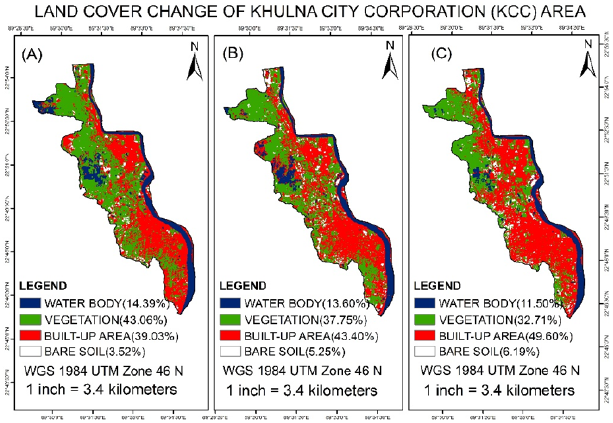
Land Cover Area consists of all residential, commercial and industrial areas including settlement, transportation infrastructure, river, wetlands, lakes, ponds, canals, trees, shrub, parks, open space playgrounds, grassland, vegetable lands, and bare soil. The primary land use land cover (LULC) classes in Bangladesh are agricultural land, urban and built-up area, forest and vegetation, water bodies, and wetlands [5]. In this regards, the KCC area consists the similar land cover characteristics as a tropical region in Bangladesh. Following Figure 3 represent the land cover classification of KCC area for the period of 1998, 2008, 2018. As urbanization increase, KCC area faces significant land cover change, therefore mass surface water body area replaced by new built-up area.
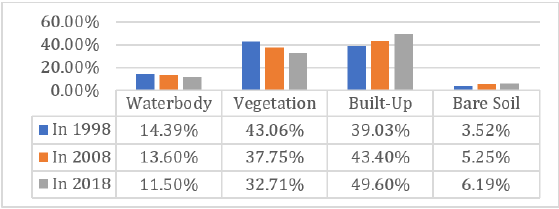
According to the land cover classification of KCC area, surface water body covers 14.39%, 13.60% and 11.50% land covers of 51.7833 square kilometers KCC area in the year of 1998, 2008 and 2018 at the same period the built-up urban area covers 39.03%, 43.40% and 49.60% land cover of KCC area. In this regard the amount of loss of surface water body area at the rate of 0.79% from 1998 to 2008 and 2.1% from 2008 to 2018. On the other hand, the increase rate of built-up urban area rises from 4.37% to 6.20% at two different periods from 1998 to2018. The result shows that the mass amount of water body area loss and built-up urban area rise at the period of 2008 to 2018. Following Figure 4 represents the percentage amount of different land cover change in KCC area regarding land cover classification.
Surface water body area assessment
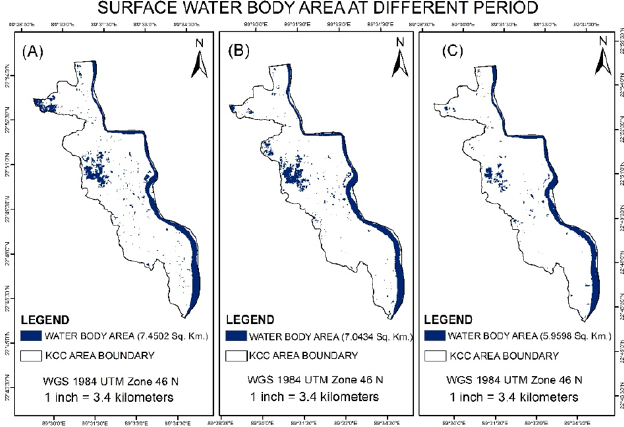
Surface water body area consists of river, permanent and seasonal wetlands, ponds, lakes, canals, reservoirs etc. The Rupsa and the Bhairab Rivers possess the most of the surface water body area in KCC. On the other hand, several ponds, lakes, canals, wetlands possess a considerable amount of surface water body area in KCC but in recent years the amount of surface water body area is decreasing to meet the rapid urbanization. In this regard, an assessment of surface water body area change for the year of 1998, 2008 and 2018 is illustrated by GIS and remote sensing techniques.
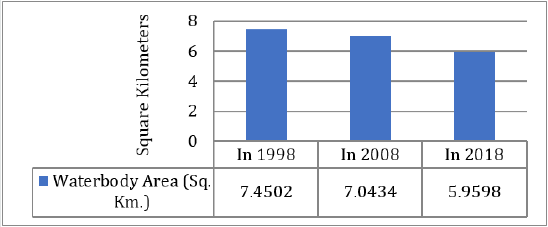
According to surface water body area change for the consequence of rapid urbanization across KCC area, above Figure 5(A-C) represents the scenario of surface water body area for three different periods of 1998, 2008, 2018. The twenty years surface water body change map shows a significant amount of surface water body area has been lost across KCC area. According to the month of February in the year of 1998 and 2008 the total amount of surface water body area was 7.4502 and 7.0434 square kilometers, but in 2018 only 5.9598 square kilometers of surface water body exist. In this regard, 0.4068 square kilometers surface water body area loss at the period of 1998 to 2008 but in the period of 2008 to 2018 the loss of surface water body area is 1.0836 square kilometers which are more than double from the period of 1998 to 2008. Following Figure 6 represent the amount of surface water body area for three different periods.
Surface water body area to built-up urban area conversion assessment
In recent years land cover change has been characterized by rapid urban growth and its expansion all over the world. KCC area is facing the same situation; therefore the mass amount of land cover is transformed into different land cover types. Conversion of one land cover to another land cover types not only hamper the physical form of surroundings but also it has adverse environmental consequence.
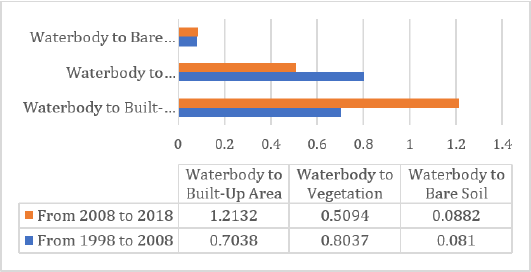
According to the conversion of the surface water body area to built-up urban area Figure, 7(A) and Figure 6(B) represents the location of the surface water body area which is filled up by builtup area at an amount of 0.7038 and 1.2132 square kilometers at the period of 1998 to 2008 and 2008 to 2018. Waterbody area also replaced by vegetation and bare soil area but their amount of replacement is much less than the built-up area. Following Figure 8 represents the details amount of conversion from surface water body area to different land cover form and from that result, the built-up urban area is identified as the main reason for the loss of surface water body area in KCC [13].
Conclusion
Surface waterbody is considered as one of the major strength of any urban area. It is difficult to deny the importance of the surface waterbody in conserving urban biodiversity. It also keep the urban environment cool from the high urban temperature. By conservation of urban surface waterbody from rapid urban development it is possible to ensure a sustainable city. Bangladesh is one of the developing country of south Asia, here urban development take place quite unplanned way which results in encroachment of lots of urban surface waterbody area for development activity. In recent years surface water body area in Khulna City Corporation is facing serious threat due to rapid population growth, urban development and extensive industrial activity.
The study shows that last twenty years KCC area’s surface water body area has been reduced from 14.39% to 11.50% and this process is continuing which indicates the amount of loss of surface water body area at the period of 1998 to 2008 and 2008 to 2018 rise from 0.79% to 2.1%. On the other hand, the increase rate of built-up urban area rises from 4.37% to 6.20%. Urban development not only encroaches the surface water body covers but also it reduced the rainwater catchment area across the Khulna city. It is true that we cannot stop the process of urbanization but we have to preserve the water body area for the better living environment, because surface waterbody conserves biodiversity and a considerable amount of water during rainy seasons. Only proper management of surface water body area can reduce the possibility of frequent urban flood. In this regard, the establishment of proper regulation is a demand of today’s to conserve surface water body area from rapid urban development.
References
- Bringezu S, Schütz H, Pengue W, O’Brien M, Garcia J (2014) Assessing global land use: balancing consumption with sustainable supply. United Nations Environment Program. International Resource Panel, Nairobi, Kenya.
- Islam N (2011) Urbanization in Bangladesh. International Seminar on Urbanization, Asiatic Society of Bangladesh. Dhaka, Bangladesh.
- D’amour C, Reitsma F, Baiocchi G, Barthel S, Güneralp M (2016) Future urban land expansion and implications for global croplands. Proceeding of the National Academy of Science of United State 114(34): 8939–8944.
- Raja DR (2012) GIS-based spatial simulation of impacts of urban development on changing both land cover area and land surface temperature in Dhaka city. Bangladesh University of Engineering and Technology, Dhaka, Bangladesh.
- Rai R, Zhang Y, Paudel B, Li S, Khanal NR (2017) A Synthesis of studies on land use and land cover dynamics during 1930–2015 in Bangladesh. Sustainability 9(10): 1866-1882.
- Hassan MM, Nazem MNI (2016) Examination of land use/land cover changes, urban growth dynamics, and environmental sustainability in Chittagong city, Bangladesh. Environment Development. And Sustainability 18(3): 697-716.
- Hassan MM (2017) Monitoring land use/ land cover change, urban growth dynamics and landscape pattern analysis in five fastest urbanized cities in Bangladesh. Remote Sensing Application Society and Environment 7(1): 69-83.
- Bangladesh Bureau of Statistics (BBS) (2011) Population & Housing Census, Community Report-Khulna, Government of the People’s Republic of Bangladesh.
- Qi ZF, Ye X, Zhang H, Yu ZL (2014) Land fragmentation and variation of ecosystem services in the context of rapid urbanization: The case of Taizhou city, China. Stochastic Environment Research and Risk Assessment 28(4): 843-855.
- Eastman JR (2011) IDRISI Taiga guide to GIS and image processing. Clark labs, Clark University, Worcester, United states.
- Ahmed B (2012) Modeling spatiotemporal urban land cover growth dynamics using RS and GIS techniques. ISPRS International Journal of Geo-Informatics 1: 3.
- Kafy AA, Ferdous L, Faisal AA, Khan HAH, Sheel PK (2018) Exploring the association of surface water body change and rapid urbanization in rajshahi city corporation area using RS and GIS. 1st National Conference on Water Resources Engineering, CUET, Chittagong, Bangladesh.
- Earth explorer, US Geological Survey. (2018) Using the USGS Landsat level-1 data product.

Top Editors
-

Mark E Smith
Bio chemistry
University of Texas Medical Branch, USA -

Lawrence A Presley
Department of Criminal Justice
Liberty University, USA -

Thomas W Miller
Department of Psychiatry
University of Kentucky, USA -

Gjumrakch Aliev
Department of Medicine
Gally International Biomedical Research & Consulting LLC, USA -

Christopher Bryant
Department of Urbanisation and Agricultural
Montreal university, USA -

Robert William Frare
Oral & Maxillofacial Pathology
New York University, USA -

Rudolph Modesto Navari
Gastroenterology and Hepatology
University of Alabama, UK -

Andrew Hague
Department of Medicine
Universities of Bradford, UK -

George Gregory Buttigieg
Maltese College of Obstetrics and Gynaecology, Europe -

Chen-Hsiung Yeh
Oncology
Circulogene Theranostics, England -
.png)
Emilio Bucio-Carrillo
Radiation Chemistry
National University of Mexico, USA -
.jpg)
Casey J Grenier
Analytical Chemistry
Wentworth Institute of Technology, USA -
Hany Atalah
Minimally Invasive Surgery
Mercer University school of Medicine, USA -

Abu-Hussein Muhamad
Pediatric Dentistry
University of Athens , Greece

The annual scholar awards from Lupine Publishers honor a selected number Read More...


