
Lupine Publishers Group
Lupine Publishers
Menu
ISSN: 2637-4668
Research Article(ISSN: 2637-4668) 
Estimation of the Grid Reinforcement Influence on Asphalt Plate Behaviour through FEM Analysis and Laboratory Testing Volume 1 - Issue 4
Gajewski Marcin and Gajewska Beata
- Road and Bridge Research Institute, Poland
Received: February 08, 2018; Published: February 19, 2018
Corresponding author: Gajewski Marcin, Road and Bridge Research Institute, Instytutowa 1, 03-302 Warsaw, Poland
DOI: 10.32474/TCEIA.2018.01.000116
Abstract
The paper deals with finite element modelling of the test carried out on plate samples made of asphalt mixture and reinforced with glass grid. The apparatus constructed for testing of plate samples in the large scale is modelled in detail as a contact problem. All materials are assumed to be linearly elastic and isotropic, and stiffness modulus of the asphalt mixture is determined on the samples cut out from the plate. The finite element solutions of the static indentation of the sample resting on elastic support with a circular steel indenter have shown that the grid reinforcement influence the overall behavior of the sample only in non-standard loading cases causing inhomogeneity of stress and strain fields or when the ratio between stiffness of the reinforced material and reinforcement material is particularly high (for example in case of asphalt mixtures at higher temperatures). The second conclusion was proven experimentally in the fatigue test carried out on reinforced and non-reinforced asphalt (HMAC 16 20/30) plate in two different temperatures equal to 10 and 30[oC]. In the higher temperature the maximum norm of the vertical displacement is increasing faster for non-reinforced plate than for the reinforced one.
Keywords: Pavements; Reinforcement; Experimental testing; Grids; FEM; Modelling
Introduction
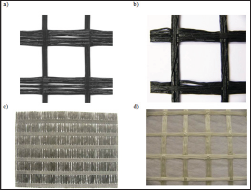
In designing and production of the pavements the glass, steel and carbon fiber grids are more often used [1-7]. Nevertheless, in the direct designing calculations, the grid reinforcement is not included. The application of the grid is taken into account through some transfer function allowing thickness reduction ofthe pavement layers. It is caused by the fact that in road laboratories there is no standard test, in which the influence of the reinforcing grid on the behaviour of the layered pavement is taken into account. In the paper [3], a laboratory test was proposed in which the influence of the reinforcing grid can be taken into consideration. The tests are carried out on plate samples with maximum size of 40x40x15 [cm], in which a grid with large mesh dimension can be placed while maintaining the representativeness of the sample, see (Figures 1 & 2). The influence of reinforcing grid on pavement behavior using the finite element method (FEM) can also be analyzed, cf. [8,9].
In FEM simulations, the most difficult problem is to characterize the physical behaviour of the so-called interface, i.e.the region of connection of the pavement layers with each other, which can additionally be enriched with reinforcing grid. It can be concluded that the constitutive models of road materials are quite well developed [10-13], while the interface models require refinement and experimental verification [2,14]. To carry out this verification indirectly the apparatus proposed in [3] may also be used. In this apparatus installed in a standard testing machine with a temperature chamber, the static, dynamic and fatigue tests can be carried out taking into account also the temperature influence. In the paper the FEM analysis of the static indentation test of reinforced asphalt plate resting on elastic foundation are presented in comparison with non-reinforced sample. The detailed analysis is presented, proving that the grid reinforcement is influencing mainly non-standard situations like local pavement damage, sub grade slipping, thermal cracking [15-17] etc. When pavement is working in the designing state, the grid reinforcement is not influencing its behavior much. This conclusion is supported by results of the fatigue experiment carried out on reinforced and non-reinforced asphalt plate in two different temperatures equal to 10 and 30 [ oC]. In the higher temperature the maximum norm of the vertical displacement is increasing faster for non-reinforced plate than for the reinforced one (Figure 1).
Figure 1: Examples of a grids used as asphalt pavement reinforcement: a) glass grid, b) bidirectional glass grid, c) glass grid with intermediate fibers, d) composite (glass grid + nonwoven).
The Apparatus for Evaluation the Influence of Grid Reinforcement on the Pavement Behaviour
Analyzed further apparatus for testing road pavement plate elements reinforced with grids has been presented in the paper [3]. At the design stage of the apparatus, the following conditions were considered:
a) the possibility of technical implementation of the apparatus,
b) the possibility of sampling from the pavement already made,
c) reduction of the scale effect, in the case of standard grids,
d) the possibility of fitting the apparatus in a testing machine with a temperature chamber without use of additional devices (limited weight and dimensions),
e) easy preparation of samples in the laboratory (technological conditions and limited mass),
f) the possibility of conducting static, dynamic and fatigue tests,
g) the possibility of determining the plate behavior at limit states, taking into account the limitations of the testing machine.
The basic idea of the proposed apparatus is the joint work of the sandwich element of the road pavement with the elastic element simulating the resistance from the remaining pavement layers [18,19]. This idea was used earlier in Van Dijk research [20], applied to the rutting apparatus, and then presented again in paper [21], in the context of the review of research methods used in road engineering. At the preliminary stage, it was determined that the size of the test sample in plan have to be large enough to reduce the scale effect. It was assumed that the sample will have the shape of a rectangular prism with a base dimensions allowing for testing grids with a mesh size close to few centimeters. From the other side the limiting criterion is the internal dimensions of the temperature chamber. Therefore, the dimensions were assumed to be equal to 40x40 [cm]. It was assumed that the sample is going to be loaded at its central point on the upper surface and would rest on a layer of elastic material of considerable stiffness. The load from the actuator is transmitted through a steel disc with a diameter d =200[mm] and thickness gp =6[mm], see (Figures 2 & 3).
Figure 2: The schematic view of the tested sample placed on elastic foundation (characteristic dimensions: fc=400[mm], h1=80[mm], h2=150[mm], d=200[mm], g =6[mm], s=40[mm], g=4[mm]).
p
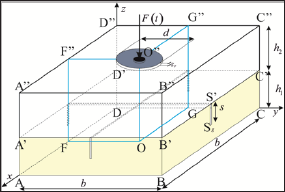
The elastic support with thickness h =80[mm] and dimensions in plan the same like sample dimensions may be additionaly notched as shown in Figures 2-4, what may simulate the cracks in the bottom pavement layers. In prototype presented in [9] and analyzed in this paper the orientation of the notches with depth s =40[mm] and thickness 4[mm] were assumed as shown in Figure 4. After considering the volume of the thermal chamber and the method of fixing the base of the apparatus to the lower fixture of the testing machine, it turned out that the cuboidal casing can have height not exceeding 230 [mm]. It follows that the sample can have maximum height equal to h2 =150 [mm]. Therefore, in the context of technological limitations and granulometric composition of typical asphalt mixtures, it turns out that the sample can consist of at most two layers with different proportions of thickness (Figure 2).
The polyurethane support together with the sample is placed in a steel casing that realizes unilateral contact conditions on the surfaces ABCD, ABB”A” BCC”B” ADD”A” CDD”C” This casing is completely dismountable, which facilitates sample placement, cleaning and disassembly of the apparatus. The apparatus was made from stainless steel meeting the conditions presented above. The walls of the casing are dismountable and their weight is reduced by removing excess of the material in the least stressed places. Fixing the walls to the base may be done on several levels depending on the needs (height of the tested sample/polyurethane pad). Having in mind that assumption was made about the possibility of testing on samples taken directly from the existing road pavement and a mold for making samples and a set of spacers, allowing thickness samples prepared in the laboratory, it was also necessary to prepare grading of individual layers and proper compaction.
Figure 3: a) The proposed apparatus with maximum possible sample thickness h2 =150[mm] mounted in temperature chamber, b) the view on the tested sample and rubber support with indication of the grid reinforcement interface.
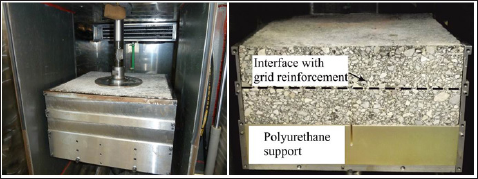
Figure 4: a) The polyurethane support placed in the apparatus with front and back wall taken off, b) the notch in the elastic polyurethane support.
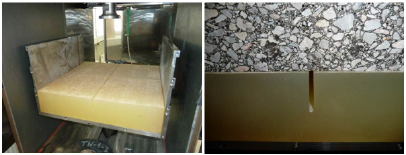
Table 1: Properties of the polyurethane support.

The polyurethane pad was made of material whose properties are listed in (Table 1). (Figures 3 & 4) show the implemented apparatus mounted in the temperature chamber of the MTS testing machine together with the sample placed in it.
FEM Model of the Test Apparatus and Analysis of the Tests with Static Loading
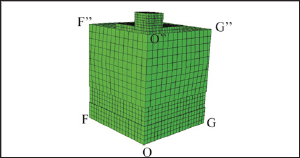
Due to the symmetry of the task, the quarter of the system is considered as shown in Figure 2 (marked in blue). The task was solved as a three-dimensional contact problem. The contact between the sample and the elastic support, the elastic support and the steel casing walls, between the sample and the casing walls was modelled, see (Table 2) and (Figure 5). The sample, the indenter and the polyurethane support were modeled with eight-node cubic elements with linear shape functions and reduced integration (in total 13129 elements C3D8 type), cf. (Figure 6). The dimensions of each individual model part are given in the description of Figure 2. The task was solved as a static problem in which the indenter load is linearly increasing up to 200 [kN]. As a consequence of the adopted assumptions related to the contact, the indenter affects the test sample of the asphalt mixture and tested plate contacts with the polyurethane support. The stress concentration profile under the indenter is similar to that under the real wheel [22,23]. The test can be carried out at any temperature (possible to be generated by the thermal chamber). It is assumed that the material parameters will be accepted as corresponding to 20 [oC ]. In the case of the asphalt mix (HMAC16 20/30), which is a material with rheological properties, the complex stiffness moduli at 10, 20 and 30 [oC] and frequencies of 0.1, 0.5, 1.0, 2.0, 5.0, 10.0, 20.0, 25.0, 30.0, 33.0 [Hz] were determined on the samples cut out from the tested plates [12,13,24-26]. The obtained results in bar chart are presented in Figure 7, where norm of the complex moduli as a function of temperature and frequency is shown (yellow bar indicates the analyzed case).
Figure 5: Norm of the complex stiffness modulus (E "| [MPa] ) as a function of frequency (f [Hz] ) and temperature (T [ °C] ) for asphalt mix.
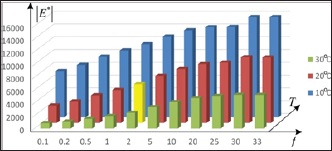
Figure 6: The geometry of the model: a) polyurethane support, steel walls on steel indenter, b) the model of the tested sample with indication of the interface.
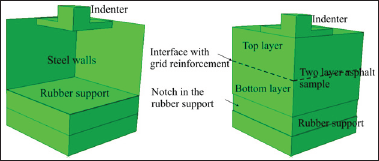
Table 2: Contact parameters.

Figure 7: FEM mesh for the analyzed problem (13129 elements of the C3D8R type).
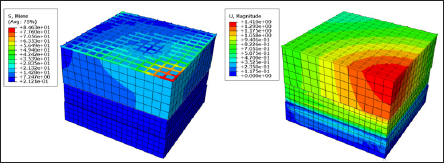
All materials in FEM analysis were modelled as isotropic linearly elastic materials [6,9,11] with parameters shown in (Tables 2 & 3) and (Figures 7 & 8). The glass grid with the mesh dimension 15 x 15 [mm] and the same stiffness in x and y directions was modelled with three-dimensional truss elements (T3D2 type) with a cross section area equal to 1.0[mm2] cf. [1]. In the interface cf. (Figure 8) the connection between materials is assumed as ideal one - the nodes of the mesh are common for upper part of the plate, for reinforcing grid and bottom part of the plate. The grid principal directions are coinciding with the axes of the coordinate system, cf. [2,14] (Figure 5). The problem was solved in two variants. In first variant the asphalt sample is non-reinforced while in the second it is reinforced with a glass grid. The obtained solutions for the final configuration (full loading of the indenter) in the form of contour graphs are presented in (Figures 8-10). Comparing the graphs of maximum and minimum principal strain and minimum principal stresses presented respectively in (Figures 9-12) one can conclude that it is the same solution. The first clear difference may be observed in the contour graph of maximum principal stresses shown in Figure 10. In case of reinforced plate the stress concentration is located in the grid compare also (Figure 13). In the following contour graphs the results are presented with grid exposition (Figures 14-16). The graphs prove that also in case of the plate reinforced with a grid the stresses in the grid concentrate near middle point of the sample.
Table 3: Material parameters in temperature 20[ ºC ].

Figure 8: Contour graph of displacement vector norm in case of a) unreinforced, b) reinforced plate.
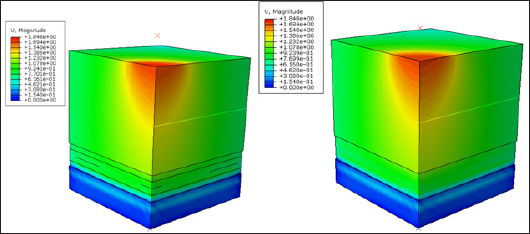
Figure 9: Contour graph of maximum principal strain in case of a) unreinforced, b) reinforced plate.
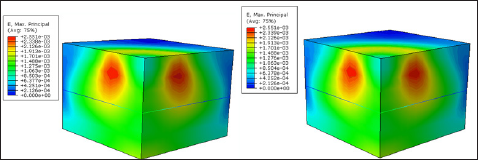
Figure 10: Contour graph of minimum principal strain in case of a) unreinforced, b) reinforced plate.
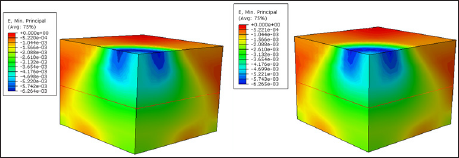
Figure 11: Contour graph of maximum principal stress in case of a) unreinforced, b) reinforced plate.
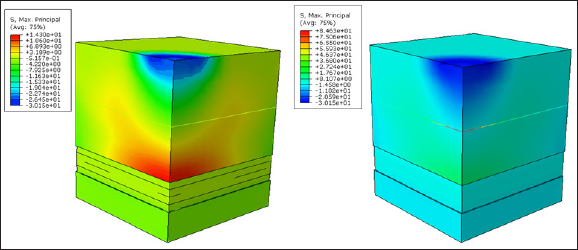
Figure 12: Contour graph of minimum principal stress in case of a) unreinforced, b) reinforced plate.
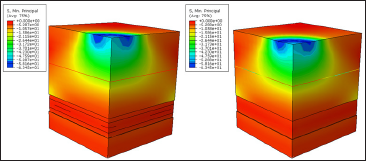
Figure 13: The graph of a) maximum and b) minimum principal stresses in the reinforcement grid.
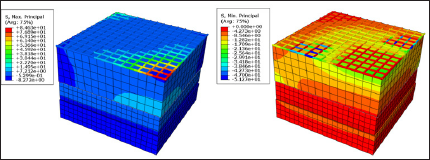
Figure 14: The graph of a) maximum and b) minimum principal strain in the reinforcement grid.
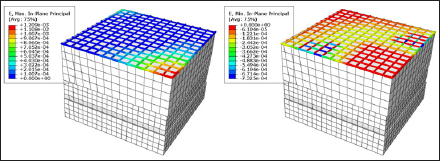
Figure 15: a) The graph of equivalent Mises stresses and b) norm of the displacement vector in the reinforcement grid.
The Results of Exemplary Fatigue Tests
Fatigue tests in road engineering are rather standard and are carried out using bending beams (4PB-four point bending) made of asphalt mixtures; see e.g. [21,24,25]. The dimensions of the beam, depending on the type of apparatus used, differ slightly, however, they are definitely too small to allow for considering the beam reinforcement. In a typical fatigue test the complex stiffness modulus is measured, at a fixed value of the amplitude of the displacement of the central axis of the beam and the set frequency (usually 10 [Hz]). The tests are carried out until the value of the norm of stiffness modulus drops to 50% of its initial value. In order to obtain the so-called full fatigue characteristic, the test is performed for different displacement amplitude values. Then, on logarithmic scale, the number of cycles needed to reduce the stiffness modulus by half as a function of the center displacement of the beam (or the extreme strain generated in the sample) is drawn. In order to check the usefulness and robustness of the testing apparatus, the fatigue tests on 150 [mm] thick plates were carried out, taking into account the reinforcement with glass grid and without reinforcement. Asphalt layers were made of asphalt concrete with a high stiffness modulus marked as HMAC 16 20/30 designed for the Polish road traffic category KR3-6.
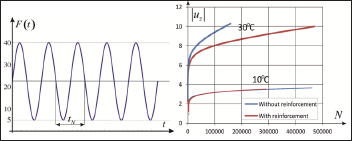
This mix is characterized by the voids ratio at the level of 14.9% (v/v), the content of road asphalt 20/30 at the level of 4.8% (m/m), the norm of the complex modulus at 10 [oC] and frequency 10 [Hz], equal to 17058 [MPa] (compare bar chart presented in Figure 7, good resistance to rutting (0.04 [mm/1000cycles]). Samples for initial tests were taken from the already placed road pavement. The sample was loaded with a force changing over time, as shown in Figure 8, reaching extreme values over time Fmax =40[kN] and Fmin=5[kN]. For subsequent load cycles, the total displacement of the indenter is recorded. Thus, the nature of this fatigue test is completely different from the standard test. Exemplary graphs of the total displacement increment as a function of the number of load cycles are shown in Figure 16, respectively for temperature 10[oC] and 30[oC]. In case of the lower temperature there is no visible difference in answer for reinforced and non-reinforced sample. On the other hand for higher temperature the influence of the reinforcement is visible and significant. The obtained results and Conclusion confirm those formulated on the basis of the FEM analysis, cf. also [1,15,22]. In the case of significant stiffness of asphalt mixtures (which is absolutely temperature-related), the introduction of reinforcement grid in normal conditions is of little importance. On the other hand, in the case of higher temperatures, the grid reinforcement is of great importance for reducing displacements, increasing resistance to rutting and increasing the durability of the road structure (Figure 16).
Figure 16: a) Loading function for fatigue test: F =40[kN], F . =5[kN], tN=1[s], b) results for fatigue tests for plates with and without reinforcement in temperature 10 and 30 [oC ].
Conclusion
The technical explanation of the grid influence on the sample overall behavior can be done on the basis of the FEM Analysis. The finite element solutions of the static indentation of the sample resting on elastic support with a circular steel indenter has shown that the grid reinforcement influence the overall behavior of the sample only in non-standard loading cases causing inhomogeneity of stress and strain fields or when the ratio between stiffness of the reinforced material and reinforcement material is particularly high (for example in case of asphalt mixtures at elevated temperatures). On the basis of the FEM analysis performed above the following particular Conclusion may be formulated:
a) In tested asphalt plate the stress and strain tensor components concentrate in the region under indenter. Thanks to the modelled contact the influence from indenter is similar to the influence of the wheel tire [22,23].
b) Having such inhomogeneity of stress and strain tensor field, still the influence of a grid application is visible only on contour graph of maximum principal stress (Figure 11). Grid having significantly higher stiffness resist to deformation and stresses in grid increase to the value exceeding 80[MPa]. In non-reinforced plate maximum principal stresses are about 12[MPa].
c) Comparing results of principle stresses in a grid (Figure 13) next to the tension stresses also the compression stresses appear (even higher than 50 [MPa]).
d) In all calculations the interface between plate parts and grid is assumed as ideal interaction (full displacement bounding, cf. (Figure 14). The real situations in the pavements not always allows for such assumption. Still describing behavior of not perfect interface is a general and not solved problem.
The laboratory tests results confirmed the results of analyzes using the finite element method. On the basis of the preliminary tests carried out in the apparatus proposed and built in Road and Bridge Research Institute the following Conclusion can be formulated:
a) The use of the proposed apparatus for comparative fatigue tests is possible without any additional technical changes.
b) In the case of fatigue tests, the positive effect of reinforcing grids at elevated temperatures is clearly visible.
c) For the chosen force amplitude the vertical displacement norm is increasing significantly after hundreds of thousand loading repetitions.
References
- Gajewski M, Jemioio S (2007) Ocena wpiywu zbrojenia siatkami warstwowych nawierzchni drogowych, 11th International Conference, Computer Systems Aided Science, Industry and Transport. TRANSCOMP pp. 215-220.
- Gajewski M, Jemioio S (2014) orthotropic composite constitutive model of mineral-asphalt mix reinforced with grid and its approximation with an isotropic model. Road Materials and Pavement Design p. 15(3): 521538.
- Gajewski M, Jemioio S, Bankowski W, Mirski K (2011) Propozycja badania do oceny wpiywu zbrojenia siatkami warstw nawierzchni drogowej. Logistyka pp.1025-1034.
- Maliszewski M, Harasim P, Maliszewska D, et al. (2014) Performance of long term glass-grid test section in Warsaw, Environmental Engineering.Proceedings of the International Conference on Environmental Engineering. ICEE Vilnius 9: 1-9.
- Maliszewski M, Harasim P, Maliszewska D, Zofka A (2016) Evaluation of Long-term Glass-grid Test Section using a Unique Method. In: JM Torrenti & F La Torre (Eds.). Materials and Infrastructures 2. John Wiley & Sons, Inc., Hoboken, NJ, USA.
- Nazarko J, Radziszewski P, Dçbkowska K, Ejdys J, Gudanowska A, et al. (2015) Foresight Study of Road Pavement Technologies. Procedia Engineering 122: 129-136.
- Nguyen ML, Blanc J, Kerzrého JP, Hornych P (2013) Review of glass fibre grid use for pavement reinforcement and APT experiments at IFSTTAR. Road Materials and Pavement Design 14(s1): 287-308.
- (2011) Abaqus Theory Manual, Version 6.11, Dassault Systèmes.
- (2011) Abaqus Analysis User's Manual, Version 6.11, Dassault Systèmes.
- Desai CS (2001) Advances in finite element modeling of rigid pavements. Special Issue of International Journal of Geomechanics 1: 3.
- Gagliano B, Blab R, Kappl K (2004) Models for permanent deformation for bituminous bound materials in flexible pavements. SAMARIS -Sustainable and Advanced Materials for Road Infra Structure.
- Nagôrski R, Wisniakowski P, Blazejowski K, Nagôrska M (2012) Comparative analysis of properties of Bürgers', Boguslavskis' and Zener's materials in view of tests of stress and strain in reference to properties of asphalt mixes. Roads and Bridges - Drogi i Mosty 11(1): 7-34.
- Zbiciak A, Michalczyk R (2014) Characterization of the Complex Moduli for Asphalt-aggregate Mixtures at Various Temperatures. Procedia Engineering 91: 118-123.
- Jemiolo S, Gajewski M, Maliszewski M, Mularzuk R, Sybilski D (2008) Theoretical models of road meshes and their use in standard pavement designing software. 4th Euroasphalt &Eurobitume Congress pp. 468-475.
- Chomicz-Kowalska A, Iwanski MM, Mrugala J (2017) Basic Performance of Fibre Reinforced Asphalt Concrete with Reclaimed Asphalt Pavement Produced In Low Temperatures with Foamed Bitumen. IOP Conference Series: Materials Science and Engineering.
- Judycki J, Jaskula P, Dolzycki B, Pszczola M, Jaczewski M, et al. (2015) Investigation of low-temperature cracking in newly constructed highmodulus asphalt concrete base course of a motorway pavement. Road Materials and Pavement Design 16(s1): 362-388.
- Szwed A, Kaminska I (2015) Mitigation of Low-temperature cracking in Asphalt Pavement by Selection of Material Stiffness. Procedia Engineering 111: 748-755.
- Raad L, Minassian G (2005) The Influence of Granular Base Characteristics on Upper Bound Shakedown of Pavement Structures. International Journal of Road Materials and Pavement Design 6(1): 5379.
- Scarpas A, Shourkry SN (2002) 3D Finite element modelling of pavement structures. Proc Third Intern Symp on 3D Finite Element for Pavement Analysis, 2002. Design and Research, Amsterdam, Holland.
- Van Dijk W (1975) Practical fatigue characterization of bituminous mixes. AAPT 44: 38-74.
- Judycki J (1991) Fatigue of Asphalt Mixes, Oulu, Finland, University of Oulu, Publications of Road and Transport Laboratory
- Jemiolo S, Gajewski M (2002) FEM modelling of interaction between vehicle wheel and road pavement. Scientific Works of Radom Technical University. Transport 1(15): 255-260 (in Polish).
- Pelc J (2010) An Attempt To Improve The Axisymmetric Model Of A Pneumatic Tire. Technical Sciences 13(1): 233-239.
- Pronk AC, Gajewski M, Bankowski W (2016) Application of a material fatigue damage model in 4PB tests. International Journal of Pavement Engineering pp. 1-10.
- Bankowski W, Tusar M, Wiman LG, Sybliski D, Gajewski M, et al. (2009) Laboratory and Field Implementation of High Modulus Asphalt Concrete. Requirements for HMAC Mix Design and Pavement Design. European Commission, Sixth Framework Programme, Sustainable Surface Transport.
- Jemiolo S, Gajewski M (2002) Constitutive models for description of asphalts and mineral-asphalt mixtures in road and airfield traffic pavements. Theoretical Foundations of Civil Engineering, X Polish- Ukrainian Transactions, pp 939-960.

Top Editors
-

Mark E Smith
Bio chemistry
University of Texas Medical Branch, USA -

Lawrence A Presley
Department of Criminal Justice
Liberty University, USA -

Thomas W Miller
Department of Psychiatry
University of Kentucky, USA -

Gjumrakch Aliev
Department of Medicine
Gally International Biomedical Research & Consulting LLC, USA -

Christopher Bryant
Department of Urbanisation and Agricultural
Montreal university, USA -

Robert William Frare
Oral & Maxillofacial Pathology
New York University, USA -

Rudolph Modesto Navari
Gastroenterology and Hepatology
University of Alabama, UK -

Andrew Hague
Department of Medicine
Universities of Bradford, UK -

George Gregory Buttigieg
Maltese College of Obstetrics and Gynaecology, Europe -

Chen-Hsiung Yeh
Oncology
Circulogene Theranostics, England -
.png)
Emilio Bucio-Carrillo
Radiation Chemistry
National University of Mexico, USA -
.jpg)
Casey J Grenier
Analytical Chemistry
Wentworth Institute of Technology, USA -
Hany Atalah
Minimally Invasive Surgery
Mercer University school of Medicine, USA -

Abu-Hussein Muhamad
Pediatric Dentistry
University of Athens , Greece

The annual scholar awards from Lupine Publishers honor a selected number Read More...


