Lupine Publishers Group
Lupine Publishers
Menu
ISSN: 2637-4668
Research Article(ISSN: 2637-4668) 
Analysis of Rainfall Trend in Selected States with in the Coastal Region of Nigeria using non-Parametric Mann-Kendall Test Statistics Volume 2 - Issue 3
Ihimekpen NI, Ilaboya IR* and Awah LO
- Department of Civil Engineering, University of Benin, Nigeria
Received: May 23, 2018; Published: June 11, 2018
Corresponding author: Ilaboya IR, Department of Civil Engineering, Faculty of Engineering, University of Benin, P.M.B 1154, Benin City, Edo State, Nigeria
DOI: 10.32474/TCEIA.2018.02.000139
Abstract
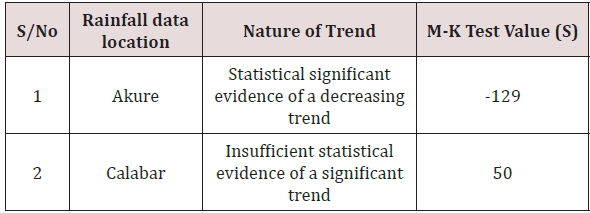
Trend in rainfall data have a great impact on the hydrological cycle and thus involve both the character and quantity of water resources. Analysis of trend in rainfall data also aids to see the result of rainfall variability on the occurrence of drought and flood. The aim of this research is to detect and estimate the magnitude of trend associated with rainfall data from Akure and Calabar which are located within the coastal region of Nigeria using non-parametric Mann-Kendall test statistics. Monthly data for thirty six (36) years spanning from 1980 to 2016 was used as input parameters for the analysis. Infilling of the missing records was done with the aid of expectation maximization algorithm which is unarguably one of the best missing value analysis techniques. Preprocessing of the rainfall data was done by conducting numerous time series validation test such as test of homogeneity, test of normality and outlier detection. Homogeneity test was aimed at testing the assumption of same population distribution; outlier detection was to detect the presence of bias in the data while test of normality was done to validate the claim that climatic data are not always normally distributed. In addition to testing the normality assumption of the data, normality test was also employed to select the most suitable trend detection and estimation technique. Results of the analysis revealed that the rainfall data from Akure and Calabar are statistically homogeneous. The records did not contain outliers and they are not normally distributed as expected for most climatic variables. The non-parametric trend detection and estimation analysis revealed that the rainfall data from Akure shows statistical significant evidence of a decreasing trend with a computed M-K trend value of -129. Although, the rainfall records from Calabar do not have sufficient statistical evidence of a significant trend, the computed M-K trend value was +50 which is; evidence of an increasing trend.
Keywords: Homogeneity test, Normality test, Labeling rule, Mann-Kendall test, Non-Parametric analysis
Introduction
Adequate planning and management of water resources for sustainable development is an issue of concern and have developed into a widely studied area. Accurate knowledge of the past and present trend of climatic data can aid in visualization and characterization of the water resource situation both in the past and even presently [1,2]. The trend results will not only provide a general idea of any changes noticeable within the climatic data, it will also point out certain concerns for the area regarding extreme precipitation events such as drought and flooding. Climatic data trend results will likewise suffice as a comparison for extreme precipitation events predicted by generalized time series forecasting models such as least square regression and multivariate regression model [3].
Trend in rainfall data have a great impact on the hydrological cycle and thus involve both the character and quantity of water resources. Analysis of trend in rainfall data also aids to see the result of rainfall variability on the occurrence of drought and flood [4]. Although numerous variables such as temperature, vegetation affects the hydrological cycle, precipitation remains the key climatic variable that governs the hydrologic cycle and the availability of water resources. Numerous studies have analyzed the changes in precipitation patterns in global as well as regional scale. Recent studies have also suggested that analysis of hydro-climatic variables should be done at the local scale rather than at a large or global scale because the trends and their impacts may be different from one location to the other [5].
There are many different ways in which changes in hydro-meteorological series can take place. A change can occur abruptly (step change) or gradually (trend) or may take more complex forms. A time series is pronounced to have trends, if there is a significant correlation (positive or minus) between the observations and time. Trends and shifts in hydrologic time series are usually introduced due to natural or artificial changes. Natural changes in hydrologic variables are usually gradual and are caused by a global or regional climate change, which would be a representative of changes occurring over the study area. Changes in monitoring variables that may not be able to be extrapolated over a study area could be caused by a gradual urbanization of the area surrounding the monitoring site, changes in the method of measurement at the monitoring site, or by moving the monitoring site even a short distance away. The artificial change is usually mentioned in the overall record at a monitoring site, but this information is not always shown in the sites’ data series. Thus, variables that appear to have a trend may actually just represent a change in climatological conditions near the monitoring site. In such a case, the affected climatological data should be changed so that the values are better represented of the study area as a whole [6].
A central factor in the modeling and analysis of the trend is the ability to establish whether a change or trend is present in the climatological record and to quantify this trend, if it is present. The trend in a time series data can be expressed by a suitable linear (parametric) or nonlinear (non-parametric) model depending on the behavior of the available data. The linear model is widely used in hydrology and the simplest of the linear models normally employed for trend detection is the Student’s t-test which requires that the series under testing should be normally distributed [6]. Most importantly therefore, whether or not the sample data follow a normal distribution has to be examined prior to the analysis in order to choose the appropriate model for trend detection and analysis. Unfortunately, most researchers ignore this important check. If normality is violated (if the available data do not follow a normal distribution), then, the nonparametric test such as the Mann-Kendall Test is commonly applied to assess the statistical significance of trends [7,8].
Research Methodology
Description of Study Area
Nigeria is located in West Africa between latitude 40 N and 140 N and between longitudes 20 E and 150 E. It has a total area of 925,796km2. The ecological zones of the country are broadly grouped into three, which are Sahel, Savannah and the Guinea zones. Nigeria is affected by the Tropical Continental and Tropical Maritime air masses. The Tropical Continental is responsible for the dry season while the Tropical Maritime is responsible for the rainy season. The intervening periods of transition from the real onset and cessation of rain falls between February and April and between September and November respectively. Also a depression is indicated in the rainfall amount during the month of August and this has been named the little dry season or August break or midsummer [9].
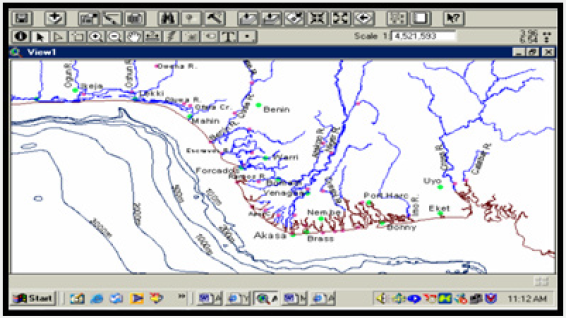
The Nigerian coastal zone sprawls a total of eight states, out of the thirty-six states of the Federation, namely: Akwa-Ibom, Bayelsa, Cross River, Delta, Edo, Lagos, Ondo, and Rivers. The coastal states are estimated to account for 25% of the national population. The coastal areas stretch inland for a distance of about 15km in Lagos in the West to about 150km in the Edo/ Delta and about 25km east of the Niger River. The coastline stretches for about 853km comprising inshore waters, coastal lagoons, estuaries and mangrove especially in the Niger Delta. Figure 1 shows the Nigeria coastal zones. The areas chosen as case studies for this study are Calabar the capital of cross River State which is located within the coasted mangrove swamp region and Akure the capital city of Ondo State.
Rainfall Data Collection
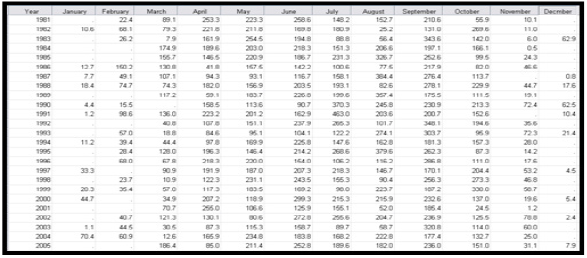
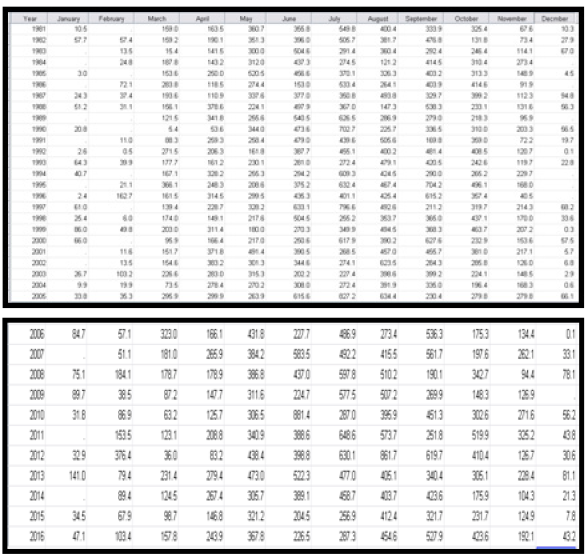
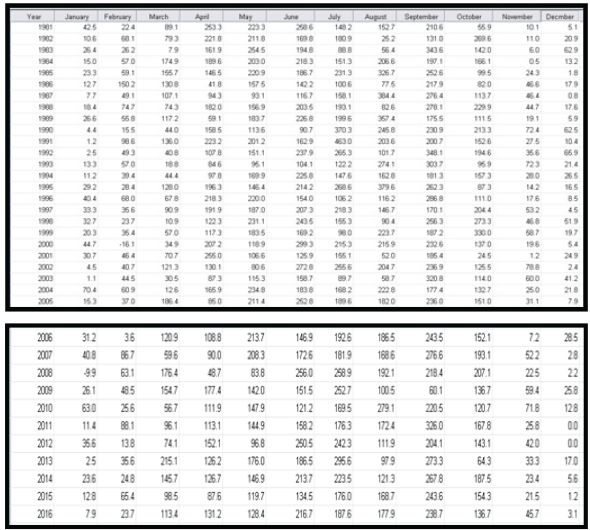
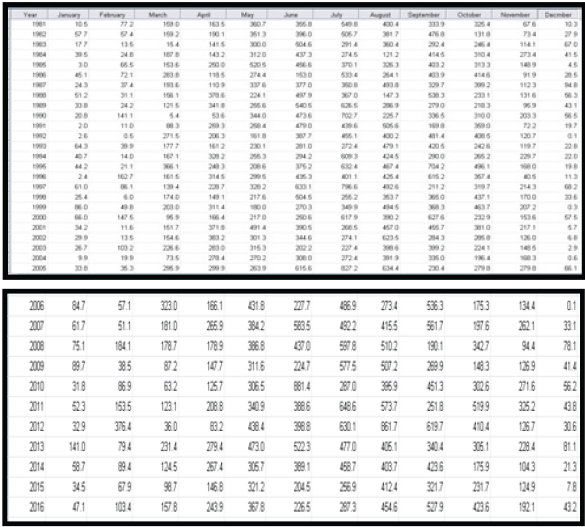
The data needed for this study was collected from Nigerian Meteorological Center, Oshodi, Lagos State, Nigeria. The data includes monthly precipitation data for 36 years spanning between; 1980 to 2016. Table 1 shows the records of the data from the different states under study
Preprocessing of Data
Climatic data collected was processed and used on monthly and seasonal basis for analytical convenience. Pre-processing of the data was aimed at:
i. Analysis of missing values
ii. Detection of outliers
iii. Test of Homogeneity
iv. Test of normality
Trend Detection using Mann-Kendall Test (M-K Test)
The test is usually known as Kendall tau statistics and has been widely used to test for randomness against trend in hydrology and climatology. It was employed in this study because it is a non-parametric ranked based procedure which is robust to the influence of extremes and good for use with skewed variables [6]. In addition, the test is highly resistant to the effects of outliers. The test was used to assess the presence of trends that is associated with the time series data.
Results and Discussion
The rainfall records collected from Akure and Calabar showing the missing values is presented in Tables 2a & 2b respectively.
The missing records were filled using expectation maximization algorithm. The null hypothesis for the little MCAR (missing completely at random) test was formulated as:
H0: the data are missing completely at random
H1: data are not missing completely at random
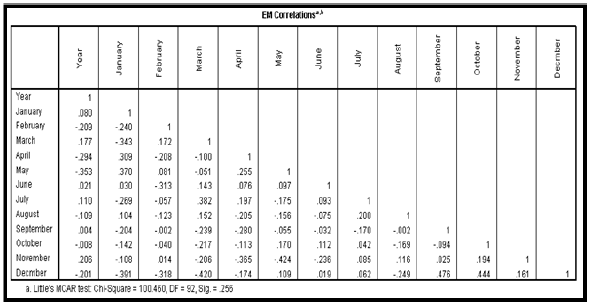
The analysis was conducted at 0.05 degree of freedom that is 95% confidence interval. Infilling of the missing records were based on the outcome of the correlation statistics which is critical to the fundamental assumptions of missing value analysis using expectation maximization algorithm. Results of the correlation statistics is presented in Tables 3a & 3b respectively.
From the correlation statistics of Tables 3a & 3b, a Probability (P) value of 0.256 and 0.428 were observed. Since P>0.05 we accepted the null hypothesis H0 and concluded that the data were missing completely at random. Based on this conclusion EMA was then employed to fill the missing values. The complete rainfall records for Akure and Calabar is presented in Tables 4a & 4b respectively. To detect the presence of outlier in the rainfall data, the labeling rule method was employed. The labeling rule is the statistical method of detecting the presence of outliers in data sets using the 25th percentile (lower bound) and the 75th percentile (upper bound). The underlying mathematical equation based on the lower and the upper bound is presented as follows:
Lower Bound Q1 − (2.2×(Q3 −Q1) (3.1)
Upper Bound Q3 + (2.2×(3 −Q1) (3.2)
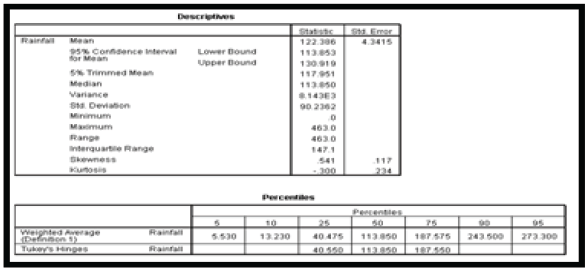
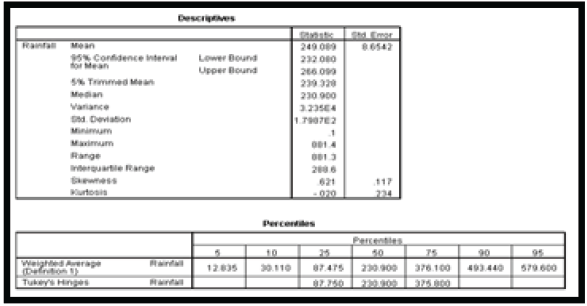
At 0.05 degree of freedom, any data lower than Q1 or greater than Q3 was considered an outlier [10]. The descriptive statistics of the data based on the outlier detection analysis is presented in Tables 5a & 5b respectively.
From the result of Table 5a, it was observed that the mean rainfall within the period under study was 122.386 while the variance and standard deviation of the rainfall data was observed to be 8.143E3 and 90.2362 respectively. Using the weighted average definition, the 25th percentile (Q1) was observed to be 40.475 while the 75th percentile (Q3) was observed to be 187.575. Adopting the labeling rule equation (3.1) and (3.2), the lower and upper bound statistics were calculated as follows:
Lower bound = 40.475 – (2.2(187.575 – 40.475)) = -283.145
Upper bound = 187.575 + (2.2(187.575 – 40.475)) = 511.195.
From the result of Table 5b, it was observed that the mean rainfall within the period under study was 249.089 while the variance and standard deviation of the rainfall data was observed to be 3.235E4 and 1.7987E2 respectively. To be 87.475 while the 75th percentile (Q3) was observed to be 376.100. Adopting the labeling rule equation (3.1) and (3.2), the lower and upper bound statistics were calculated as follows:
Lower bound = 87.475 – (2.2(376.100 – 87.475)) = -547.50
Upper bound = 376.100 + (2.2(376.100 – 87.475)) = 1011.075
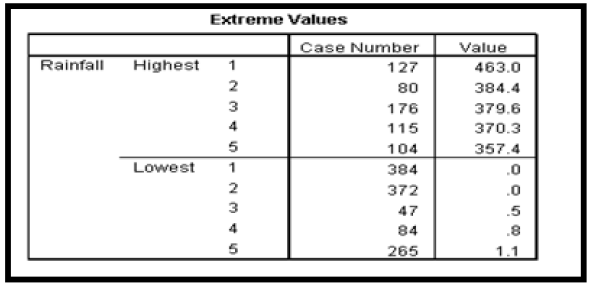
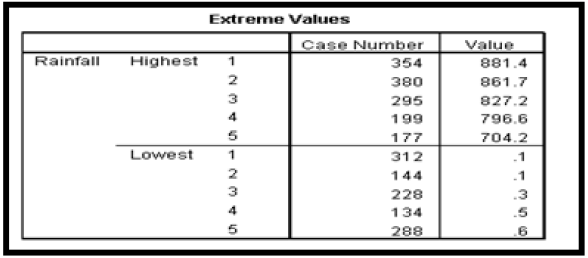
The extreme value statistics of Akure and Calabar rainfall data which shows the highest and lowest case numbers is presented in Tables 6a & 6b respectively.
From the result of Table 6a, it was observed that the highest rainfall value is 463.00mm which is less than the calculated upper bound of 511.195mm. The lowest rainfall value was observed to be 0.00 which is greater than the calculated lower bound of -283.145mm. Since no rainfall value is greater than the calculated upper bound or lower than the calculated lower bound, it was again concluded that the rainfall data from Akure is devoid of possible outliers. From the result of Table 6b, it was observed that the highest rainfall value is 881.40mm which is less than the calculated upper bound of 1011.075mm. The lowest rainfall value was observed to be 0.10 which is greater than the calculated lower bound of -547.50mm. Since no rainfall value is greater than the calculated upper bound or lower than the calculated lower bound, it was again concluded that the rainfall data from Calabar is devoid of possible outliers.
To ascertain that the rainfall data are from the same population distribution, homogeneity test was conducted. Homogeneity test is based on the cumulative deviation from the mean as expressed using the mathematical equation proposed by Raes et al. [11].
where
Xi=The record for the series X1 X2 ----------- Xn
¯X= The mean
Sks = the residual mass curve
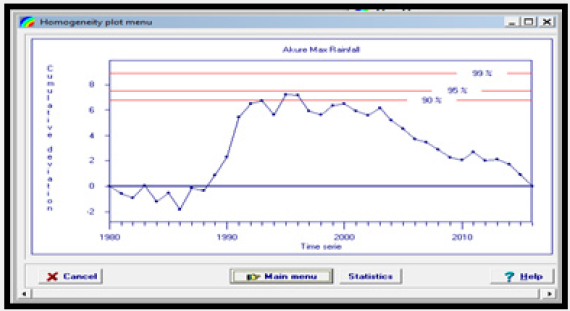
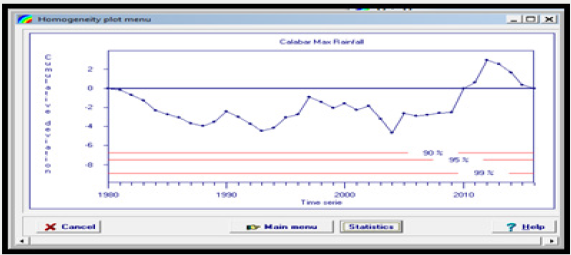
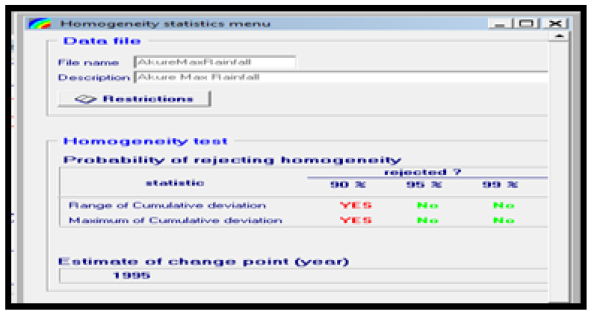
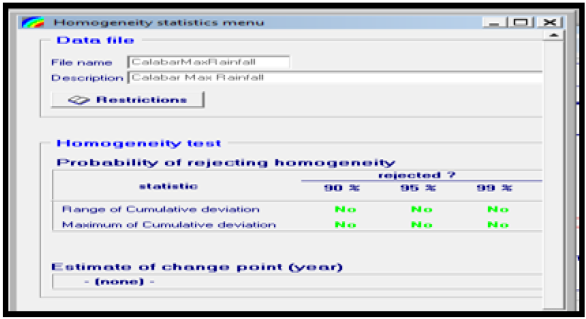
For a homogeneous record, one may expect that the Sks fluctuate around zero in the residual mass curve since there is no systematic pattern in the deviation Xi’s from the average values . To perform the homogeneity test, maximum rainfall values were extracted from the monthly rainfall data and analyzed using the Rainbow software. Results of the homogeneity test are presented in Figures 2a & 2b respectively.
Results of Figures 2a & 2b shows that the data point fluctuate around the zero center line an indication that the rainfall data are statistically homogeneous. To further confirm that the rainfall data are statistically homogeneous, test of hypothesis was done as follows:
H0: Data are statistically homogeneous
H1: Data are not homogeneous
The null and alternate hypothesis were tested at 90%, 95% and 99% confidence interval that is 0.1, 0.05 and 0.01 degree of freedom and results obtained are presented in Tables 7a & 7b respectively. From the result of Table 7a & 7b, the null hypothesis (H0) was accepted, and it was concluded that the rainfall data collected from Akure and Calabar, are statistically homogeneous at 95% and 99% confidence interval that is 0.05 and 0.01df.
On whether the rainfall data employed in this research are normally distributed, normality test was conducted. In addition to checking the distribution of the data, normality test was also aimed at selecting the most appropriate model for trend detection and estimation. If the data are normally distributed then parametric model such as least square linear regression will be most appropriate for trend detection and estimation otherwise non-parametric model such as Mann-Kendall and Thiel Sen’s slope estimation will be employed for detection and estimation of trend in the data.
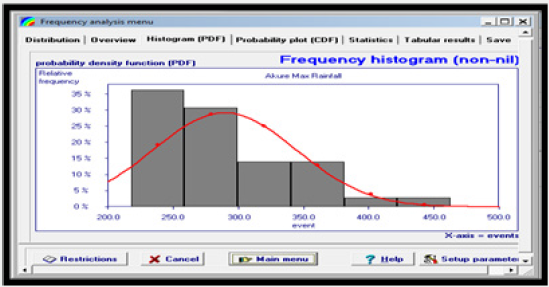
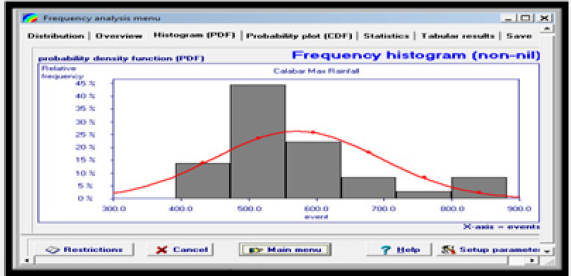
For normality the histogram of the rainfall data collected from Akure and Calabar should assumed the bell shaped configuration otherwise, it is concluded that the data are not normally distributed. The histogram of the rainfall data collected from Akure and Calabar are presented in Figures 3a & 3b respectively. From the result of Figure 3a & 3b, it was observed that the rainfall data from Akure and Calabar are not normally distributed which is expected for most climatic variables owing to their stochastic nature. To conclude the assumption of normality, statistical hypothesis were formulated as follows:
H0: The data are normally distributed
H1: The data are not normally distributed
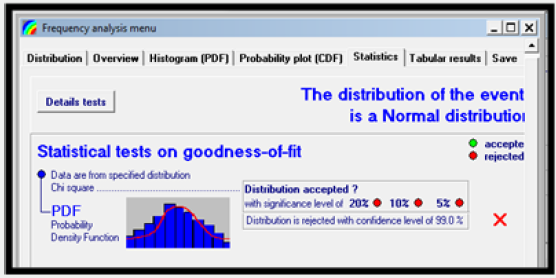
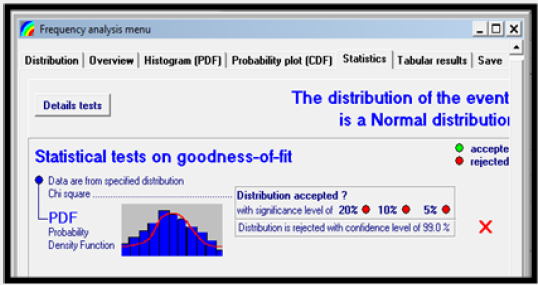
To validate the strength of the null hypothesis, normal probability analysis software was employed to test the normality behavior of the rainfall data at 99% confidence interval (0.01 degree of freedom). Result of the statistical analysis is presented in Figures 4a & 4b respectively Result of Figures 4a & 4b revealed that rainfall data from Akure and Calabar are not normally distributed at 99% confidence interval. The implication is that non-parametric test will be most suitable in detecting and estimating the magnitude of trend associated with the data.
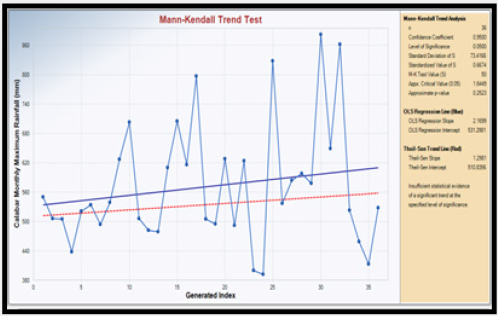
To perform the non-parametric analysis, the Mann-Kendall Trend test was employed. The test was conducted using Environmental Data Analysis Software (ProUCL). Results of the test are presented in Figures 5a & 5b respectively. From the results of Table 8, it was observed that there was insufficient statistical evidence of a significant trend in rainfall data collected from Calabar. That was not so with rainfall data from Akure as the non-parametric test result revealed a statistical evidence of a decreasing trend with M-K value index of -129.
Conclusion
The focus of the present study was to analyze time series data such as rainfall collected from Akure and Calabar using different time series analysis procedures. Based on the overall results, the following conclusions were made:
i. Expectation maximization algorithm was highly effective for the infilling of missing climatic data such as rainfall. It was observed in all cases that the null hypothesis of missing completely at random was satisfied since p- value was always greater than 0.05
ii. Based on the outcome of the outlier detection analysis, it was concluded that climatic data used for this present analysis are devoid of possible outliers
iii. Results of normality test further support the existing claim that climatic data are not always normally distributed owing to their stochastic nature.
iv. Although, the non-parametric statistical analysis based on Mann-Kendall test revealed that statistical evidence of an increasing trend was observed in rainfall data from Akure, it was also observed that there was insufficient statistical evidence of a significant trend in rainfall data collected Calabar.
References
- Kerkides P, Soulis K, Psomiadis E, Giannoulopoulos P (2007) Water Resource Conditions Assessment in Greece and Their Role in Desertification. International Conference on Environmental Science and Technology pp. 123-156.
- Tsiourtis NX (2002) GREECE-Water Resources, Planning and Climate Change Adaptation. Water, Wetlands and Climate Change, The Global Water Partnership (GWP) and The World Conservation (IUCN) conference, Athens pp. 145-165.
- Ismail A, Oke IA (2012) Trend analysis of precipitation data in Birnin Kebbi, Nigeria. International Research Journal of Agricultural Science and Soil Science 2(7): 286-297.
- Ifabiyi IP, Ojoye S (2013) Rainfall Trends in the Sudano-Sahelian Ecological Zone of Nigeria. Earth Science Research 2(2): 194-202.
- Shishutosh B, Nitin M, Ng AWM, Perera BJC (2013) Rainfall trend and its implications for water resource management within the Yarra River catchment, Australia. Hydrological Processes 27(12): 1727-1738.
- Hameed KH, Rao AR (2008) A modified Mann- Kendall trend test for auto correlated data. Journal of Hydrology 204(1-4): 182-196.
- Marshall E, Randhir T (2007) Effect of Climate Change on Watershed System: A Regional Analysis Climate change. Journal of Earth System Science 23(1): 265-283.
- Lubes Niel H, Masson JM, Paturel JE, Servat E (1998) Climatic variability and statistics: A simulation approach for estimating power and robustness of tests of stationarity. Journal of Water Science 11(3): 383- 408.
- Alli AA, Oguntunde PG, Olufayo AA, Fasinmirin JT (2012) Implications of Trends and Cycles of Rainfall on Agriculture and Water Resource in the Tropical Climate of Nigeria. Special Publication of the Nigerian Association of Hydrological Sciences pp. 188-200.
- Levi DB, Julie EK, Olsen JR, Pulwarty RS, Raff DA, et al. (2009) Climate Change and Water Resources Management: A Federal Perspective. Circular 1331 pp. 1-72.
- Raes D, Willens P, Gbaguidi (2006) Rainbow–A software package for analyzing data and testing the homogeneity of historical data sets. 1: 1-15.

Top Editors
-

Mark E Smith
Bio chemistry
University of Texas Medical Branch, USA -

Lawrence A Presley
Department of Criminal Justice
Liberty University, USA -

Thomas W Miller
Department of Psychiatry
University of Kentucky, USA -

Gjumrakch Aliev
Department of Medicine
Gally International Biomedical Research & Consulting LLC, USA -

Christopher Bryant
Department of Urbanisation and Agricultural
Montreal university, USA -

Robert William Frare
Oral & Maxillofacial Pathology
New York University, USA -

Rudolph Modesto Navari
Gastroenterology and Hepatology
University of Alabama, UK -

Andrew Hague
Department of Medicine
Universities of Bradford, UK -

George Gregory Buttigieg
Maltese College of Obstetrics and Gynaecology, Europe -

Chen-Hsiung Yeh
Oncology
Circulogene Theranostics, England -
.png)
Emilio Bucio-Carrillo
Radiation Chemistry
National University of Mexico, USA -
.jpg)
Casey J Grenier
Analytical Chemistry
Wentworth Institute of Technology, USA -
Hany Atalah
Minimally Invasive Surgery
Mercer University school of Medicine, USA -

Abu-Hussein Muhamad
Pediatric Dentistry
University of Athens , Greece

The annual scholar awards from Lupine Publishers honor a selected number Read More...


